filed by gardner denver holdings, inc
TRANSCRIPT

Filed by Gardner Denver Holdings, Inc.pursuant to Rule 425 under the Securities Act of 1933
and deemed filed pursuant to Rule 14a-12under the Securities Exchange Act of 1934
Subject Company: Gardner Denver Holdings, Inc.SEC File No.: 001-38095Date: October 29, 2019
Gardner DenverQ3 2019 Earnings Presentation October 29, 2019

Replay Information Dial toll-free:+1.877.344.7529 International:+1.412.317.0088 Conference ID:#10136110 Log on to:https://investors.gardnerdenver.com2

DisclaimerForward-Looking Statements Duringthecourseofthispresentation,wemaymake“forwardlookingstatements”withinthemeaningoftheUSfederalsecuritieslaws.Infact,allstatementsmadeduringthispresentationotherthanstatementsofhistoricalfactareforwardlookingstatements.Wordssuchas“expects,”“anticipates,”“believes,”“estimates,”“plans,”“intends,”“projects”and“indicates”andvariationsofsuchwordsorsimilarexpressionsareintendedtoidentifyforwardlookingstatements.Althoughtheyreflectourcurrentexpectations,thesestatementsarenotguaranteesoffutureperformance,andactualresultsmaydiffermateriallyfromwhatisexpressedinorindicatedbytheseforwardlookingstatements.Forwardlookingstatementsaresubjecttorisksanduncertaintiesthatcouldcauseactualperformanceorresultstodiffermateriallyfromthoseexpressedinsuchforwardlookingstatements,includingthoserisksanduncertaintiesdescribedunderthesectiontitled“RiskFactors”inourmostrecentannualreportonform10KfiledwiththeSecuritiesandExchangeCommission(“SEC”),whichrisksanduncertaintiesmaybeupdatedfromtimetotimeinourperiodicfilingswiththeSEC(accessibleontheSEC’swebsiteatwww.sec.gov).Forwardlookingstatementsspeakonlyasofthedatethestatementsaremade.TheCompanydoesnotundertaketoupdateanyforwardlookingstatementsasaresultoffuturedevelopmentsornewinformation,exceptasrequiredbylaw.Non-GAAP Financial MeasuresIncludedinthispresentationarecertainnonGAAPfinancialmeasuresdesignedtosupplement,andnotsubstitute,thefinancialinformationpresentedinaccordancewithgenerallyacceptedaccountingprinciplesintheUnitedStatesofAmericabecausemanagementbelievessuchmeasuresareusefultoinvestors.ThereconciliationofthosemeasurestothemostcomparableGAAPmeasuresisdetailedinGardnerDenver’spressreleaseforthethirdquarterof2019,whichisavailableathttps://investors.gardnerdenver.com,aswellasinslides17-19ofthispresentation.3

Agenda Company Highlights Guidance Segment Highlights Strategy Update Gardner Denver/Ingersoll Rand Industrials Integration Update Q&A 4

Q3 2019 Highlights Revenue of $597M, down 11% excluding FX Adjusted EPS2of $0.41and Adjusted EBITDA of $142M with margin of 23.8% Adjusted EBITDA margin expansion of 30 bps sequentiallyvs Q2’19 with $32M less revenue Upstream Energy (represents ~20% of revenue) Revenue down 46%; Q3 market conditions in line with expectations… expecting sequential declines in Q4 Remainder of GDI businesses (represents ~80% of revenue)3 Revenue up 1%and orders up 3%excluding FX… on top of 8% revenue and orders growthin prior year excluding FX Global market conditions continued to soften resulting in quarter end ramp not materializing (most notably in the US) and large project pushouts; also experienced FX headwinds… expecting similar market conditions for remainder of 2019 Executed incremental restructuring action in September that is expected to deliver$10M in annualized savingsacross total business (expecting ~$2M in 2019) Free cash flow (FCF)4of $105M, FCF conversion of 254%5, and net debt leverage of 1.9x6 Updating full year Adjusted EBITDA guidanceto a range of $550M to $570M 1All comparisons are versus the applicable prior year period unless otherwise noted 2Adjusted EPS is defined as adjusted net income divided by adjusted diluted average shares outstanding 3Remainder of GDI businesses defined as Industrials, Medical and mid/downstream Energy businesses 4Free Cash Flow is defined as cash flows from operations less capital expenditures 5Free Cash Flow conversion is defined as free cash flow divided by reported net income 6Leverage defined as net debt divided by LTM Adjusted EBITDA 5

2019 Adjusted EBITDA Bridge 1,2 2018 to2019 Adjusted EBITDA Bridge 2018A $682M Industrials+ Mid/Down + Medical +28M Upstream Energy (115M) FX (20M) Corporate (15M) 2019E $560M (Range $550M -$570M) Industrials + Mid/Down + Medical: Solid flow through from commercial (innovation, aftermarket, etc.) and operational initiatives (i2V, restructuring, cost control) Upstream Energy: Original equipment expected to be down ~70% ~85% of total 2019 revenue comprised of high quality aftermarket parts and services Less than 10% of GDI and IR Industrials combined revenue FX: Headwinds largely from EUR and GBP movements Corporate: PY legal recoveries previously expensed ~($8M) Growth investments ~($5M); Other ~($2M) 1All Adjusted EBITDA estimates and variances are approximations and based on forward looking expectations; Segment and Corporatevariances are stated excluding the impact of FX 2All commentary is on a total year basis and comparisons are to prior year unless otherwise noted 6

Revised 2019 Guidance 2019 Guidance (July 2019) Revised 2019 Guidance (October 2019) Revenue1Growth (ex-FX)Growth (ex-FX) Industrials up MSD up LSD Medical up MSD up MSD Mid & Downstream Energy up MSD flat Upstream Energy down ~30% down ~35-40% Total Gardner Denver down LSD down MSD FX Impact down LSD down LSD Total Gardner Denver (incl. FX) down LSD to MSD down HSD Adjusted EBITDA $610M –$630M $550M –$570M Capital Expenditure ~$50M –$60M ~$50M Tax Rate 22% –24% ~20% Year-end Net Debt Leverage2 1.8x –2.0x ~2.0x FCF Conversion to Reported NI / FCF $ ~100% / ~$300M >100% / ~$275M Average Shares Outstanding3 ~209M ~209M 1All revenue outlook commentary expressed in percentages 2Excluding the impact of any potential M&A activity or share repurchases 3Represents the expectation of weighted average diluted shares outstanding for the balance of the year based on ending share count and share price as of September 30, 2019 7
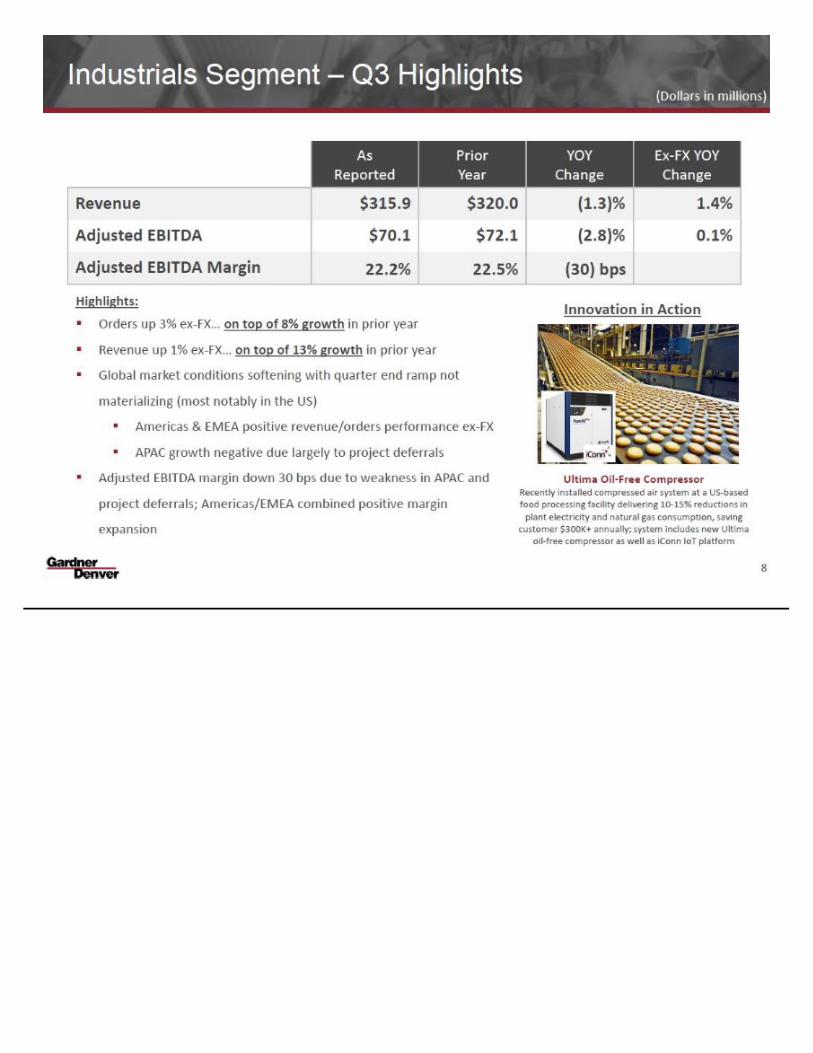
Industrials Segment –Q3 Highlights (Dollars in millions) Highlights: Orders up 3% ex-FX… on top of 8% growthin prior year Revenue up 1% ex-FX… on top of 13% growthin prior year Global market conditions softening with quarter end ramp not materializing (most notably in the US) Americas & EMEA positive revenue/orders performance ex-FX APAC growth negative due largely to project deferrals Adjusted EBITDA margin down 30 bps due to weakness in APAC and project deferrals; Americas/EMEA combined positive margin expansion As Reported Prior Year YOY Change Ex-FX YOY Change Revenue $315.9 $320.0 (1.3)% 1.4% AdjustedEBITDA $70.1 $72.1 (2.8)% 0.1% Adjusted EBITDAMargin 22.2% 22.5% (30) bps Innovation in Action Ultima Oil-Free Compressor Recently installed compressed air system at a US-based food processing facility delivering 10-15% reductions in plant electricity and natural gas consumption, saving customer $300K+ annually; system includes new Ultima oil-free compressor as well as iConn IoT platform 8

Energy Segment –Q3 Highlights (Dollars in millions) As Reported Prior Year YOY Change Ex-FX YOY Change Revenue $208.5 $298.8 (30.2)% (29.0)% AdjustedEBITDA $55.4 $94.9 (41.6)% (40.7)% Adjusted EBITDAMargin 26.6% 31.8% (520) bps Highlights: Orders down 20% ex-FX Upstream orders down 37% ex-FX in line with market expectations Mid/downstream up 10% ex-FX; market environment softening and project quote to order cycle extending Revenue down 29% ex-FX Upstream revenue down 46% Mid/downstream down 1% ex-FX Adjusted EBITDA margin down 520 bps due to revenue decline in upstream slightly offset by relatively stable margin performance in mid/downstream Innovation in Action Valves and Seats Manufacturing Significant investments in state-of-the-art facilities, automation and lean manufacturing driving productivity gains on the shop floor; over 1M parts produced in the last 12 months 9

Medical Segment –Q3 Highlights (Dollars in millions) As Reported Prior Year YOY Change Ex-FX YOY Change Revenue $72.3 $70.5 2.6% 4.8% AdjustedEBITDA $22.4 $20.5 9.3% 12.2% Adjusted EBITDAMargin 31.0% 29.1% 190 bps Highlights: Orders down 8% ex-FX… on top of 21% growthin prior year Decline due largely to timing of PY order which customer is now ordering in smaller quarterly installments Revenue up 5% ex-FX Strong broad-based performance across all product technologies and geographies Adjusted EBITDA margin up 190 bps driven by volume growth and operational efficiencies Innovation in Action Automated Liquid Handling Sample Preparation & Analysis System Highly engineered system incorporating multiple GDI Medical technologies including robotic liquid handling systems and specialty syringe pumps; system delivering over 30% efficiency gains to customer due to faster and more reliable testing 10

Our Strategy Deploy Talent Expand Margins Accelerate Growth Allocate Capital Effectively 11

Integration Planning Process: Procurement Example Similar Process Across Other Areas (Operations, G&A, etc.) to Deliver $250M Cost Synergies1 Synergy Funnel Development: Procurement Example Data request Data & interviews Data request Data & interviews Clean Team Suppliers Ingersoll Rand Industrials Gardner Denver Pre Day 1 Post Day 1• A Clean Team has consolidated spend detail across both companies & is building “ready-to-go” RFQ’s starting Day 1… currently analyzed ~90% of direct spend ($2B+) & ~60% of indirect spend ($0.4B+) • Utilizing principles of Gardner Denver Execution Excellence Process (GDX) to drive development of synergy funnel across all other workstreams 1 We expect to be able to realize anticipated cost synergies of ~$250M by the end of year 3 after closing. We expect to incur ~$450M of expense in connection with both achieving these cost synergies and the associated separation.12
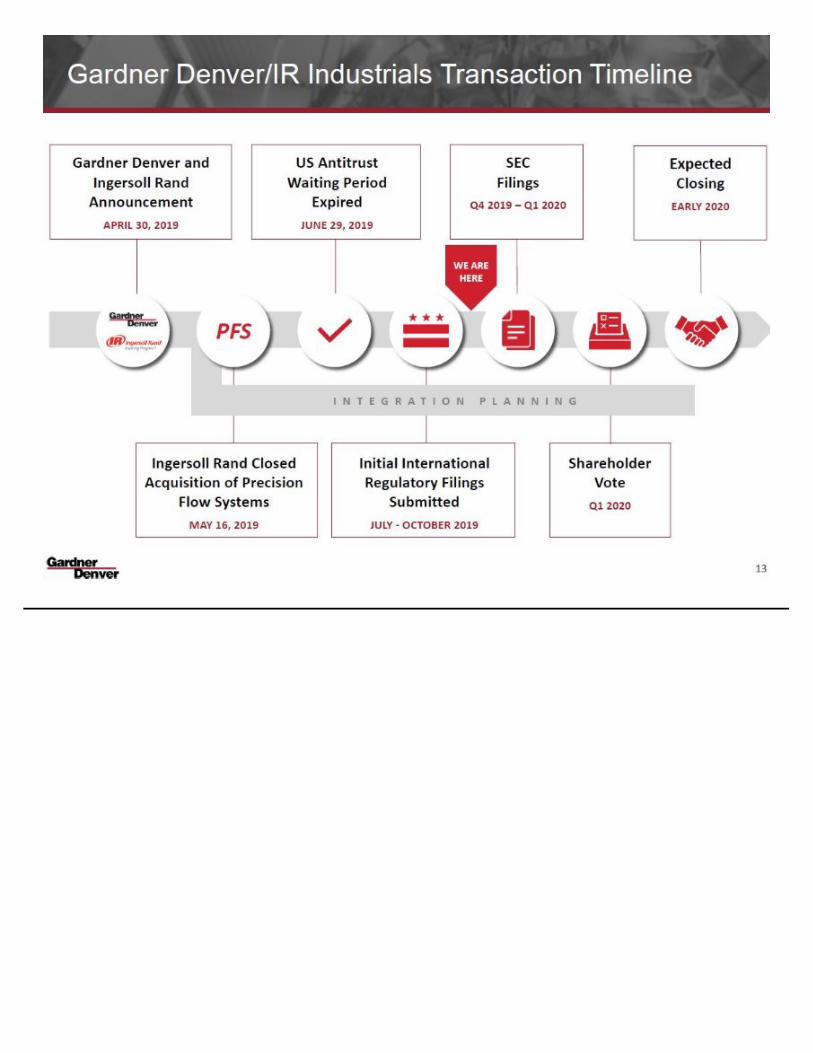
Gardner Denver/IR Industrials Transaction Timeline Gardner Denver and Ingersoll Rand Announcement APRIL 30, 2019 US AntitrustWaiting Period Expired JUNE 29, 2019 SEC Filings Q4 2019 –Q1 2020 Expected Closing EARLY 2020 PFS WE ARE HERE INTEGRATION PLANNING Ingersoll Rand Closed Acquisition of Precision Flow Systems MAY 16, 2019 Initial International Regulatory Filings Submitted JULY -OCTOBER 2019 Shareholder Vote Q1 2020 13

Appendix

Q3 2019 Financial Performance (Dollars in millions, excl. EPS) Revenue $689 $597 Q3 2018 Q3 2019 Adjusted EBITDA $182 $142 Q3 2018 Q3 2019 Adjusted EPS1 $0.49 $0.41 Q3 2018 Q3 2019 Down 13% Down 11% ex-FX Down 22% Margin Down 260 bps Down 8 Cents 23.8% Margin 26.4% Margin Industrials +1% ex-FX Medical +5% ex-FX Energy -29% ex-FX Industrials -30 bps Medical +190 bps Energy -520 bps 1Adjusted EPS is defined as adjusted net income divided by adjusted diluted average shares outstanding 15

Q3 2019 Financial Performance Leverage Free Cash Flow 1 Working Capital (Op. Working Capital as % of LTM Sales) (Net Debt / LTM Adjusted EBITDA) 128% 254% Q3 2018 Q3 2019 2.2x 2.0x 1.9x Q3'18 Q2'19 Q3'19 Improved 130 bps Improved 0.3x Y/Y ¹ Free Cash Flow is defined as cash flows from operations less capital expenditures; Free Cash Flow conversion is defined as free cash flow divided by reported net income 25.2% 23.9% Q3 2018 Q3 2019 (Dollars in millions) Industrials decreased 450 bps Medical decreased 570 bps Energy increased 550 bps $105M $93M (FCF Conversion in % and FCF in $)16

Reconciliation of Net Income and Earnings per Share to Adjusted Net Income and Adjusted Earnings per Share 2019201820192018Net Income41.3$ 72.2$ 133.4$ 174.9$ Basic Earnings Per Share (As Reported)0.20$ 0.36$ 0.66$ 0.87$ Diluted Earnings Per Share (As Reported)0.20$ 0.35$ 0.64$ 0.83$ Plus:Provision for income taxes9.0 22.6 29.2 63.2 Amortization of acquisition related intangible assets27.9 27.2 84.5 82.8 Restructuring and related business transformation costs9.9 12.3 16.1 25.2 Acquisition related expenses and non-cash charges15.9 2.8 34.7 13.1 Expenses related to public stock offerings- 0.3 - 2.2 Establish public company financial reporting compliance- 1.3 0.6 3.2 Stock-based compensation0.5 1.1 16.9 2.9 Foreign currency transaction (gains) losses, net(0.6) (0.8) 3.1 (0.6) Loss on extinguishment of debt- 0.9 0.2 1.0 Shareholder litigation settlement recoveries- - (6.0) (4.5) Other adjustments(0.1) 0.7 0.8 0.4 Minus:Income tax provision, as adjusted17.537.957.987.7Adjusted Net Income86.3$ 102.7$ 255.6$ 276.1$ Adjusted Basic Earnings Per Share0.42$ 0.51$ 1.26$ 1.37$ Adjusted Diluted Earnings Per Share10.41$ 0.49$ 1.23$ 1.32$ Average shares outstanding:Basic, as reported204.2201.9203.1201.8Diluted, as reported209.0209.1208.6209.6Adjusted diluted1209.0209.1208.6209.6GARDNER DENVER HOLDINGS, INC. AND SUBSIDIARIES RECONCILIATION OF NET INCOME AND EARNINGS PER SHARE TO ADJUSTED NET INCOME AND ADJUSTED EARNINGS PER SHARE (Dollars in millions, except per share amounts)(Unaudited)For the Nine MonthFor the Three MonthPeriod EndedSeptember 30,Period EndedSeptember 30,1 Adjusted diluted share count and adjusted diluted earnings per share include incremental dilutive shares, using the treasury stock method, which are added to average shares outstanding. 17

Reconciliation of Net Income to Adjusted EBITDA and Adjusted Net Income and CFOA to Free Cash Flow 2019201820192018Net Income41.3$ 72.2$ 133.4$ 174.9$ Plus:Interest expense23.2 24.4 68.0 76.5 Provision for income taxes9.0 22.6 29.2 63.2 Depreciation expense12.7 13.4 40.3 41.2 Amortization expense30.4 31.0 92.6 93.4 Restructuring and related business transformation costs9.9 12.316.1 25.2Acquisition related expenses and non-cash charges15.9 2.834.7 13.1Expenses related to public stock offerings- 0.3- 2.2Establish public company financial reporting compliance- 1.3 0.6 3.2 Stock-based compensation0.5 1.1 16.9 2.9 Foreign currency transaction (gains) losses, net(0.6) (0.8) 3.1 (0.6) Loss on extinguishment of debt- 0.9 0.2 1.0 Shareholder litigation settlement recoveries- - (6.0) (4.5) Other adjustments(0.1) 0.7 0.8 0.4 Adjusted EBITDA142.2$ 182.2$ 429.9$ 492.1$ Minus:Interest expense23.224.468.076.5Income tax provision, as adjusted17.537.957.987.7Depreciation expense12.713.440.341.2Amortization of non-acquisition related intangible assets2.53.88.110.6Adjusted Net Income86.3$ 102.7$ 255.6$ 276.1$ Free Cash FlowCash flows - operating activities114.2$ 103.8$ 244.3$ 298.3$ Minus:Capital expenditures9.111.333.832.1Free Cash Flow105.1$ 92.5$ 210.5$ 266.2$ GARDNER DENVER HOLDINGS, INC. AND SUBSIDIARIESFor the Nine MonthPeriod EndedSeptember 30,(Unaudited)(Dollars in millions)Period EndedSeptember 30,For the Three Month RECONCILIATION OF NET INCOME TO ADJUSTED EBITDA AND ADJUSTED NET INCOME AND CASH FLOWS - OPERATING ACTIVITIES TO FREE CASH FLOW 18

Reconciliation of Segment Adjusted EBITDA to Income Before Income Taxes 2019201820192018RevenueIndustrials315.9$ 320.0$ 968.2$ 965.7$ Energy208.5298.8664.4814.1Medical72.370.5213.5197.3Total Revenue596.7$ 689.3$ 1,846.1$ 1,977.1$ Segment Adjusted EBITDAIndustrials70.1$ 72.1$ 217.7$ 210.0$ Energy55.494.9171.7242.5Medical22.420.563.854.4Total Segment Adjusted EBITDA147.9$ 187.5$ 453.2$ 506.9$ Less items to reconcile Segment Adjusted EBITDA toIncome Before Income Taxes:Corporate expenses not allocated to segments5.7$ 5.3$ 23.3$ 14.8$ Interest expense23.224.468.076.5Depreciation and amortization expense43.144.4132.9134.6Restructuring and related business transformation costs9.912.316.125.2Acquisition related expenses and non-cash charges15.92.834.713.1Expenses related to public stock offerings- 0.3- 2.2Establish public company financial reporting compliance- 1.3 0.6 3.2 Stock-based compensation0.5 1.1 16.9 2.9 Foreign currency transaction (gains) losses, net(0.6) (0.8) 3.1 (0.6) Loss on extinguishment of debt- 0.9 0.2 1.0 Shareholder litigation settlement recoveries- - (6.0) (4.5) Other adjustments(0.1) 0.7 0.8 0.4 Income Before Income Taxes50.3$ 94.8$ 162.6$ 238.1$ For the Nine MonthPeriod EndedSeptember 30,GARDNER DENVER HOLDINGS, INC. AND SUBSIDIARIESRECONCILIATION OF SEGMENT ADJUSTED EBITDA TO INCOME BEFORE INCOME TAXES(Dollars in millions)(Unaudited)Period EndedSeptember 30,For the Three Month 19
Important Additional Info and No Offer or Solicitation IMPORTANT ADDITIONAL INFORMATION AND WHERE TO FIND IT In connection with the pending merger transaction between Gardner Denver and Ingersoll Rand Industrial, Gardner Denver and Ingersoll Rand Industrial will file registration statements with the SEC registering shares of Gardner Denver common stock and Ingersoll Rand Industrial common stock in connection with the proposed transaction. Gardner Denver will also file a proxystatement, which will be sent to the Gardner Denver shareholders in connection with their vote required in connection with the proposed transaction. If the transaction is effected in whole or in part via an exchange offer, Ingersoll-Rand will also file with the SEC a Schedule TO with respect thereto. Ingersoll-Rand shareholders are urged to read the prospectus and/or information statement that will be included in the registration statements and any other relevant documents when they become available, and Gardner Denver stockholders are urged to read the proxy statement and any other relevant documents when they become available, because they will contain important information about Gardner Denver, Ingersoll Rand Industrial and the proposed transaction. The proxy statement, prospectus and/or information statement, and other documents relating to the proposed transactions (when they become available) can be obtained free of charge from the SEC’s website at www.sec.gov. The proxy statement, prospectus and/or information statement and other documents (when they are available) will also be available free of charge on Ingersoll-Rand’s website at http://ir.ingersollrand.com or on Gardner Denver’s website at https://investors.gardnerdenver.com. Information regarding the persons who may, under the rules of the SEC, be considered participants in the solicitation of the stockholders of Gardner Denver in connection with the proposed transactionwill be set forth in the proxy statement/prospectus when it is filed with the SEC. NO OFFER OR SOLICITATION This communication shall not constitute an offer to sell or the solicitationof an offer to sell or the solicitation of an offerto buy any securities, nor shall there be any sale of securities in any jurisdiction in which such offer, solicitation or sale would be unlawful prior to registration or qualification under the securities laws of any such jurisdiction. No offer of securities shallbe made except by means of a prospectus meeting the requirements of Section 10 of the Securities Act of 1933, as amended. This communication is not a solicitation of a proxy from any security holder of Gardner Denver. However, Ingersoll-Rand, Gardner Denver and certain of their respective directors and executive officers may be deemed to be participants in the solicitation of proxies from shareholders of Gardner Denver in connection with the proposed transaction under the rules of the SEC. Information about the directors and executive officers of Ingersoll-Rand may be found in its Annual Report on Form 10-K filed with the SEC on February 12, 2019 and its definitive proxy statement relating to its 2019 Annual Meeting of Shareholders filed with the SEC on April 23, 2019. Information about the directors and executive officers of Gardner Denver may be found in its Annual Report on Form 10-K filed with the SEC on February 27, 2019, and its definitive proxy statement relating to its 2019 Annual Meeting of Stockholders filed with the SEC on March 26, 2019. 20