independent study final report v4cis.csuohio.edu/~sschung/cis430... · ·...
TRANSCRIPT

Nicholas J White April 24th, 2016 | nickwhite.us
INDEPENDENT STUDY Just how much can be learned in a semester under Dr. Chung’s guidance
CONTENTS Introduction 6
Why I requested an independent study (Beginning of Semester) 6
Why I am glad I requested an independent study (End of Semester) 8
Mission Statement and Goals 9
Course Mission Statement 9
Course Goals and Expected Outcomes 9
Introduction 10
Coursera Online Courses 11
Introduction to Coursera 11
My Coursework for This Semester 12
Introduction to Specializations 12
Specializations 12
Data Warehousing and Business Intelligence Specialization 13
Machine Learning Specialization 14
Data Mining Specialization 16
Data Science Specialization 18
Algorithms Specialization 20
CIS 611 Selected Course Materials 23
Introduction to CIS 611 Course Materials 23
eDx Online Courses 24
Introduction to eDx 24
Additional Coursework 25
Introduction to Additional Coursework 25
Coursera Online Courses 26
Data Warehousing and Business Intelligence Specialization 26
Course 1: Database Management Essentials 27
Course 2: Data Warehouse Concepts, Design, and Data Integration 39
Course 3: Relational Database Support for Data Warehouses 46
Course 4: Business Intelligence Concepts, Tools, and Applications 52
Project: Design and Build a Data Warehouse for Business Intelligence Implementation 58
Machine Learning Specialization 65
Course 1: Machine Learning Foundations: A Case Study Approach 65
Course 2: Machine Learning: Regression 73
Course 3: Machine Learning: Classification 83
Course 4: Machine Learning: Clustering & Retrieval 93
Course 5: Machine Learning: Recommender Systems & Dimensionality Reduction 94
Data Mining Specialization 94
Course 1: Data Visualization 94
Course 2: Text Retrieval and Search Engines 98
Course 3: Text Mining and Analytics 98
Course 4: Pattern Discovery in Data Mining 99
Course 5: Cluster Analysis in Data Mining 99
Data Science Specialization 100
Course 1: The Data Scientist’s Toolbox 100
Course 2: R Programming 102

Course 3: Getting and Cleaning Data 107
Course 4: Exploratory Data Analysis 109
Course 5: Reproducible Research 111
Course 6: Statistical Inference 114
Course 7: Regression Models 118
Course 8: Practical Machine Learning 122
Algorithms Specialization 125
Course 1: Algorithmic Toolbox 125
Course 2: Data Structures 130
Course 3: Algorithms on Graphs 135
Course 4: Algorithms on Strings 136
Couse 5: Advanced Algorithms and Complexity 136
CIS 611 Selected Course Materials 137
Database Normalization 137
Indexes 137
Functional Dependency 137
Storage and File System 137
eDx Online Courses 138
Course 1: Introduction to Data Storage and Management Technologies 138
Course 2: Introduction to Cloud Computing 140
Additional Coursework 144
SAC Application 144
Senior Design 144

Work Experience and Conclusion 145

COURSE OVERVIEW AND OBJECTIVES INTRODUCTION
WHY I REQUESTED AN INDEPENDENT STUDY (BEGINNING OF SEMESTER) I’ll start by saying that this year is my senior year at Cleveland State University, thus, I do not have
any motive or goal for writing this reflection of my independent study other than to give the
college of engineering a glimpse into the experience of a student, firsthand. Hopefully after
reading this, the reader will fully realize just how much of an impact a single professor can have
on a student’s life, career, and love of engineering. I’d also like to say that I plan on graduating
this semester, and so am not making an attempt to obtain a higher grade for this reflection. This is
purely for the edification of the reader, and so the administration and Dr. Chung know just how
much I sincerely appreciate all her hard work and effort this past year.
Last semester (Fall 2015) I took Database Systems (CIS 430) with Dr. Sun Chung. To many
undergraduate students, the topic of database systems is one which they do not immediately
associate with glamor, fame, or what is referred to as the “sexy” part of computer science. To be
entirely honest, I was one of these students. I was, at the time, working as a web application
developer for Parker Hannifin, specifically in front-end technologies. My interest in database
systems was, well, non-existent.
This course started me down a path that I am certain is going to be my specialization and career.
Enterprise database systems, data mining, big data, and all the other specialization under the
umbrella of database systems are what I find to be most interesting, challenging, and downright
cool, and this is all due to the foundation I received in Dr. Chung’s course. Dr. Chung brings to the
table a multitude of attributes which make her not only a remarkable professor, but an incredible
role model also. Her enthusiasm towards the topics she is professing, as well as towards her students
is unwavering.

While enrolled in CIS 430 I earned a position on Parker Hannifin’s Data and Business Intelligence
team working on building out their data warehouse. The only reason I was able to transition to this
team was the skills I learned from Dr. Chung in CIS 430, as well as the countless discussions we
would have after class regarding how I should best prepare myself for the transition (it is important
to note that Dr. Chung would often times stay 30, sometimes 40 minutes after class just to explain
a topic which we were not even covering in the course). To me, this is truly what it means to be
an engineering student. Until this time, I was unable to reach out to professors in this way, and so
my learning and appetite for knowledge was curbed.
With all this in mind, when I discovered that I could do an independent study, I may have actually
jumped for joy. Upon discussion with Dr. Chung, the topics to be discovered weren’t ones that
were arbitrarily picked, Dr. Chung (knowing her students and their aspirations) decided to put
together a curriculum for me that would change my career forever, and for the better.

WHY I AM GLAD I REQUESTED AN INDEPENDENT STUDY (END OF SEMESTER)
Having completed the semester of independent study, I now have a lot more to talk about with
regards to why I am glad I did indeed take this course. At the beginning of the semester, Dr. Chung
and I had discussions about where I was going in my career, and what I wanted to do (something
I have never talked to a professor about). With this in mind, she designed a custom curriculum for
me.
There are many reasons why one might perform better in an independent study setting than in a
classroom setting. Some individuals are better suited for independent learning. Some students
prefer to learn at times of the day where courses are not offered (at night, for example). Although
these statements are true, the reason I performed better in an independent study setting than in
any classroom I have been in at this university was the structure, guidance, and leadership put
forth by Dr. Chung. As you will see, we covered a humongous amount of area this semester, and
yes I used the word ‘humongous’ because we did cover MongoDB as well!
In closing, I hope you enjoy my coverage of what I have learned this semester. If you enjoy reading
it even 1% as much as I enjoyed actually doing it, we’ll both be very happy!

MISSION STATEMENT AND GOALS
COURSE MISSION STATEMENT The main driving forces behind the curriculum put forth by Dr. Chung were my new position on the
data warehousing team at Parker Hannifin, and the interest and passion Dr. Chung and I share for
the topic of database systems.
The mission statement for this course was to accomplish the following goals:
• Further my education in the field of data warehousing with a focus on practical work, as
well as the theory and principles behind it
• Expand my knowledge of the field to include the topics of
o Big data and cloud computing
o Machine learning and its role in the ecosystem
o Relational concepts as they pertain to data warehouses
• Determine which part of the field I am most interested in, and would like to pursue for my
master’s degree
COURSE GOALS AND EXPECTED OUTCOMES For this course, Dr. Chung combined several different learning techniques and mediums to form
the curriculum. The goals of this curriculum were to cover a wide range of topics, but to do so in
enough detail so that I can actually implement them.
The expected outcomes were twofold:
1. Know the theory behind each topic, and truly understand why we need the technology,
how we got to this point, where it is headed, and how it works on a highly technical level
2. Be able to implement each topic in a realistic setting. Knowing how something works is the
first step, the next step for each topic was to implement it

COURSEWORK OVERVIEW INTRODUCTION The actual coursework was chosen to cover all the objectives listed above, as well as to be
interesting and practical in nature. The major breakdown of the coursework is as follows.
Four different, and entirely separate sources of education were used for this independent study.
Details of each type will be covered in their respective ‘introduction’ sections, but as a high-level
overview, they fall into two categories.
The first category is online, or e-learning. I took several courses from top universities, all online. This
coursework was guided and supplemented by Dr. Chung’s knowledge when we met throughout
the semester. The point of the online coursework was to allow me to keep learning every day,
when we met only a few times a week. I was able to learn at, say, 9PM to 1AM every day, which
allowed me to cover a lot of ground between our meetings. This was immensely helpful.
The second category is learning with Dr. Chung, facilitated in person. The topics covered were
more in-depth than the online courses, and will be covered in detail in the following sections.

COURSERA ONLINE COURSES
INTRODUCTION TO COURSERA
Coursera is an online learning platform designed to teach technical topics. The site is laid out in
the following manner. The site allows the student to pick from a list of specializations. These
specializations are, for example, Big Data, Data Science, Full Stack Web Development, etc. They
are large topics, or domains of knowledge which contain courses. Each course contains its
contents, which are broken down into weeks. Each week builds on the previous week, and usually

covers an entire section of a technology or topic. For example, a week was spent installing and
configuring Pentaho Data Warehouse and Integration tools, in addition to learning about them.
MY COURSEWORK FOR THIS SEMESTER
INTRODUCTION TO SPECIALIZATIONS
Coursera specializations are aimed at taking the student from introductory knowledge in a
particular domain, to being able to implement advanced solutions in said domain.
SPECIALIZATIONS
Over the course of this semester, I have completed five specializations. These specializations
pertain to my field, and the direction in which I want my career to go.
They are described as follows.
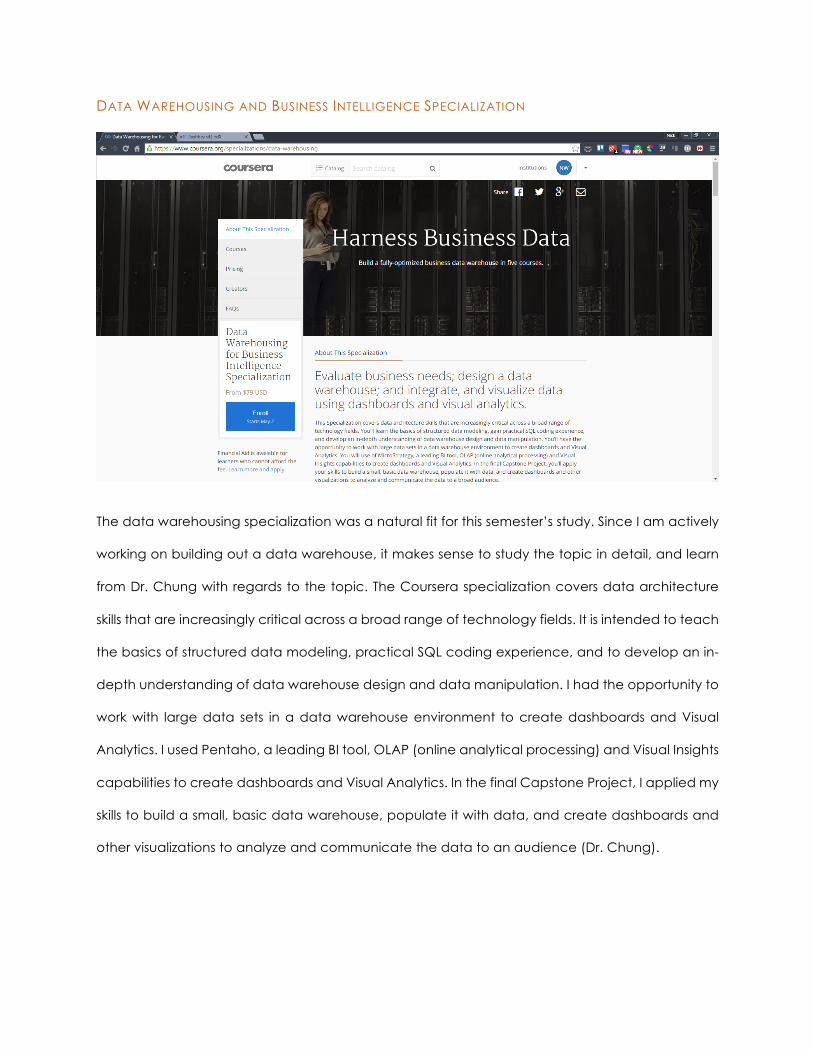
DATA WAREHOUSING AND BUSINESS INTELLIGENCE SPECIALIZATION
The data warehousing specialization was a natural fit for this semester’s study. Since I am actively
working on building out a data warehouse, it makes sense to study the topic in detail, and learn
from Dr. Chung with regards to the topic. The Coursera specialization covers data architecture
skills that are increasingly critical across a broad range of technology fields. It is intended to teach
the basics of structured data modeling, practical SQL coding experience, and to develop an in-
depth understanding of data warehouse design and data manipulation. I had the opportunity to
work with large data sets in a data warehouse environment to create dashboards and Visual
Analytics. I used Pentaho, a leading BI tool, OLAP (online analytical processing) and Visual Insights
capabilities to create dashboards and Visual Analytics. In the final Capstone Project, I applied my
skills to build a small, basic data warehouse, populate it with data, and create dashboards and
other visualizations to analyze and communicate the data to an audience (Dr. Chung).
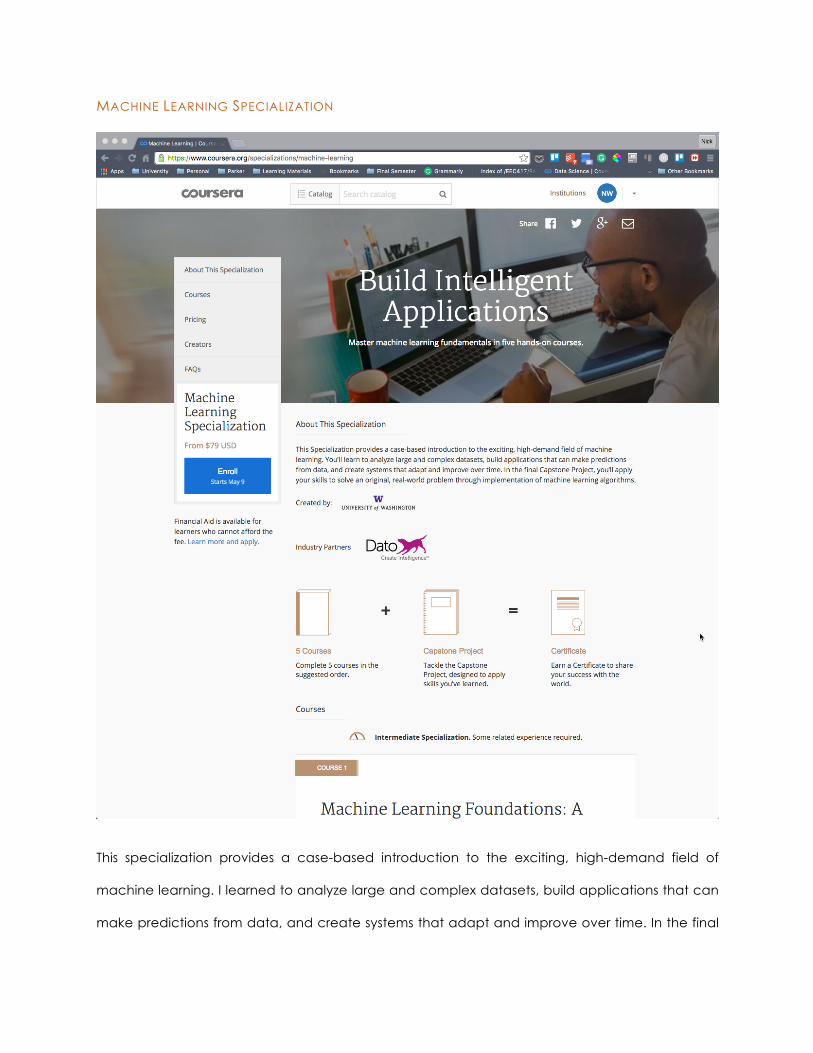
MACHINE LEARNING SPECIALIZATION
This specialization provides a case-based introduction to the exciting, high-demand field of
machine learning. I learned to analyze large and complex datasets, build applications that can
make predictions from data, and create systems that adapt and improve over time. In the final

Capstone Project, I applied my skills to solve an original, real-world problem through
implementation of machine learning algorithms.
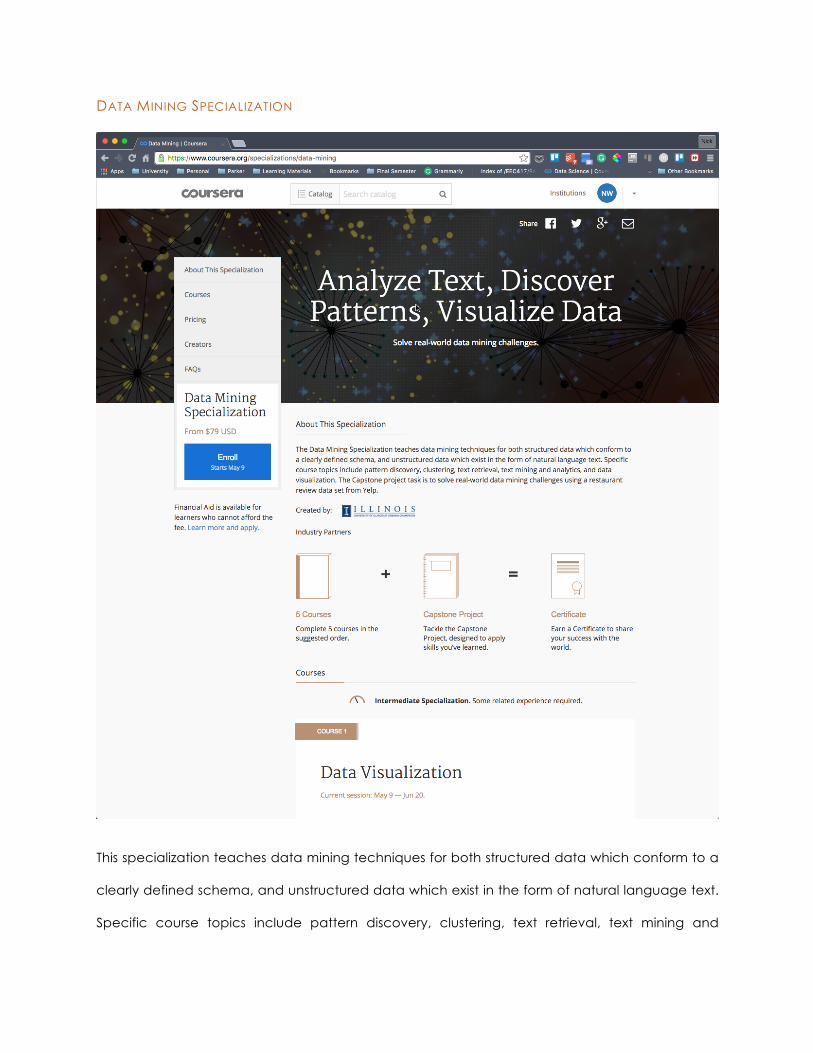
DATA MINING SPECIALIZATION
This specialization teaches data mining techniques for both structured data which conform to a
clearly defined schema, and unstructured data which exist in the form of natural language text.
Specific course topics include pattern discovery, clustering, text retrieval, text mining and

analytics, and data visualization. The Capstone project task is to solve real-world data mining
challenges using a restaurant review data set from Yelp.

DATA SCIENCE SPECIALIZATION
This Specialization covers the concepts and tools I need throughout the entire data science
pipeline, from asking the right kinds of questions to making inferences and publishing results. In the

final Capstone Project, I applied the skills learned by building a data product using real-world
data.
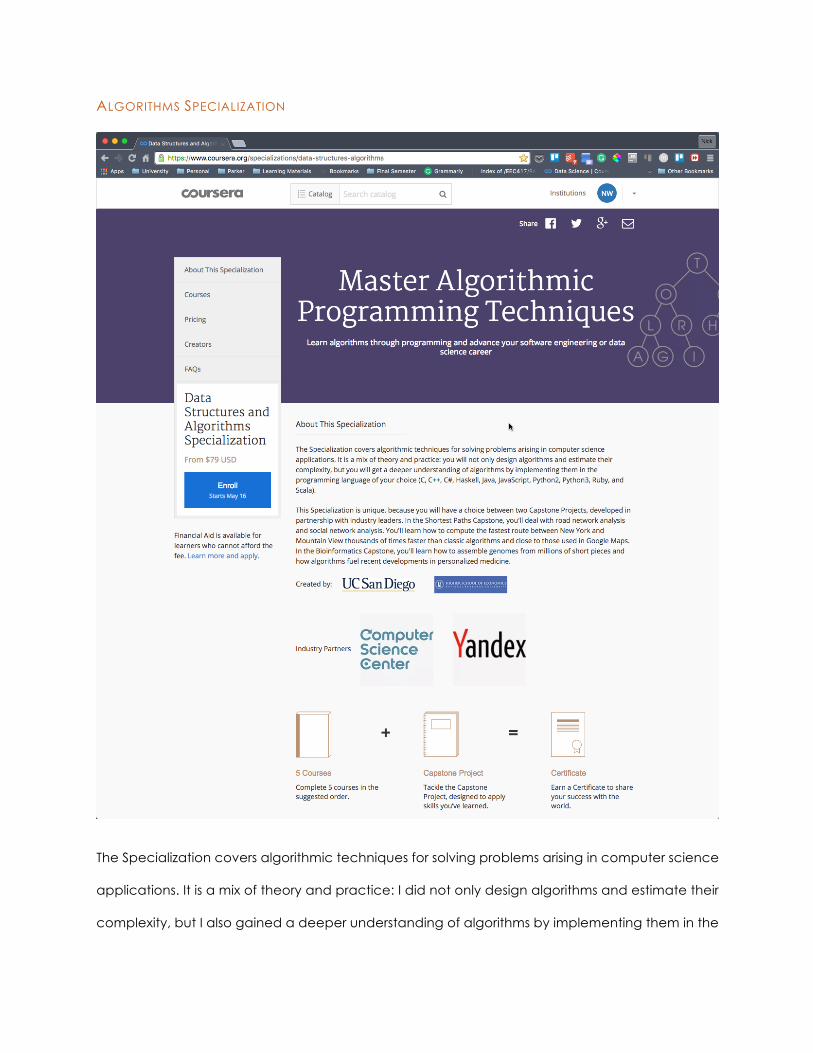
ALGORITHMS SPECIALIZATION
The Specialization covers algorithmic techniques for solving problems arising in computer science
applications. It is a mix of theory and practice: I did not only design algorithms and estimate their
complexity, but I also gained a deeper understanding of algorithms by implementing them in the

programming language of my choice (C, C++, C#, Haskell, Java, JavaScript, Python3, Ruby, and
Scala).
This Specialization is unique, because I had a choice between two Capstone Projects, developed
in partnership with industry leaders. In the Shortest Paths Capstone, I dealt with road network
analysis and social network analysis. I learned how to compute the fastest route between New
York and Mountain View thousands of times faster than classic algorithms and close to those used
in Google Maps. I did not complete the Bioinformatics Capstone.


CIS 611 SELECTED COURSE MATERIALS INTRODUCTION TO CIS 611 COURSE MATERIALS
CIS 611 is a graduate course highly focused on MPP and data warehousing. Because of my interest
in these topics, and the fact that I am starting my career in database systems, Dr. Chung chose
to take topics from CIS 611 and teach them to me. The topics were more advanced than most of
the coursework online, and this was possible I was being taught in person, and not though a web
browser. The ability to ask questions in real-time was invaluable as the topics became more and
more complex.
The topics covered included:
• Database normalization
• Indexes
• Functional Dependency
• Storage, File System, and physical layer of databases

EDX ONLINE COURSES INTRODUCTION TO EDX
eDx is an online learning site dedicated to providing technical learning to students, irrespective of
their background. Some of the best schools from around the country provide education through
the site, and their courses are technical. Dr. Chung and I chose two courses for me to take from
this site to supplement my learning. Details of these courses can be found in their section.

ADDITIONAL COURSEWORK INTRODUCTION TO ADDITIONAL COURSEWORK
In addition to the materials I covered this semester, I also did two major projects which I would like
to share. These projects utilized the skills I learned from Dr. Chung, and will be described in detail
in the later sections. One of these projects was my senior design project, which placed first in the
college of engineering. The second project is a full stack web application I built for the student
chapter of the IEEE at CSU. This app utilized HTML5, CSS3, JavaScript, Angular, ASP.NET MVC 4, SQL
Server, and MongoDB.

COURSEWORK COMPLETED THIS SEMESTER COURSERA ONLINE COURSES
DATA WAREHOUSING AND BUSINESS INTELLIGENCE SPECIALIZATION

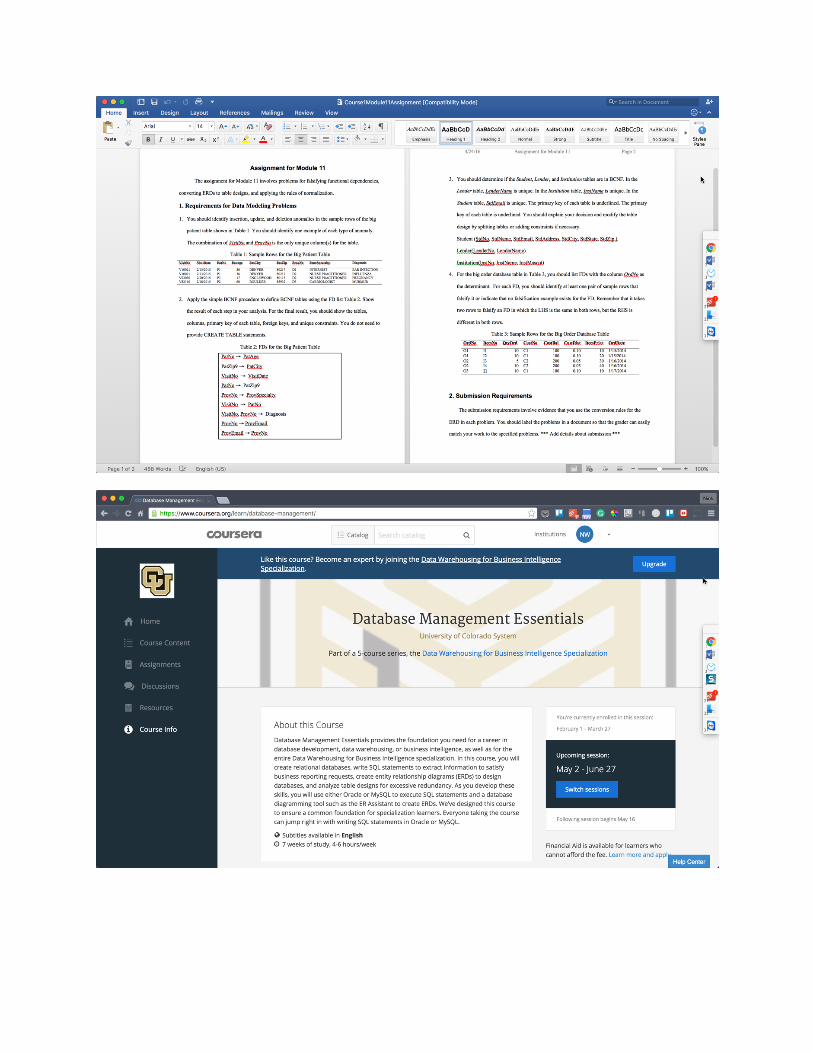
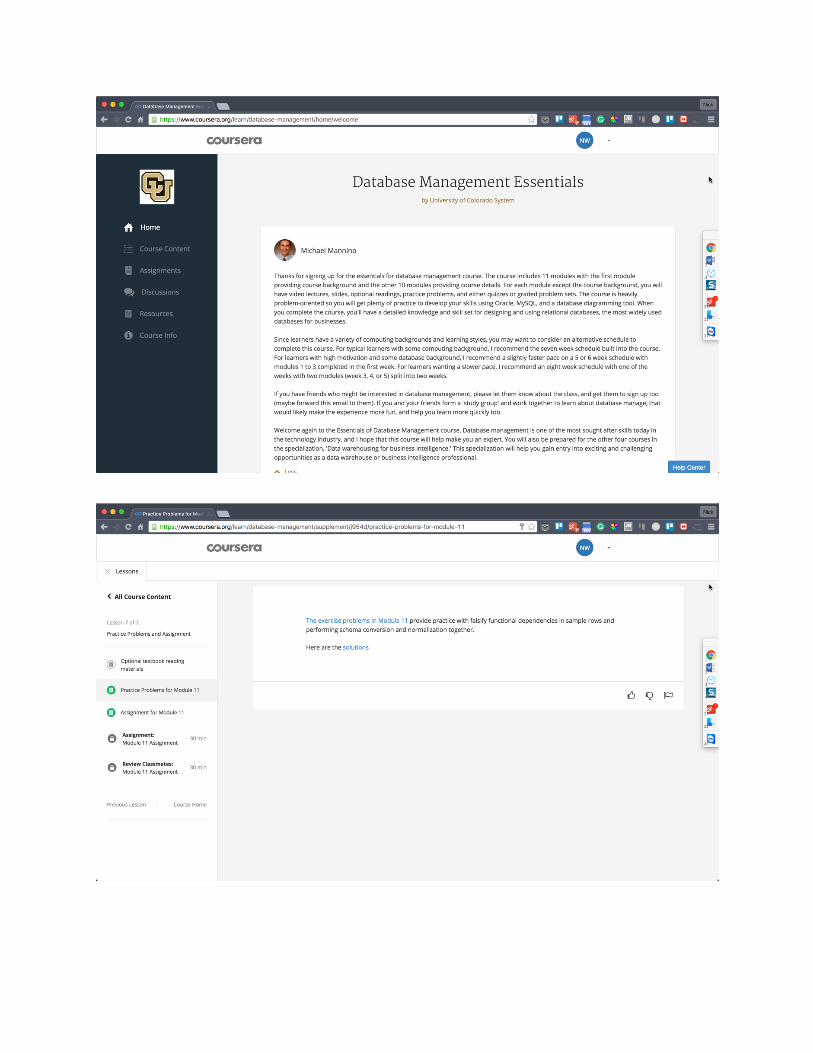
COURSE 1: DATABASE MANAGEMENT ESSENTIALS
I completed all the assignments for this course, installed all relevant software and became
proficient in its use. This course taught me how to work with Oracle, MySQL, and Microsoft SQL
Server databases on a local machine. I installed, configured, and managed these databases
throughout all the labs.
Course Syllabus and what I covered:
WEEK 1
Course Introduction Description: Module 1 provided the context for Database Management Essentials. When you’re done, you’ll understand the objectives for the course and know what topics and assignments to expect. Keeping these course objectives in mind will help you succeed throughout the course! You should read about the database software requirements in the last lesson of module 1. I recommend that you try to install the DBMS software this week before assignments begin in week 2.
Video · Specialization Introduction video lesson
Video · Course introduction video lecture
Video · Course objectives video lecture
Reading · Powerpoint lecture notes for lesson 1
Video · Topics and assignments video lecture
Reading · Powerpoint lecture notes for lesson 2
Reading · Optional textbook
Reading · Overview of database management software requirements
Reading · Oracle installation notes
Reading · Making a connection to a database on a local Oracle server
Introduction to Databases and DBMS Description: We’ll launch into an exploration of databases and database technology and their impact on organizations in Module 2. We’ll investigate database characteristics, database technology features, including non-procedural access, two key processing environments, and an evolution of the database software industry. This short informational module will ensure that we all have the same background and context, which is critical for success in the later modules that emphasize details and hands-on skills.
Video · Database characteristics video lecture
Reading · Powerpoint lecture notes for lesson 1 and extras
Video · Organizational Roles video lecture
Reading · Powerpoint lecture notes for lesson 2
Video · DBMS overview and database definition feature video lecture
Reading · Powerpoint lecture notes for lesson 3
Video · Non-procedural access video lecture
Reading · Powerpoint lecture notes for lesson 4
Video · Transaction processing overview video lecture
Reading · Powerpoint lecture notes for lesson 5
Video · Data warehouse processing overview video lecture
Reading · Powerpoint lecture notes for lesson 6
Video · DBMS technology evolution video lecture
Reading · Powerpoint lecture notes for lesson 7
Quiz · Module02 Quiz
Reading · Optional reading
WEEK 2
Relational Data Model and the CREATE TABLE Statement Description: Now that you have the informational context for database features and environments, you’ll start building! In this module, you’ll learn relational data model terminology, integrity rules, and the CREATE TABLE statement. You’ll apply what you’ve learned in practice and graded problems using a database management system (DBMS), either Oracle or MySQL, creating tables using the SQL CREATE TABLE statement and populating your tables using given SQL INSERT statements.
Video · Basics of relational databases video lecture
Reading · Powerpoint lecture notes for lesson 1 and extras
Video · Integrity rules video lecture
Reading · Powerpoint lecture notes for lesson 2
Video · Basic SQL CREATE TABLE statement video lecture
Reading · Powerpoint lecture notes for lesson 3 and extras

Video · Integrity constraint syntax video lecture
Reading · Powerpoint lecture notes for lesson 4
Video · Assignment 1 Notes video lecture
Reading · Powerpoint lecture notes for lesson 5
Reading · Optional reading
Reading · DBMS installation and configuration notes
Reading · Practice Problems for Module 3
Practice Quiz · Quiz for Module 3 practice problems
Reading · Extra Problems for Module 3
Reading · Assignment for Module 3
Peer Review · Module 3 Assignment
WEEK 3
Basic Query Formulation with SQL Description: This module is all about acquiring query formulation skills. Now that you know the relational data model and have basic skills with the CREATE TABLE statement, we can cover basic syntax of the SQL SELECT statement and the join operator for combining tables. SELECT statement examples are presented for single table conditions, join operations, and grouping operations. You’ll practice writing simple SELECT statements using the tables that you created in the assignment for module 3.
Video · SQL Overview video lecture
Reading · Powerpoint lecture notes for lesson 1 and extras
Video · SELECT statement introduction video lecture
Reading · Powerpoint lecture notes for lesson 2
Video · Join Operator video lecture
Reading · Powerpoint lecture notes for lesson 3
Video · Using Join operations in SQL SELECT statements video lecture
Reading · Powerpoint lecture notes for lesson 4
Video · GROUP BY clause video lecture
Reading · Powerpoint lecture notes for lesson 5
Reading · Practice Problems for Module 4
Practice Quiz · Quiz for Module 4 Practice Problems
Reading · Extra Problems for Module 4
Reading · Assignment for Module 4
Peer Review · Module 4 Assignment
Reading · Optional reading
Reading · DBMS installation and configuration notes
Extended Query Formulation with SQL Description: Now that you can identify and use the SELECT statement and the join operator, you’ll extend your problem solving skills in this module so you can gain confidence on more complex queries. You will work on retrieval problems with multiple tables and grouping. In addition, you’ll learn to use the UNION operator in the SQL SELECT statement and write SQL modification statements.
Video · Query formulation guidelines video lecture
Reading · Powerpoint lecture notes for lesson 1 and extras
Video · Multiple table problems video lecture
Reading · Powerpoint lecture notes for lesson 2
Video · Problems involving join and grouping operations video lecture
Reading · Powerpoint lecture notes for lesson 3
Video · SQL set operators video lecture
Reading · Powerpoint lecture notes for lesson 4
Video · SQL modification statements video lecture
Reading · Powerpoint lecture notes for lesson 5

Reading · Optional textbook reading material
Reading · DBMS installation and configuration notes
Reading · Practice Problems for Module 5
Practice Quiz · Quiz for Module 5 Practice Problems
Reading · Extra Problems for Module 5
Reading · Assignment for Module 5
Peer Review · Module 5 Assignment
WEEK 4
Notation for Entity Relationship Diagrams Description: Module 6 represents another shift in your learning. In previous modules, you’ve created and populated tables and developed query formulation skills using the SQL SELECT statement. Now you’ll start to develop skills that allow you to create a database design to support business requirements. You’ll learn basic notation used in entity relationship diagrams (ERDs), a graphical notation for data modeling. You will create simple ERDs using basic diagram symbols and relationship variations to start developing your data modeling skills.
Video · Database development goals video lecture
Reading · Powerpoint lecture notes for lesson 1 and extras
Video · Basic ERD notation video lecture
Reading · Powerpoint lecture notes for lesson 2
Video · Relationship variations I video lecture
Reading · Powerpoint lecture notes for lesson 3
Video · Relationship variations II video lecture
Reading · Powerpoint lecture notes for lesson 4
Reading · Optional textbook reading material
Reading · Practice Problems for Module 6
Reading · Assignment for Module 6

Peer Review · Module 6 Assignment
ERD Rules and Problem Solving Description: Module 7 builds on your knowledge of database development using basic ERD symbols and relationship variations. We’ll be practicing precise usage of ERD notation and basic problem solving skills. You will learn about diagram rules and work problems to help you gain confidence using and creating ERDs.
Video · Basic diagram rules video lecture
Reading · Powerpoint lecture notes for lesson 1 and extras
Video · Extended diagram rules video lecture
Reading · Powerpoint lecture notes for lesson 2
Video · ERD problems I video lecture
Reading · Powerpoint lecture notes for lesson 3
Video · ERD problems II video lecture
Reading · Powerpoint lecture notes for lesson 4
Video · ER Assistant Demonstration video
Reading · ER Assistant download
Reading · Optional textbook reading material
Reading · Practice Problems for Module 7
Reading · Assignment for Module 7
Peer Review · Module 7 Assignment
WEEK 5
Developing Business Data Models Description: In Module 8, you’ll use your ERD notation skills and your ability to avoid diagram errors to develop ERDs that satisfy specific business data requirements. You will learn and practice powerful problem-solving skills as you analyze narrative statements and transformations to generate alternative ERDs.

Video · Conceptual data modeling goals and challenges
Reading · Powerpoint lecture notes for lesson 1 and extras
Video · Analyzing narrative problems
Reading · Powerpoint lecture notes for lesson 2
Video · Design transformations I
Reading · Powerpoint lecture notes for lesson 3
Video · Design transformations II video lecture
Reading · Powerpoint lecture notes for lesson 4
Reading · Optional textbook reading material
Reading · Practice Problems for Module 8
Reading · Assignment for Module 8
Peer Review · Module 8 Assignment
Data Modeling Problems and Completion of an ERD Description: Now that you have practiced data modeling techniques, you’ll get to wrestle with narrative problem analyses and transformations for generating alternative database designs in Module 9. At the end of this module, you’ll learn guidelines for documentation and detection of design errors that will serve you well as you design databases for business situations.
Video · Data modeling problems I video lecture
Reading · Powerpoint lecture notes for lesson 1 and extras
Video · Data modeling problems II video lecture
Reading · Powerpoint lecture notes for lesson 2
Video · Finalizing an ERD video lecture
Reading · Powerpoint lecture notes for lesson 3
Reading · Optional textbook reading material
Reading · Practice Problems for Module 9
Reading · Assignment for Module 9
Peer Review · Module 9 Assignment
WEEK 6
Schema Conversion Description: Modules 6 to 9 covered conceptual data modeling, emphasizing precise usage of ERD notation, analysis of narrative problems, and generation of alternative designs. Modules 10 and 11 cover logical database design, the next step in the database development process. In Module 10, we’ll cover schema conversion, the first step in the logical database design phase. You will learn to convert an ERD into a table design that can be implemented on a relational DBMS.
Video · Goals and steps of logical database design video lecture
Reading · Powerpoint lecture notes for lesson 1 and extras
Video · Conversion rules video lecture
Reading · Powerpoint lecture notes for lesson 2
Video · Conversion problems video lecture
Reading · Powerpoint lecture notes for lesson 3
Reading · Optional textbook reading material
Reading · Practice Problems for Module 10
Reading · Assignment for Module 10
Peer Review · Module 10 Assignment
WEEK 7
Normalization Concepts and Practice
Module 11 covers normalization, the second part of the logical database design process. Normalization provides tools to remove unwanted redundancy in a table design. You’ll discover the motivation for normalization, constraints to reason about unwanted redundancy, and rules that detect excessive redundancy in a table design. You’ll practice integrating and applying normalization techniques in the final lesson of this course.
Video · Modification anomalies video lecture
Reading · Powerpoint lecture notes for lesson 1 and extras
Video · Functional dependencies video lecture
Reading · Powerpoint lecture notes for lesson 2
Video · Normal forms video lecture
Reading · Powerpoint lecture notes for lesson 3
Video · Practical concerns video lecture
Reading · Powerpoint lecture notes for lesson 4
Video · Normalization problems video lecture
Reading · Powerpoint lecture notes for lesson 5
Video · Course Conclusion
Reading · Optional textbook reading materials
Reading · Practice Problems for Module 11
Reading · Assignment for Module 11
Peer Review · Module 11 Assignment

COURSE 2: DATA WAREHOUSE CONCEPTS, DESIGN, AND DATA INTEGRATION
Description:
This is the second course in the Data Warehousing for Business Intelligence specialization. Ideally, the courses should be taken in sequence. In this course, you will learn exciting concepts and skills for designing data warehouses and creating data integration workflows. These are fundamental skills for data warehouse developers and administrators. You will have hands-on experience for data warehouse design and use open source products for manipulating pivot tables and creating data integration workflows. You will also gain conceptual background about maturity models, architectures, multidimensional models, and management practices, providing an organizational perspective about data warehouse development. If you are currently a business or information technology professional and want to become a data warehouse designer or administrator, this course will give you the knowledge and skills to do that. By the end of the course, you will have the design experience, software background, and organizational context that prepares you to succeed with data warehouse development projects. In this course, you will create data warehouse designs and data integration workflows that satisfy the business intelligence needs of organizations. When you’re done with this course, you’ll be able to: * Evaluate an organization for data warehouse maturity and business architecture alignment; * Create a data warehouse design and reflect on alternative design methodologies and design goals; * Create data integration workflows using prominent open source software; * Reflect on the role of change data, refresh constraints, refresh frequency trade-offs, and data quality goals in data integration process design; and * Perform

operations on pivot tables to satisfy typical business analysis requests using prominent open source software
WEEK 1
Data Warehouse Concepts and Architectures Description: Module 1 introduces the course and covers concepts that provide a context for the remainder of this course. In the first two lessons, you’ll understand the objectives for the course and know what topics and assignments to expect. In the remaining lessons, you will learn about historical reasons for development of data warehouse technology, learning effects, business architectures, maturity models, project management issues, market trends, and employment opportunities. This informational module will ensure that you have the background for success in later modules that emphasize details and hands-on skills.You should also read about the software requirements in the lesson at the end of module 1. I recommend that you try to install the software this week before assignments begin in week 2.
Video · Course introduction video lecture
Video · Course objectives video lecture
Reading · Powerpoint lecture notes for lesson 1
Video · Course topics and assignments video lecture
Reading · Optional textbook
Reading · Powerpoint lecture notes for lesson 2
Video · Motivation and characteristics video lecture
Reading · Powerpoint lecture notes for lesson 3
Video · Learning effects for data warehouse development video lecture
Reading · Powerpoint lecture notes for lesson 4
Video · Data warehouse architectures and maturity video lecture
Reading · Powerpoint lecture notes for lesson 5
Video · Applications and market trends video lecture
Reading · Powerpoint lecture notes for lesson 6
Video · Employment opportunities video lecture
Reading · Powerpoint lecture notes for lesson 7
Reading · Overview of software requirements
Reading · Pivot4J installation
Reading · Pentaho Data Integration installation
Reading · Overview of database software installation
Reading · Oracle installation notes
Reading · Making connections to a local Oracle database
Quiz · Module 1 quiz
Reading · Optional textbook reading material
WEEK 2
Multidimensional Data Representation and Manipulation Description: Now that you have the informational context for data warehouse development, you’ll start using data warehouse tools! In module 2, you will learn about the multidimensional representation of a data warehouse used by business analysts. You’ll apply what you’ve learned in practice and graded problems using Pivot4J, an open source tool for manipulating pivot tables. At the end of this module, you will have solid background to communicate and assist business analysts who use a multidimensional representation of a data warehouse.
Video · Data cube representation video lecture
Reading · Powerpoint lecture notes for lesson 1
Video · Data cube operators video lecture
Reading · Powerpoint lecture notes for lesson 2
Video · Overview of Microsoft MDX video lecture
Reading · Powerpoint lecture notes for lesson 3
Video · Microsoft MDX statements video lecture
Reading · Powerpoint lecture notes for lesson 4
Video · Overview of Pivot4J video lecture

Reading · Powerpoint lecture notes for lesson 5
Video · Overview of WebPivotTable video lecture
Reading · Powerpoint lecture notes for lesson 6
Video · Pivot4J software demonstration video lecture
Quiz · Module 2 quiz
Reading · Optional textbook reading material
Reading · Pentaho Pivot4J tutorial
Peer Review · Assignment for module 2
Quiz · Quiz for module 2 assignment
WEEK 3
Data Warehouse Design Practices and Methodologies Description: This module emphasizes data warehouse design skills. Now that you understand the multidimensional representation used by business analysts, you are ready to learn about data warehouse design using a relational database. In practice, the multidimensional representation used by business analysts must be derived from a data warehouse design using a relational DBMS.You will learn about design patterns, summarizability problems, and design methodologies. You will apply these concepts to mini case studies about data warehouse design. At the end of the module, you will have created data warehouse designs based on data sources and business needs of hypothetical organizations.
Video · Relational database concepts for multidimensional data video lecture
Reading · Powerpoint lecture notes for lesson 1
Video · Table design patterns video lecture
Reading · Powerpoint lecture notes for lesson 2
Video · Summarizability patterns for dimension tables video lecture
Reading · Powerpoint lecture notes for lesson 3
Video · Summarizability patterns for dimension-fact relationships video lecture
Reading · Powerpoint lecture notes for lesson 4

Video · Mini case for data warehouse design video lecture
Reading · Powerpoint lecture notes for lesson 5
Video · Data warehouse design methodologies video lecture
Reading · Powerpoint lecture notes for lesson 6
Quiz · Module 3 quiz
Reading · Practice problems for module 3
Reading · Optional textbook reading material
Peer Review · Assignment for module 3
WEEK 4
Data Integration Concepts, Processes, and Techniques Description: Module 4 extends your background about data warehouse development. After learning about schema design concepts and practices, you are ready to learn about data integration processing to populate and refresh a data warehouse. The informational background in module 4 covers concepts about data sources, data integration processes, and techniques for pattern matching and inexact matching of text. Module 4 provides a context for the software skills that you will learn in module 5.
Video · Concepts of data integration processes video lecture
Reading · Powerpoint lecture notes for lesson 1
Video · Change data concepts video lecture
Reading · Powerpoint lecture notes for lesson 2
Video · Data cleaning tasks video lecture
Reading · Powerpoint lecture notes for lesson 3
Video · Pattern matching with regular expressions video lecture
Reading · Powerpoint lecture notes for lesson 4
Video · Matching and consolidation video lecture
Reading · Powerpoint lecture notes for lesson 5

Video · Quasi identifiers and distance functions for entity matching video lecture
Reading · Powerpoint lecture notes for lesson 6
Quiz · Module 4 quiz
Reading · Optional reading material
WEEK 5
Architectures, Features, and Details of Data Integration Tools Description: Module 5 extends your background about data integration from module 4. Module 5 covers architectures, features, and details about data integration tools to complement the conceptual background in module 4. You will learn about the features of two open source data integration tools, Talend Open Studio and Pentaho Data Integration. You will use Pentaho Data Integration in guided tutorial in preparation for a graded assignment involving Pentaho Data Integration.
Video · Architectures and marketplace video lecture
Reading · Powerpoint lecture notes for lesson 1
Video · Common features of data Integration tools video lecture
Reading · Powerpoint lecture notes for lesson 2
Video · Talend Open Studio video lecture
Reading · Powerpoint lecture notes for lesson 3
Video · Pentaho Data Integration video lecture
Reading · Powerpoint lecture notes for lesson 4
Video · Software video demonstration for Pentaho Data Integration
Quiz · Module 5 quiz
Reading · Optional reading material
Reading · Guided tutorial for Pentaho Data Integration
Reading · Documents for the module 5 assignment
Peer Review · Assignment for module 5

Quiz · Quiz for module 5 assignment
Video · Course conclusion video lecture

COURSE 3: RELATIONAL DATABASE SUPPORT FOR DATA WAREHOUSES
Relational Database Support for Data Warehouses is the third course in the Data Warehousing for Business Intelligence specialization. In this course, you'll use analytical elements of SQL for answering business intelligence questions. You'll learn features of relational database management
systems for managing summary data commonly used in business intelligence reporting. Because of the importance and difficulty of managing implementations of data warehouses, we'll also delve into storage architectures, scalable parallel processing, data governance, and big data impacts.
WEEK 1
DBMS Extensions and Example Data Warehouses
Module 1 introduces the course and covers concepts that provide a context for the remainder of this course. In the first two lessons, you’ll understand the objectives for the course and know what topics and assignments to expect. In the remaining lessons, you will learn about DBMS extensions, a review of schema patterns, data warehouses used in practice problems and assignments, and examples of data warehouses in education and health care. This informational module will ensure that you have the background for success in later modules that emphasize details and hands-on skills.You should also read about the software requirements in the lesson at the end of module 1. I recommend that you try to install the Oracle software this week before assignments begin in week 2. If you have taken other courses in the specialization, you may already have installed the Oracle software.
Video · Course introduction video
Video · Course objectives video lecture
Reading · Powerpoint lecture notes for lesson 1
Video · Course topics and assignments video lecture
Reading · Powerpoint lecture notes for lesson 2
Reading · Optional textbook
Video · DBMS extensions video lecture
Reading · Powerpoint lecture notes for lesson 3
Video · Relational database schema patterns video lecture
Reading · Powerpoint lecture notes for lesson 4
Video · Colorado Education Data Warehouse video lecture
Reading · Powerpoint lecture notes for lesson 5
Video · Data warehouse standards in health care video lecture
Reading · Powerpoint lecture notes for lesson 6
Reading · Overview of software requirements

Reading · Overview of database software installation
Reading · Oracle installation notes
Reading · Making connections to a local Oracle database
Reading · SQL statements for Store Sales tables
Reading · SQL statements for Inventory tables
Quiz · Module 1 quiz
Reading · Optional textbook reading material
WEEK 2
SQL Subtotal Operators
Now that you have the informational context for relational database support of data warehouses, you’ll start using relational databases to write business intelligence queries! In module 2, you will learn an important extension of the SQL SELECT statement for subtotal operators. You’ll apply what you’ve learned in practice and graded problems using Oracle SQL for problems involving the CUBE, ROLLUP, and GROUPING SETS operators. Because the subtotal operators are part of the SQL standard, your learning will readily apply to other enterprise DBMSs. At the end of this module, you will have solid background to write queries using the SQL subtotal operators as a data warehouse analyst.
Video · GROUP BY clause review video lecture
Reading · Powerpoint lecture notes for lesson 1
Reading · Additional problems for lesson 1
Video · SQL CUBE operator video lecture
Reading · Powerpoint lecture notes for lesson 2
Reading · Additional problems for lesson 2
Video · SQL ROLLUP operator video lecture
Reading · Powerpoint lecture notes for lesson 3
Reading · Additional problems for lesson 3
Video · SQL GROUPING SETS operator video lecture
Reading · Powerpoint lecture notes for lesson 4

Reading · Additional problems for lesson 4
Video · Variations of subtotal operators video lecture
Reading · Powerpoint lecture notes for lesson 5
Reading · Additional problems for lesson 5
Quiz · Module 2 quiz
Reading · Optional textbook reading material
Reading · Assignment notes
Quiz · Quiz for module 2 assignment
Peer Review · Assignment for module 2
WEEK 3
SQL Analytic Functions
After your experience using the SQL subtotal operators, you are ready to learn another important SQL extension for business intelligence applications. In module 3, you will learn about an extended processing model for SQL analytic functions that support common analysis in business intelligence applications. You’ll apply what you’ve learned in practice and graded problems using Oracle SQL for problems involving qualitative ranking of business units, window comparisons showing relationships of business units over time, and quantitative contributions showing performance thresholds and contributions of individual business units to a whole business. Because analytic functions are part of the SQL standard, your learning will apply to other enterprise DBMSs. At the end of this module, you will have solid background to write queries using the SQL analytic functions as a data warehouse analyst.
Video · Processing Model and Basic Syntax video lecture
Reading · Powerpoint lecture notes for lesson 1
Reading · Additional problems for lesson 1
Video · Extended Syntax and Ranking Functions video lecture
Reading · Powerpoint lecture notes for lesson 2
Reading · Additional problems for lesson 2
Video · Window Comparison I video lecture
Reading · Powerpoint lecture notes for lesson 3

Reading · Additional problems for lesson 3
Video · Window Comparisons II video lecture
Reading · Powerpoint lecture notes for lesson 4
Reading · Additional problems for lesson 4
Video · Functions for Ratio Comparisons video lecture
Reading · Powerpoint lecture notes for lesson 5
Reading · Additional problems for lesson 5
Quiz · Module 3 quiz
Reading · Optional textbook reading material
Reading · Assignment notes
Quiz · Quiz for module 3 assignment
Peer Review · Assignment for module 3
WEEK 4
Materialized View Processing and Design
After acquiring query formulation skills for development of business intelligence applications, you are ready to learn about DBMS extensions for efficient query execution. Business intelligence queries can use lots of resources so materialized view processing and design has become an important extension of DBMSs. In module 4, you will learn about an SQL statement for creating materialized views, processing requirements for materialized views, and rules for rewriting queries using materialized views. To gain insight about the complexity of query rewriting, you will practice rewriting queries using materialized views. To provide closure about relational database support for data warehouses, you will learn about about Oracle tools for data integration, the Oracle Data Integrator, along with two SQL statements useful for specific data integration tasks. After this module, you will have a solid background to use materialized views to improve query performance and deploy the Extraction, Loading, and Transformation approach for data integration as a data warehouse administrator or analyst.
Video · Background on traditional views video lecture
Reading · Powerpoint lecture notes for lesson 1
Reading · Additional problems for lesson 1
Video · Materialized view definition and processing video lecture

Reading · Powerpoint lecture notes for lesson 2
Reading · Additional problems for lesson 2
Video · Query Rewriting Rules video lecture
Reading · Powerpoint lecture notes for lesson 3
Video · Query Rewriting Examples video lecture
Reading · Powerpoint lecture notes for lesson 4
Reading · Additional problems for lesson 4
Video · Oracle Tools for Data Integration video lecture
Reading · Powerpoint lecture notes for lesson 5
Reading · Additional problems for lesson 5
Quiz · Module 4 quiz
Reading · Optional textbook reading material
Reading · Assignment notes
Quiz · Quiz for module 4 assignment
Peer Review · Assignment for module 4
WEEK 5
Physical Design and Governance
Module 5 finishes the course with a return to conceptual material about physical design technologies and data governance practices. You will learn about storage architectures, scalable parallel processing, big data issues, and data governance. After this module, you will have background about conceptual issues important for data warehouse administrators.
Video · Storage Architectures video lecture
Reading · Powerpoint lecture notes for lesson 1
Video · Scalable Parallel Processing Approaches video lecture
Reading · Powerpoint lecture notes for lesson 2
Video · Big data issues video lecture
Reading · Powerpoint lecture notes for lesson 3
Video · Data Governance video lecture
Reading · Powerpoint lecture notes for lesson 4
Quiz · Module 5 quiz
Reading · Optional textbook reading material
Video · Closing Lecture
COURSE 4: BUSINESS INTELLIGENCE CONCEPTS, TOOLS, AND APPLICATIONS
This is the fourth course in the Data Warehouse for Business Intelligence specialization. Ideally, the courses should be taken in sequence. In this course, you will gain the knowledge and skills for using data warehouses for business intelligence purposes and for working as a business intelligence developer. You’ll have the opportunity to work with large data sets in a data warehouse environment and will learn the use of MicroStrategy's Online Analytical Processing (OLAP) and Visualization capabilities to create visualizations and dashboards. The course gives an overview of how business intelligence technologies can support decision making across any number of business sectors. These technologies have had a profound impact on corporate strategy, performance, and competitiveness and broadly encompass decision support systems, business intelligence systems, and visual analytics. Modules are organized around the business intelligence concepts, tools, and applications, and the use of data warehouse for business reporting and online analytical processing, for creating visualizations and dashboards, and for business performance management and descriptive analytics.
WEEK 1
Decision Making and Decision Support Systems
Module 1 explains the role of computerized support for decision making and its importance. It starts by identifying the different types of decisions managers face, and the process through which they make decisions. It then focuses on decision making styles, the four stages of Simon’s decision making process, and common strategies and approaches of decision makers. In the next two lessons, you will learn the role of Decision Support Systems (DSS), understand its main components, the various DSS types and classification, and how DSS have changed over time. Finally, in lesson 4, we focus on how DSS supports each phase of decision making and summarize the evolution of DSS applications, and on how they have changed over time. I recommend that you go to Ready Made DSS sites and use some of DSS that are listed for various types of decisions. You will need to install MicroStrategy Desktop to analyze three stand-alone offline dashboards in a peer evaluated exercise.

Video · Course Introduction Video Lecture
Reading · Optional Text Book
Reading · Additional Resources - Course Overview
Video · Overview of Decision Making Video Lecture
Reading · Powerpoint and Lecture Notes for Lesson 1.1
Reading · Additional Resources Lesson 1.1
Video · Conceptual Foundations of Decision Making Video Lecture
Reading · Powerpoint and Lecture Notes for Lesson 1.2
Reading · Additional Resources Lesson 1.2
Reading · Periodicals
Video · Decision Support Systems Video Lecture
Reading · Powerpoint and Lecture Notes for Lesson 1.3
Reading · Additional Resources for Lesson 1.3
Reading · Additional Web Resources
Reading · Vendors and Software Companies
Video · Decision Making Support in Practice Video Lecture
Reading · Powerpoint and Lecture Notes for Lesson 1.4
Reading · Additional Resources for Lesson 1.4
Reading · Ready Made DSS Products and Services
Reading · MicroStrategy Desktop Software Download and Installtions Steps for PC and MAC
Reading · MicroStrategy Desktop Connections to Oracle VM on PC and MAC
Reading · MicroStrategy Desktop Welcome Training Video
Reading · Dashboards Demonstration Videos
Peer Review · Assignment for Module 1: Offline Dashboards with Advanced Visualizations
Practice Quiz · Module 1 Practice Quiz
WEEK 2
Business Intelligence Concepts and Platform Capabilities
Now that you understand the conceptual foundation of decision making and DSS, in module 2 we start by defining business intelligence (BI), BI architecture, and its components, and relate them to DSS. In lesson 2, you will learn the main components of BI platforms, their capabilities, and understand the competitive landscape of BI platforms. In lesson 3, you will learn the building blocks of business reports, the types of business reports, and the components and structure of business reporting systems . Finally in lesson 4, you will learn different types of OLAP and their applications, and comprehend the differences between OLAP and OLTP. You will need to use MicroStrategy Desktop to create effective and compelling data visualizations to analyze data and acquire insights into business practices in a peer evaluated exercise.
Video · BI Concepts Video Lecture
Reading · Powerpoint and Lecture Notes for Lesson 2.1
Reading · Additional Resources for Lesson 2.1
Reading · Training Video for Connecting Data in MicroStrategy Desktop
Video · BI Platform Capabilities Video Lecture
Reading · Powerpoint and Lecture Notes for Lesson 2.2
Reading · Additional Resources for Lesson 2.2
Video · Training Video for Microstrategy Desktop BI Capabilities
Video · Business Reporting Video Lecture
Reading · Powerpoint and Lecture Notes for Lesson 2.3
Reading · Additional Resources for Lesson 2.3
Reading · Training Videos for Connecting to Spreadsheets, Joining Datasets, and Data Blending in MicroStrategy Desktop
Video · BI OLAP Styles Video Lecture
Reading · Powerpoint and Lecture Notes for Lesson 2. 4
Reading · Additional Resources for Lesson 2.4
Reading · Training Video for Wrangling and Profiling Data in MicroStrategy
Practice Quiz · Module 2 Practice Quiz
Peer Review · Assignment for Module 2: World Wide Carbon Emissions Scenario
Quiz · Modules 1 and 2 Graded Quiz #1
WEEK 3
Data Visualization and Dashboard Design
This module continues on the top job responsibilities of BI analysts by focusing on creating data visualizations and dashboards. You will first learn the importance of data visualization and different types of data that can be visually represented. You will then learn about the types of basic and composite charts. This will help you to determine which visualization is most effective to display data for a given data set, and to identify best practices for designing data visualizations. In lesson 3, you will learn the common characteristics of dashboard, the types of dashboards, and the list attributes of metrics usually included in dashboards. Finally in lesson 4, you will learn the guidelines for designing dashboard and the common pitfalls of dashboard design. You will need to use MicroStrategy Desktop Visual Insight to design a dashboard for a Financial Services company in a peer evaluated exercise.
Video · Data Visualization Video Lecture
Reading · Powerpoint and Lecture Notes for Lesson 3.1
Reading · Additional Resources for Lesson 3.1
Reading · Training Video for Visual Insight in MicroStrategy Desktop
Video · Data Visualization Guidlines and Pitfalls Video Lecture
Reading · Powerpoint and Lecture Notes for Lesson 3.2
Reading · Additional Resources for Lesson 3.2
Reading · Training Video for Exploring Data in MicroStrategy Desktop
Video · Comprehensive Training Video for Showing Data Visualization Steps
Video · Performance Dashboards Video Lecture
Reading · Powerpoint and Lecture Notes for Lesson 3.3
Reading · Additional Resources for Lesson 3.3
Reading · Training Videos for Creating Dashboard in MicroStrategy Desktop
Video · Dashboard Design Guidelines and Pitfalls Video Lecture
Reading · Powerpoint and Lecture Notes for Lesson 3.4

Reading · Additional Resources for Lesson 3.4
Reading · Training Video for Sharing a Dashboard in MicroStrategy Desktop
Video · Comprehensive Training Video for Creating Dashboard Using Advanced Visualization
Practice Quiz · Module 3 Practice Quiz
Peer Review · Assignment for Module 3: Design Dashboard for a Financial Service Company
WEEK 4
Business Performance Management Systems
This module focuses on how BI is used for Business Performance Management (BPM). You will learn the main components of BPM as well as the four phases of BPM cycle and how organizations typically deploy BPM. In lesson 2, you will learn the purpose of Performance Measurement System and how organizations need to define the key performance indicators (KPIs) for their performance management system. In lesson 3, you will learn the four balanced scorecards perspectives and the differences between dashboards and scorecards. You will also be able to compare and contrast the benefits of using balanced scorecard versus using Six Sigma in a performance measurement system. Finally in lesson 4, you will learn the role of visual and business analytics (BA) in BI and how various forms of BA are supported in practice. At the end of the module, you will apply these concepts to create a dashboard, blend it with external data sets, and explore various visualization capabilities to find insights faster in a peer evaluated exercise.
Video · Business Performance Management Video Lecture
Reading · Powerpoint and Lecture Notes for Lesson 4.1
Reading · Additional Resources for Lesson 4.1
Reading · Training Videos for Enriching and Modeling Data with MicroStrategy
Video · Performance Measurement System Video Lecture
Reading · Powerpoint and Lecture Notes for Lesson 4.2
Reading · Additional Resources for Lesson 4.2
Reading · Training Videos for Connecting to MDX and Excel Files and Creating a Mashups in MicroStrategy Desktop
Video · Balanced Scorecards Versus Six Sigma Video Lecture
Reading · Powerpoint and Lecture Notes for Lesson 4.3
Reading · Additional Resources for Lesson 4.3

Video · Training Video for MicroStrategy Desktop Business Performance Analysis
Video · Business Analytics Video Lecture
Reading · Powerpoint and Lecture Notes for Lesson 4.4
Reading · Additional Resources for Lesson 4.4
Reading · Training Video for Connecting to Social Media Sources in MicroStrategy Desktop
Practice Quiz · Module 4 Practice Quiz
Peer Review · Assignment for Module 4: Advanced Enterprise Data Discovery
WEEK 5
BI Maturity, Strategy, and Summative Project
Module 5 covers BI maturity and strategy. You will learn different levels of BI maturity, the factors that impact BI maturity within an organization, and the main challenges and the potential solutions for a pervasive BI maturity within an organization. The last lesson will focus on the critical success factors for implementing a BI strategy, BI framework, and BI implementation targets. Finally, in your summative project, you will use MicroStrategy visual analytics capabilities to analyze KPIs for a fast food company to find the causes for problems .
Video · BI Maturity Video Lecture
Reading · Powerpoint and Lecture Notes for Lesson 5.1
Reading · Additional Resources for Lesson 5.1
Peer Review · Summative Project: BPM For Blazin' Burger Fast Food Restaurant
Video · BI Strategy Video Lecture
Reading · Powerpoint and Lecture Notes for Lesson 5.2
Reading · Additional Resources for Lesson 5.2
Quiz · Modules 3, 4, and 5 Graded Quiz #2
Video · Course Closing Video

PROJECT: DESIGN AND BUILD A DATA WAREHOUSE FOR BUSINESS INTELLIGENCE
IMPLEMENTATION
Seen below is the data integration tool used for this project.
Below is the integration editor.

Below is the Pentaho data warehouse server and working OLAP Cube.
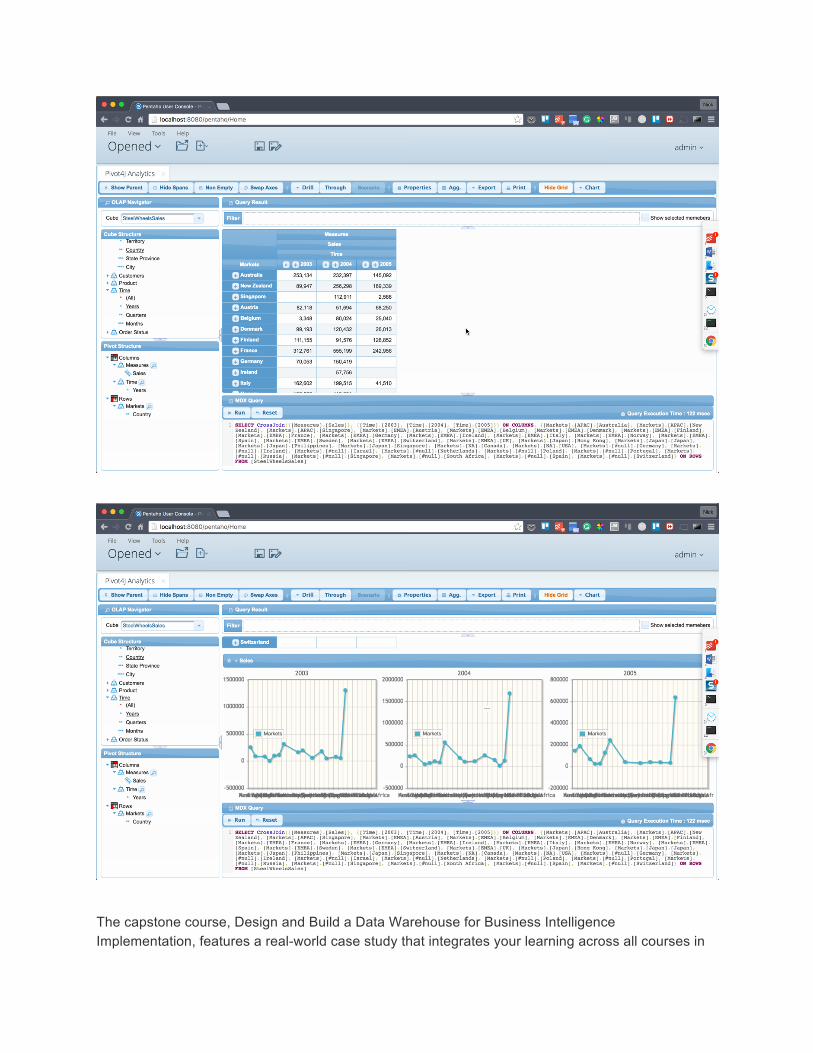
The capstone course, Design and Build a Data Warehouse for Business Intelligence Implementation, features a real-world case study that integrates your learning across all courses in
the specialization. In response to business requirements presented in a case study, you’ll design and build a small data warehouse, create data integration workflows to refresh the warehouse, write SQL statements to support analytical and summary query requirements, and use the MicroStrategy business intelligence platform to create dashboards and visualizations. In the first part of the capstone course, you’ll be introduced to a medium-sized firm, learning about their data warehouse and business intelligence requirements and existing data sources. You’ll first architect a warehouse schema and dimensional model for a small data warehouse. You’ll then create data integration workflows using Pentaho Data Integration to refresh your data warehouse. Next, you’ll write SQL statements for analytical query requirements and create materialized views to support summary data management. Finally, you will use MicroStrategy OLAP capabilities to gain insights into your data warehouse. In the completed project, you’ll have built a small data warehouse containing a schema design, data integration workflows, analytical queries, materialized views, dashboards and visualizations that you’ll be proud to show to your current and prospective employers.
WEEK 1
Course Overview
Module 1 introduces the objectives and topics in the course and provides background on the case and software requirements. The capstone course is organized around a realistic case study based on the business situation faced by CPI Card Group in 2015.
Video · Course introduction
Reading · Slides for lesson 1
Video · Course topics and assignments video lesson
Reading · Slides for lesson 2
Video · Executive interview
Reading · Slides for lesson 3
Reading · Background on CPI Card Group
Reading · Overview of software requirements
Reading · Oracle database server installation
Reading · Pentaho Data Integration installation
Reading · Microstrategy Desktop installation
Reading · Database diagramming tools
WEEK 2

Data Warehouse Design
Module 2 presents the requirements of the first part of the case study involving data warehouse design. To provide a context for the case study, you can listen to an executive interview with a CPI Card Group executive.
Video · Executive interview
Reading · Slides for lesson 1
Reading · Data warehouse design background
Reading · Documents for the module 2 assignment
Peer Review · Data warehouse design assignment
Reading · Documents to review after the assignment
WEEK 3
Data Integration
Module 3 presents requirements for the second part of the case study involving data integration. To provide a context for the case study, you can listen to executive interviews with executives from CPI Card Group, First Bank, and Pinnacol Assurance.
Video · Executive interview
Reading · Slides for lesson 1
Video · Executive interview
Reading · Slides for lesson 2
Video · Executive interview
Reading · Slides for lesson 3
Reading · Data integration background
Reading · Documents for the module 3 assignment
Peer Review · Assignment for module 3
Practice Quiz · Practice Quiz for module 5 assignment-Test DW
Quiz · Quiz for module 5 assignment-Production DW
WEEK 4
Analytical Queries and Summary Data Management
Module 4 presents requirements for the third part of the case study involving analytical queries and summary data management.
Video · Executive Interview with Kellyn Gorman of Oracle
Reading · Slides for lesson 1
Reading · Documents for the module 4 assignment
Peer Review · Analytical Query Assignemnt
Reading · Solutions to challenge problems
WEEK 5
Data Visualization and Dashboard Design Requirements
Module 5 presents the data visualization and dashboard design requirements for the fourth part of the case study.
Video · Executive Interview with Matthew Caton of Data Source Consulting
Reading · Slides for executive interview with Matthew Caton
Video · Executive Interview with Tyler Wilson on BI Platform Capabilities at CPI Card Group
Reading · Capstone Project Data Visualizations and Dashboard Design Requirements
Reading · Earlier Assignments from Course 4
WEEK 6
Wrap Up and Project Submission
This is an extension of Module 5. The peer assessment from module 5 is moved to module 6 to give you more time completing the assignments in prior modules as well as for you to do your peer assessment in this module.
Video · Executive Interview with James Gualke on the State of BI Maturity and Strategy at PDC Energy
Reading · Background Information on Data Visualization and Dashboard Design
Peer Review · Data Visualization and Dashboard Design Assignment

Video · Course conclusion video lecture

MACHINE LEARNING SPECIALIZATION
COURSE 1: MACHINE LEARNING FOUNDATIONS: A CASE STUDY APPROACH
This first course treats the machine learning method as a black box. Using this abstraction, you will focus on understanding tasks of interest, matching these tasks to machine learning tools, and assessing the quality of the output. In subsequent courses, you will delve into the components of this black box by examining models and algorithms. Together, these pieces form the machine learning pipeline, which you will use in developing intelligent applications. Learning Outcomes: By the end of this course, you will be able to: -Identify potential applications of machine learning in practice. -Describe the core differences in analyses enabled by regression, classification, and clustering. -Select the appropriate machine learning task for a potential application. -Apply regression, classification, clustering, retrieval, recommender systems, and deep learning. -Represent your data as features to serve as input to machine learning models. -Assess the model quality in terms of relevant error metrics for each task. -Utilize a dataset to fit a model to analyze new data. -Build an end-to-end application that uses machine learning at its core. -Implement these techniques in Python.
WEEK 1
Welcome
Machine learning is everywhere, but is often operating behind the scenes.
This introduction to the specialization provides you with insights into the power of machine learning, and the multitude of intelligent applications you personally will be able to develop and deploy upon completion.
We also discuss who we are, how we got here, and our view of the future of intelligent applications.
Reading · Slides presented in this module
Video · Welcome to this course and specialization
Video · Who we are
Video · Machine learning is changing the world
Video · Why a case study approach?
Video · Specialization overview
Video · How we got into ML
Video · Who is this specialization for?
Video · What you'll be able to do
Video · The capstone and an example intelligent application
Video · The future of intelligent applications
Reading · Reading: Getting started with Python, IPython Notebook & GraphLab Create
Reading · Reading: where should my files go?
Reading · Download the IPython Notebook used in this lesson to follow along
Video · Starting an IPython Notebook
Video · Creating variables in Python
Video · Conditional statements and loops in Python
Video · Creating functions and lambdas in Python
Reading · Download the IPython Notebook used in this lesson to follow along
Video · Starting GraphLab Create & loading an SFrame
Video · Canvas for data visualization
Video · Interacting with columns of an SFrame
Video · Using .apply() for data transformation
WEEK 2
Regression: Predicting House Prices
This week you will build your first intelligent application that makes predictions from data.
We will explore this idea within the context of our first case study, predicting house prices, where you will create models that predict a continuous value (price) from input features (square footage, number of bedrooms and bathrooms,...).
This is just one of the many places where regression can be applied.Other applications range from predicting health outcomes in medicine, stock prices in finance, and power usage in high-performance computing, to analyzing which regulators are important for gene expression.
You will also examine how to analyze the performance of your predictive model and implement regression in practice using an iPython notebook.
Reading · Slides presented in this module
Video · Predicting house prices: A case study in regression

Video · What is the goal and how might you naively address it?
Video · Linear Regression: A Model-Based Approach
Video · Adding higher order effects
Video · Evaluating overfitting via training/test split
Video · Training/test curves
Video · Adding other features
Video · Other regression examples
Video · Regression ML block diagram
Quiz · Regression
Reading · Download the IPython Notebook used in this lesson to follow along
Video · Loading & exploring house sale data
Video · Splitting the data into training and test sets
Video · Learning a simple regression model to predict house prices from house size
Video · Evaluating error (RMSE) of the simple model
Video · Visualizing predictions of simple model with Matplotlib
Video · Inspecting the model coefficients learned
Video · Exploring other features of the data
Video · Learning a model to predict house prices from more features
Video · Applying learned models to predict price of an average house
Video · Applying learned models to predict price of two fancy houses
Reading · Reading: Predicting house prices assignment
Quiz · Predicting house prices
WEEK 3
Classification: Analyzing Sentiment
How do you guess whether a person felt positively or negatively about an experience, just from a short review they wrote?
In our second case study, analyzing sentiment, you will create models that predict a class (positive/negative sentiment) from input features (text of the reviews, user profile information,...).This task is an example of classification, one of the most widely used areas of machine learning, with a broad array of applications, including ad targeting, spam detection, medical diagnosis and image classification.
You will analyze the accuracy of your classifier, implement an actual classifier in an iPython notebook, and take a first stab at a core piece of the intelligent application you will build and deploy in your capstone.
Reading · Slides presented in this module
Video · Analyzing the sentiment of reviews: A case study in classification
Video · What is an intelligent restaurant review system?
Video · Examples of classification tasks
Video · Linear classifiers
Video · Decision boundaries
Video · Training and evaluating a classifier
Video · What's a good accuracy?
Video · False positives, false negatives, and confusion matrices
Video · Learning curves
Video · Class probabilities
Video · Classification ML block diagram
Quiz · Classification
Reading · Download the IPython Notebook used in this lesson to follow along
Video · Loading & exploring product review data
Video · Creating the word count vector
Video · Exploring the most popular product
Video · Defining which reviews have positive or negative sentiment
Video · Training a sentiment classifier
Video · Evaluating a classifier & the ROC curve
Video · Applying model to find most positive & negative reviews for a product
Video · Exploring the most positive & negative aspects of a product
Reading · Reading: Analyzing product sentiment assignment
Quiz · Analyzing product sentiment
WEEK 4
Clustering and Similarity: Retrieving Documents
A reader is interested in a specific news article and you want to find a similar articles to recommend. What is the right notion of similarity? How do I automatically search over documents to find the one that is most similar? How do I quantitatively represent the documents in the first place?
In this third case study, retrieving documents, you will examine various document representations and an algorithm to retrieve the most similar subset. You will also consider structured representations of the documents that automatically group articles by similarity (e.g., document topic).
You will actually build an intelligent document retrieval system for Wikipedia entries in an iPython notebook.
Reading · Slides presented in this module
Video · Document retrieval: A case study in clustering and measuring similarity
Video · What is the document retrieval task?
Video · Word count representation for measuring similarity
Video · Prioritizing important words with tf-idf
Video · Calculating tf-idf vectors
Video · Retrieving similar documents using nearest neighbor search
Video · Clustering documents task overview
Video · Clustering documents: An unsupervised learning task
Video · k-means: A clustering algorithm
Video · Other examples of clustering

Video · Clustering and similarity ML block diagram
Quiz · Clustering and Similarity
Reading · Download the IPython Notebook used in this lesson to follow along
Video · Loading & exploring Wikipedia data
Video · Exploring word counts
Video · Computing & exploring TF-IDFs
Video · Computing distances between Wikipedia articles
Video · Building & exploring a nearest neighbors model for Wikipedia articles
Video · Examples of document retrieval in action
Reading · Reading: Retrieving Wikipedia articles assignment
Quiz · Retrieving Wikipedia articles
WEEK 5
Recommending Products
Ever wonder how Amazon forms its personalized product recommendations? How Netflix suggests movies to watch? How Pandora selects the next song to stream? How Facebook or LinkedIn finds people you might connect with? Underlying all of these technologies for personalized content is something called collaborative filtering.
You will learn how to build such a recommender system using a variety of techniques, and explore their tradeoffs.
One method we examine is matrix factorization, which learns features of users and products to form recommendations. In an iPython notebook, you will use these techniques to build a real song recommender system.
Reading · Slides presented in this module
Video · Recommender systems overview
Video · Where we see recommender systems in action
Video · Building a recommender system via classification
Video · Collaborative filtering: People who bought this also bought...
Video · Effect of popular items

Video · Normalizing co-occurrence matrices and leveraging purchase histories
Video · The matrix completion task
Video · Recommendations from known user/item features
Video · Predictions in matrix form
Video · Discovering hidden structure by matrix factorization
Video · Bringing it all together: Featurized matrix factorization
Video · A performance metric for recommender systems
Video · Optimal recommenders
Video · Precision-recall curves
Video · Recommender systems ML block diagram
Quiz · Recommender Systems
Reading · Download the IPython Notebook used in this lesson to follow along
Video · Loading and exploring song data
Video · Creating & evaluating a popularity-based song recommender
Video · Creating & evaluating a personalized song recommender
Video · Using precision-recall to compare recommender models
Reading · Reading: Recommending songs assignment
Quiz · Recommending songs
WEEK 6
Deep Learning: Searching for Images
You’ve probably heard that Deep Learning is making news across the world as one of the most promising techniques in machine learning. Every industry is dedicating resources to unlock the deep learning potential, including for tasks such as image tagging, object recognition, speech recognition, and text analysis.
In our final case study, searching for images, you will learn how layers of neural networks provide very descriptive (non-linear) features that provide impressive performance in image classification
and retrieval tasks. You will then construct deep features, a transfer learning technique that allows you to use deep learning very easily, even when you have little data to train the model.
Using iPhython notebooks, you will build an image classifier and an intelligent image retrieval system with deep learning.
Reading · Slides presented in this module
Video · Searching for images: A case study in deep learning
Video · What is a visual product recommender?
Video · Learning very non-linear features with neural networks
Video · Application of deep learning to computer vision
Video · Deep learning performance
Video · Demo of deep learning model on ImageNet data
Video · Other examples of deep learning in computer vision
Video · Challenges of deep learning
Video · Deep Features
Video · Deep learning ML block diagram
Quiz · Deep Learning
Reading · Download the IPython Notebook used in this lesson to follow along
Video · Loading image data
Video · Training & evaluating a classifier using raw image pixels
Video · Training & evaluating a classifier using deep features
Reading · Download the IPython Notebook used in this lesson to follow along
Video · Loading image data
Video · Creating a nearest neighbors model for image retrieval
Video · Querying the nearest neighbors model to retrieve images
Video · Querying for the most similar images for car image
Video · Displaying other example image retrievals with a Python lambda

Reading · Reading: Deep features for image retrieval assignment
Quiz · Deep features for image retrieval
Closing Remarks
In the conclusion of the course, we will describe the final stage in turning our machine learning tools into a service: deployment.
We will also discuss some open challenges that the field of machine learning still faces, and where we think machine learning is heading. We conclude with an overview of what's in store for you in the rest of the specialization, and the amazing intelligent applications that are ahead for us as we evolve machine learning.
Reading · Slides presented in this module
Video · You've made it!
Video · Deploying an ML service
Video · What happens after deployment?
Video · Open challenges in ML
Video · Where is ML going?
Video · What's ahead in the specialization
Video · Thank you!
COURSE 2: MACHINE LEARNING: REGRESSION
In our first case study, predicting house prices, you will create models that predict a continuous value (price) from input features (square footage, number of bedrooms and bathrooms,...). This is just one of the many places where regression can be applied. Other applications range from predicting health outcomes in medicine, stock prices in finance, and power usage in high-performance computing, to analyzing which regulators are important for gene expression. In this course, you will explore regularized linear regression models for the task of prediction and feature selection. You will be able to handle very large sets of features and select between models of various complexity. You will also analyze the impact of aspects of your data -- such as outliers -- on your selected models and predictions. To fit these models, you will implement optimization algorithms that scale to large datasets. Learning Outcomes: By the end of this course, you will be able to: -Describe the input and output of a regression model. -Compare and contrast bias and variance when modeling data. -Estimate model parameters using optimization algorithms. -Tune

parameters with cross validation. -Analyze the performance of the model. -Describe the notion of sparsity and how LASSO leads to sparse solutions. -Deploy methods to select between models. -Exploit the model to form predictions. -Build a regression model to predict prices using a housing dataset. -Implement these techniques in Python.
WEEK 1
Welcome
Regression is one of the most important and broadly used machine learning and statistics tools out there. It allows you to make predictions from data by learning the relationship between features of your data and some observed, continuous-valued response. Regression is used in a massive number of applications ranging from predicting stock prices to understanding gene regulatory networks.
This introduction to the course provides you with an overview of the topics we will cover and the background knowledge and resources we assume you have.
Reading · Slides presented in this module
Video · Welcome!
Video · What is the course about?
Video · Outlining the first half of the course
Video · Outlining the second half of the course
Video · Assumed background
Reading · Reading: Software tools you'll need
Simple Linear Regression
Our course starts from the most basic regression model: Just fitting a line to data. This simple model for forming predictions from a single, univariate feature of the data is appropriately called "simple linear regression".
In this module, we describe the high-level regression task and then specialize these concepts to the simple linear regression case. You will learn how to formulate a simple regression model and fit the model to data using both a closed-form solution as well as an iterative optimization algorithm called gradient descent. Based on this fitted function, you will interpret the estimated model parameters and form predictions. You will also analyze the sensitivity of your fit to outlying observations.
You will examine all of these concepts in the context of a case study of predicting house prices from the square feet of the house.

Reading · Slides presented in this module
Video · A case study in predicting house prices
Video · Regression fundamentals: data & model
Video · Regression fundamentals: the task
Video · Regression ML block diagram
Video · The simple linear regression model
Video · The cost of using a given line
Video · Using the fitted line
Video · Interpreting the fitted line
Video · Defining our least squares optimization objective
Video · Finding maxima or minima analytically
Video · Maximizing a 1d function: a worked example
Video · Finding the max via hill climbing
Video · Finding the min via hill descent
Video · Choosing stepsize and convergence criteria
Video · Gradients: derivatives in multiple dimensions
Video · Gradient descent: multidimensional hill descent
Video · Computing the gradient of RSS
Video · Approach 1: closed-form solution
Reading · Optional reading: worked-out example for closed-form solution
Video · Approach 2: gradient descent
Reading · Optional reading: worked-out example for gradient descent
Video · Comparing the approaches
Reading · Download notebooks to follow along
Video · Influence of high leverage points: exploring the data

Video · Influence of high leverage points: removing Center City
Video · Influence of high leverage points: removing high-end towns
Video · Asymmetric cost functions
Video · A brief recap
Quiz · Simple Linear Regression
Reading · Reading: Fitting a simple linear regression model on housing data
Quiz · Fitting a simple linear regression model on housing data
WEEK 2
Multiple Regression
The next step in moving beyond simple linear regression is to consider "multiple regression" where multiple features of the data are used to form predictions.
More specifically, in this module, you will learn how to build models of more complex relationship between a single variable (e.g., 'square feet') and the observed response (like 'house sales price'). This includes things like fitting a polynomial to your data, or capturing seasonal changes in the response value. You will also learn how to incorporate multiple input variables (e.g., 'square feet', '# bedrooms', '# bathrooms'). You will then be able to describe how all of these models can still be cast within the linear regression framework, but now using multiple "features". Within this multiple regression framework, you will fit models to data, interpret estimated coefficients, and form predictions.
Here, you will also implement a gradient descent algorithm for fitting a multiple regression model.
Reading · Slides presented in this module
Video · Multiple regression intro
Video · Polynomial regression
Video · Modeling seasonality
Video · Where we see seasonality
Video · Regression with general features of 1 input
Video · Motivating the use of multiple inputs
Video · Defining notation

Video · Regression with features of multiple inputs
Video · Interpreting the multiple regression fit
Reading · Optional reading: review of matrix algebra
Video · Rewriting the single observation model in vector notation
Video · Rewriting the model for all observations in matrix notation
Video · Computing the cost of a D-dimensional curve
Video · Computing the gradient of RSS
Video · Approach 1: closed-form solution
Video · Discussing the closed-form solution
Video · Approach 2: gradient descent
Video · Feature-by-feature update
Video · Algorithmic summary of gradient descent approach
Video · A brief recap
Quiz · Multiple Regression
Reading · Reading: Exploring different multiple regression models for house price prediction
Quiz · Exploring different multiple regression models for house price prediction
Reading · Numpy tutorial
Reading · Reading: Implementing gradient descent for multiple regression
Quiz · Implementing gradient descent for multiple regression
WEEK 3
Assessing Performance
Having learned about linear regression models and algorithms for estimating the parameters of such models, you are now ready to assess how well your considered method should perform in predicting new data. You are also ready to select amongst possible models to choose the best performing.
This module is all about these important topics of model selection and assessment. You will examine both theoretical and practical aspects of such analyses. You will first explore the concept of measuring the "loss" of your predictions, and use this to define training, test, and generalization
error. For these measures of error, you will analyze how they vary with model complexity and how they might be utilized to form a valid assessment of predictive performance. This leads directly to an important conversation about the bias-variance tradeoff, which is fundamental to machine learning. Finally, you will devise a method to first select amongst models and then assess the performance of the selected model.
The concepts described in this module are key to all machine learning problems, well-beyond the regression setting addressed in this course.
Reading · Slides presented in this module
Video · Assessing performance intro
Video · What do we mean by "loss"?
Video · Training error: assessing loss on the training set
Video · Generalization error: what we really want
Video · Test error: what we can actually compute
Video · Defining overfitting
Video · Training/test split
Video · Irreducible error and bias
Video · Variance and the bias-variance tradeoff
Video · Error vs. amount of data
Video · Formally defining the 3 sources of error
Video · Formally deriving why 3 sources of error
Video · Training/validation/test split for model selection, fitting, and assessment
Video · A brief recap
Quiz · Assessing Performance
Reading · Reading: Exploring the bias-variance tradeoff
Quiz · Exploring the bias-variance tradeoff
WEEK 4
Ridge Regression

You have examined how the performance of a model varies with increasing model complexity, and can describe the potential pitfall of complex models becoming overfit to the training data. In this module, you will explore a very simple, but extremely effective technique for automatically coping with this issue. This method is called "ridge regression". You start out with a complex model, but now fit the model in a manner that not only incorporates a measure of fit to the training data, but also a term that biases the solution away from overfitted functions. To this end, you will explore symptoms of overfitted functions and use this to define a quantitative measure to use in your revised optimization objective. You will derive both a closed-form and gradient descent algorithm for fitting the ridge regression objective; these forms are small modifications from the original algorithms you derived for multiple regression. To select the strength of the bias away from overfitting, you will explore a general-purpose method called "cross validation".
You will implement both cross-validation and gradient descent to fit a ridge regression model and select the regularization constant.
Reading · Slides presented in this module
Video · Symptoms of overfitting in polynomial regression
Reading · Download the notebook and follow along
Video · Overfitting demo
Video · Overfitting for more general multiple regression models
Video · Balancing fit and magnitude of coefficients
Video · The resulting ridge objective and its extreme solutions
Video · How ridge regression balances bias and variance
Reading · Download the notebook and follow along
Video · Ridge regression demo
Video · The ridge coefficient path
Video · Computing the gradient of the ridge objective
Video · Approach 1: closed-form solution
Video · Discussing the closed-form solution
Video · Approach 2: gradient descent
Video · Selecting tuning parameters via cross validation
Video · K-fold cross validation

Video · How to handle the intercept
Video · A brief recap
Quiz · Ridge Regression
Reading · Reading: Observing effects of L2 penalty in polynomial regression
Quiz · Observing effects of L2 penalty in polynomial regression
Reading · Reading: Implementing ridge regression via gradient descent
Quiz · Implementing ridge regression via gradient descent
WEEK 5
Feature Selection & Lasso
A fundamental machine learning task is to select amongst a set of features to include in a model. In this module, you will explore this idea in the context of multiple regression, and describe how such feature selection is important for both interpretability and efficiency of forming predictions.
To start, you will examine methods that search over an enumeration of models including different subsets of features. You will analyze both exhaustive search and greedy algorithms. Then, instead of an explicit enumeration, we turn to Lasso regression, which implicitly performs feature selection in a manner akin to ridge regression: A complex model is fit based on a measure of fit to the training data plus a measure of overfitting different than that used in ridge. This lasso method has had impact in numerous applied domains, and the ideas behind the method have fundamentally changed machine learning and statistics. You will also implement a coordinate descent algorithm for fitting a Lasso model.
Coordinate descent is another, general, optimization technique, which is useful in many areas of machine learning.
Reading · Slides presented in this module
Video · The feature selection task
Video · All subsets
Video · Complexity of all subsets
Video · Greedy algorithms
Video · Complexity of the greedy forward stepwise algorithm
Video · Can we use regularization for feature selection?

Video · Thresholding ridge coefficients?
Video · The lasso objective and its coefficient path
Video · Visualizing the ridge cost
Video · Visualizing the ridge solution
Video · Visualizing the lasso cost and solution
Reading · Download the notebook and follow along
Video · Lasso demo
Video · What makes the lasso objective different
Video · Coordinate descent
Video · Normalizing features
Video · Coordinate descent for least squares regression (normalized features)
Video · Coordinate descent for lasso (normalized features)
Video · Assessing convergence and other lasso solvers
Video · Coordinate descent for lasso (unnormalized features)
Video · Deriving the lasso coordinate descent update
Video · Choosing the penalty strength and other practical issues with lasso
Video · A brief recap
Quiz · Feature Selection and Lasso
Reading · Reading: Using LASSO to select features
Quiz · Using LASSO to select features
Reading · Reading: Implementing LASSO using coordinate descent
Quiz · Implementing LASSO using coordinate descent
WEEK 6
Nearest Neighbors & Kernel Regression
Up to this point, we have focused on methods that fit parametric functions---like polynomials and hyperplanes---to the entire dataset. In this module, we instead turn our attention to a class of "nonparametric" methods. These methods allow the complexity of the model to increase as more data are observed, and result in fits that adapt locally to the observations.
We start by considering the simple and intuitive example of nonparametric methods, nearest neighbor regression: The prediction for a query point is based on the outputs of the most related observations in the training set. This approach is extremely simple, but can provide excellent predictions, especially for large datasets. You will deploy algorithms to search for the nearest neighbors and form predictions based on the discovered neighbors. Building on this idea, we turn to kernel regression. Instead of forming predictions based on a small set of neighboring observations, kernel regression uses all observations in the dataset, but the impact of these observations on the predicted value is weighted by their similarity to the query point. You will analyze the theoretical performance of these methods in the limit of infinite training data, and explore the scenarios in which these methods work well versus struggle. You will also implement these techniques and observe their practical behavior.
Reading · Slides presented in this module
Video · Limitations of parametric regression
Video · 1-Nearest neighbor regression approach
Video · Distance metrics
Video · 1-Nearest neighbor algorithm
Video · k-Nearest neighbors regression
Video · k-Nearest neighbors in practice
Video · Weighted k-nearest neighbors
Video · From weighted k-NN to kernel regression
Video · Global fits of parametric models vs. local fits of kernel regression
Video · Performance of NN as amount of data grows
Video · Issues with high-dimensions, data scarcity, and computational complexity
Video · k-NN for classification
Video · A brief recap
Quiz · Nearest Neighbors & Kernel Regression
Reading · Reading: Predicting house prices using k-nearest neighbors regression
Quiz · Predicting house prices using k-nearest neighbors regression
Closing Remarks
In the conclusion of the course, we will recap what we have covered. This represents both techniques specific to regression, as well as foundational machine learning concepts that will appear throughout the specialization. We also briefly discuss some important regression techniques we did not cover in this course.
We conclude with an overview of what's in store for you in the rest of the specialization.
Reading · Slides presented in this module
Video · Simple and multiple regression
Video · Assessing performance and ridge regression
Video · Feature selection, lasso, and nearest neighbor regression
Video · What we covered and what we didn't cover
Video · What's ahead in the ML specialization
Video · Thank you!
COURSE 3: MACHINE LEARNING: CLASSIFICATION
In our case study on analyzing sentiment, you will create models that predict a class (positive/negative sentiment) from input features (text of the reviews, user profile information,...). In our second case study for this course, loan default prediction, you will tackle financial data, and predict when a loan is likely to be risky or safe for the bank. These tasks are an examples of classification, one of the most widely used areas of machine learning, with a broad array of applications, including ad targeting, spam detection, medical diagnosis and image classification. In this course, you will create classifiers that provide state-of-the-art performance on a variety of tasks. You will become familiar with the most successful techniques, which are most widely used in practice, including logistic regression, decision trees and boosting. In addition, you will be able to design and implement the underlying algorithms that can learn these models at scale, using stochastic gradient ascent. You will implement these technique on real-world, large-scale machine learning tasks. You will also address significant tasks you will face in real-world applications of ML, including handling missing data and measuring precision and recall to evaluate a classifier. This course is hands-on, action-packed, and full of visualizations and illustrations of how these techniques will behave on real data. We've also included optional content in every module, covering

advanced topics for those who want to go even deeper! Learning Objectives: By the end of this course, you will be able to: -Describe the input and output of a classification model. -Tackle both binary and multiclass classification problems. -Implement a logistic regression model for large-scale classification. -Create a non-linear model using decision trees. -Improve the performance of any model using boosting. -Scale your methods with stochastic gradient ascent. -Describe the underlying decision boundaries. -Build a classification model to predict sentiment in a product review dataset. -Analyze financial data to predict loan defaults. -Use techniques for handling missing data. -Evaluate your models using precision-recall metrics. -Implement these techniques in Python (or in the language of your choice, though Python is highly recommended).
WEEK 1
Welcome!
Classification is one of the most widely used techniques in machine learning, with a broad array of applications, including sentiment analysis, ad targeting, spam detection, risk assessment, medical diagnosis and image classification. The core goal of classification is to predict a category or class y from some inputs x. Through this course, you will become familiar with the fundamental models and algorithms used in classification, as well as a number of core machine learning concepts. Rather than covering all aspects of classification, you will focus on a few core techniques, which are widely used in the real-world to get state-of-the-art performance. By following our hands-on approach, you will implement your own algorithms on multiple real-world tasks, and deeply grasp the core techniques needed to be successful with these approaches in practice. This introduction to the course provides you with an overview of the topics we will cover and the background knowledge and resources we assume you have.
Reading · Slides presented in this module
Video · Welcome to the classification course, a part of the Machine Learning Specialization
Video · What is this course about?
Video · Impact of classification
Video · Course overview
Video · Outline of first half of course
Video · Outline of second half of course
Video · Assumed background
Video · Let's get started!
Reading · Reading: Software tools you'll need
Reading · Installing correct version of GraphLab Create

Linear Classifiers & Logistic Regression
Linear classifiers are amongst the most practical classification methods. For example, in our sentiment analysis case-study, a linear classifier associates a coefficient with the counts of each word in the sentence. In this module, you will become proficient in this type of representation. You will focus on a particularly useful type of linear classifier called logistic regression, which, in addition to allowing you to predict a class, provides a probability associated with the prediction. These probabilities are extremely useful, since they provide a degree of confidence in the predictions. In this module, you will also be able to construct features from categorical inputs, and to tackle classification problems with more than two class (multiclass problems). You will examine the results of these techniques on a real-world product sentiment analysis task.
Reading · Slides presented in this module
Video · Linear classifiers: A motivating example
Video · Intuition behind linear classifiers
Video · Decision boundaries
Video · Linear classifier model
Video · Effect of coefficient values on decision boundary
Video · Using features of the inputs
Video · Predicting class probabilities
Video · Review of basics of probabilities
Video · Review of basics of conditional probabilities
Video · Using probabilities in classification
Video · Predicting class probabilities with (generalized) linear models
Video · The sigmoid (or logistic) link function
Video · Logistic regression model
Video · Effect of coefficient values on predicted probabilities
Video · Overview of learning logistic regression models
Video · Encoding categorical inputs
Video · Multiclass classification with 1 versus all

Video · Recap of logistic regression classifier
Quiz · Linear Classifiers & Logistic Regression
Reading · Predicting sentiment from product reviews
Quiz · Predicting sentiment from product reviews
WEEK 2
Learning Linear Classifiers
Once familiar with linear classifiers and logistic regression, you can now dive in and write your first learning algorithm for classification. In particular, you will use gradient ascent to learn the coefficients of your classifier from data. You first will need to define the quality metric for these tasks using an approach called maximum likelihood estimation (MLE). You will also become familiar with a simple technique for selecting the step size for gradient ascent. An optional, advanced part of this module will cover the derivation of the gradient for logistic regression. You will implement your own learning algorithm for logistic regression from scratch, and use it to learn a sentiment analysis classifier.
Reading · Slides presented in this module
Video · Goal: Learning parameters of logistic regression
Video · Intuition behind maximum likelihood estimation
Video · Data likelihood
Video · Finding best linear classifier with gradient ascent
Video · Review of gradient ascent
Video · Learning algorithm for logistic regression
Video · Example of computing derivative for logistic regression
Video · Interpreting derivative for logistic regression
Video · Summary of gradient ascent for logistic regression
Video · Choosing step size
Video · Careful with step sizes that are too large
Video · Rule of thumb for choosing step size
Video · (VERY OPTIONAL) Deriving gradient of logistic regression: Log trick
Video · (VERY OPTIONAL) Expressing the log-likelihood
Video · (VERY OPTIONAL) Deriving probability y=-1 given x
Video · (VERY OPTIONAL) Rewriting the log likelihood into a simpler form
Video · (VERY OPTIONAL) Deriving gradient of log likelihood
Video · Recap of learning logistic regression classifiers
Quiz · Learning Linear Classifiers
Reading · Implementing logistic regression from scratch
Quiz · Implementing logistic regression from scratch
Overfitting & Regularization in Logistic Regression
As we saw in the regression course, overfitting is perhaps the most significant challenge you will face as you apply machine learning approaches in practice. This challenge can be particularly significant for logistic regression, as you will discover in this module, since we not only risk getting an overly complex decision boundary, but your classifier can also become overly confident about the probabilities it predicts. In this module, you will investigate overfitting in classification in significant detail, and obtain broad practical insights from some interesting visualizations of the classifiers' outputs. You will then add a regularization term to your optimization to mitigate overfitting. You will investigate both L2 regularization to penalize large coefficient values, and L1 regularization to obtain additional sparsity in the coefficients. Finally, you will modify your gradient ascent algorithm to learn regularized logistic regression classifiers. You will implement your own regularized logistic regression classifier from scratch, and investigate the impact of the L2 penalty on real-world sentiment analysis data.
Reading · Slides presented in this module
Video · Evaluating a classifier
Video · Review of overfitting in regression
Video · Overfitting in classification
Video · Visualizing overfitting with high-degree polynomial features
Video · Overfitting in classifiers leads to overconfident predictions
Video · Visualizing overconfident predictions
Video · (OPTIONAL) Another perspecting on overfitting in logistic regression

Video · Penalizing large coefficients to mitigate overfitting
Video · L2 regularized logistic regression
Video · Visualizing effect of L2 regularization in logistic regression
Video · Learning L2 regularized logistic regression with gradient ascent
Video · Sparse logistic regression with L1 regularization
Video · Recap of overfitting & regularization in logistic regression
Quiz · Overfitting & Regularization in Logistic Regression
Reading · Logistic Regression with L2 regularization
Quiz · Logistic Regression with L2 regularization
WEEK 3
Decision Trees
Along with linear classifiers, decision trees are amongst the most widely used classification techniques in the real world. This method is extremely intuitive, simple to implement and provides interpretable predictions. In this module, you will become familiar with the core decision trees representation. You will then design a simple, recursive greedy algorithm to learn decision trees from data. Finally, you will extend this approach to deal with continuous inputs, a fundamental requirement for practical problems. In this module, you will investigate a brand new case-study in the financial sector: predicting the risk associated with a bank loan. You will implement your own decision tree learning algorithm on real loan data.
Reading · Slides presented in this module
Video · Predicting loan defaults with decision trees
Video · Intuition behind decision trees
Video · Task of learning decision trees from data
Video · Recursive greedy algorithm
Video · Learning a decision stump
Video · Selecting best feature to split on
Video · When to stop recursing
Video · Making predictions with decision trees
Video · Multiclass classification with decision trees
Video · Threshold splits for continuous inputs
Video · (OPTIONAL) Picking the best threshold to split on
Video · Visualizing decision boundaries
Video · Recap of decision trees
Quiz · Decision Trees
Reading · Identifying safe loans with decision trees
Quiz · Identifying safe loans with decision trees
Reading · Implementing binary decision trees
Quiz · Implementing binary decision trees
WEEK 4
Preventing Overfitting in Decision Trees
Out of all machine learning techniques, decision trees are amongst the most prone to overfitting. No practical implementation is possible without including approaches that mitigate this challenge. In this module, through various visualizations and investigations, you will investigate why decision trees suffer from significant overfitting problems. Using the principle of Occam's razor, you will mitigate overfitting by learning simpler trees. At first, you will design algorithms that stop the learning process before the decision trees become overly complex. In an optional segment, you will design a very practical approach that learns an overly-complex tree, and then simplifies it with pruning. Your implementation will investigate the effect of these techniques on mitigating overfitting on our real-world loan data set.
Reading · Slides presented in this module
Video · A review of overfitting
Video · Overfitting in decision trees
Video · Principle of Occam's razor: Learning simpler decision trees
Video · Early stopping in learning decision trees
Video · (OPTIONAL) Motivating pruning
Video · (OPTIONAL) Pruning decision trees to avoid overfitting

Video · (OPTIONAL) Tree pruning algorithm
Video · Recap of overfitting and regularization in decision trees
Quiz · Preventing Overfitting in Decision Trees
Reading · Decision Trees in Practice
Quiz · Decision Trees in Practice
Handling Missing Data
Real-world machine learning problems are fraught with missing data. That is, very often, some of the inputs are not observed for all data points. This challenge is very significant, happens in most cases, and needs to be addressed carefully to obtain great performance. And, this issue is rarely discussed in machine learning courses. In this module, you will tackle the missing data challenge head on. You will start with the two most basic techniques to convert a dataset with missing data into a clean dataset, namely skipping missing values and inputing missing values. In an advanced section, you will also design a modification of the decision tree learning algorithm that builds decisions about missing data right into the model. You will also explore these techniques in your real-data implementation.
Reading · Slides presented in this module
Video · Challenge of missing data
Video · Strategy 1: Purification by skipping missing data
Video · Strategy 2: Purification by imputing missing data
Video · Modifying decision trees to handle missing data
Video · Feature split selection with missing data
Video · Recap of handling missing data
Quiz · Handling Missing Data
WEEK 5
Boosting
One of the most exciting theoretical questions that have been asked about machine learning is whether simple classifiers can be combined into a highly accurate ensemble. This question lead to the developing of boosting, one of the most important and practical techniques in machine learning today. This simple approach can boost the accuracy of any classifier, and is widely used in practice,
e.g., it's used by more than half of the teams who win the Kaggle machine learning competitions. In this module, you will first define the ensemble classifier, where multiple models vote on the best prediction. You will then explore a boosting algorithm called AdaBoost, which provides a great approach for boosting classifiers. Through visualizations, you will become familiar with many of the practical aspects of this techniques. You will create your very own implementation of AdaBoost, from scratch, and use it to boost the performance of your loan risk predictor on real data.
Reading · Slides presented in this module
Video · The boosting question
Video · Ensemble classifiers
Video · Boosting
Video · AdaBoost overview
Video · Weighted error
Video · Computing coefficient of each ensemble component
Video · Reweighing data to focus on mistakes
Video · Normalizing weights
Video · Example of AdaBoost in action
Video · Learning boosted decision stumps with AdaBoost
Reading · Exploring Ensemble Methods
Quiz · Exploring Ensemble Methods
Video · The Boosting Theorem
Video · Overfitting in boosting
Video · Ensemble methods, impact of boosting & quick recap
Quiz · Boosting
Reading · Boosting a decision stump
Quiz · Boosting a decision stump
WEEK 6
Precision-Recall
In many real-world settings, accuracy or error are not the best quality metrics for classification. You will explore a case-study that significantly highlights this issue: using sentiment analysis to display positive reviews on a restaurant website. Instead of accuracy, you will define two metrics: precision and recall, which are widely used in real-world applications to measure the quality of classifiers. You will explore how the probabilities output by your classifier can be used to trade-off precision with recall, and dive into this spectrum, using precision-recall curves. In your hands-on implementation, you will compute these metrics with your learned classifier on real-world sentiment analysis data.
Reading · Slides presented in this module
Video · Case-study where accuracy is not best metric for classification
Video · What is good performance for a classifier?
Video · Precision: Fraction of positive predictions that are actually positive
Video · Recall: Fraction of positive data predicted to be positive
Video · Precision-recall extremes
Video · Trading off precision and recall
Video · Precision-recall curve
Video · Recap of precision-recall
Quiz · Precision-Recall
Reading · Exploring precision and recall
Quiz · Exploring precision and recall
WEEK 7
Scaling to Huge Datasets & Online Learning
With the advent of the internet, the growth of social media, and the embedding of sensors in the world, the magnitudes of data that our machine learning algorithms must handle have grown tremendously over the last decade. This effect is sometimes called "Big Data". Thus, our learning algorithms must scale to bigger and bigger datasets. In this module, you will develop a small modification of gradient ascent called stochastic gradient, which provides significant speedups in the running time of our algorithms. This simple change can drastically improve scaling, but makes the algorithm less stable and harder to use in practice. In this module, you will investigate the practical techniques needed to make stochastic gradient viable, and to thus to obtain learning algorithms that scale to huge datasets. You will also address a new kind of machine learning problem, online learning, where the data streams in over time, and we must learn the coefficients as the data arrives. This task can also be solved with stochastic gradient. You will implement your very own stochastic

gradient ascent algorithm for logistic regression from scratch, and evaluate it on sentiment analysis data.
Reading · Slides presented in this module
Video · Gradient ascent won't scale to today's huge datasets
Video · Timeline of scalable machine learning & stochastic gradient
Video · Why gradient ascent won't scale
Video · Stochastic gradient: Learning one data point at a time
Video · Comparing gradient to stochastic gradient
Video · Why would stochastic gradient ever work?
Video · Convergence paths
Video · Shuffle data before running stochastic gradient
Video · Choosing step size
Video · Don't trust last coefficients
Video · (OPTIONAL) Learning from batches of data
Video · (OPTIONAL) Measuring convergence
Video · (OPTIONAL) Adding regularization
Video · The online learning task
Video · Using stochastic gradient for online learning
Video · Scaling to huge datasets through parallelization & module recap
Quiz · Scaling to Huge Datasets & Online Learning
Reading · Training Logistic Regression via Stochastic Gradient Ascent
Quiz · Training Logistic Regression via Stochastic Gradient Ascent
COURSE 4: MACHINE LEARNING: CLUSTERING & RETRIEVAL
A reader is interested in a specific news article and you want to find similar articles to recommend. What is the right notion of similarity? Moreover, what if there are millions of other documents? Each

time you want to a retrieve a new document, do you need to search through all other documents? How do you group similar documents together? How do you discover new, emerging topics that the documents cover? In this third case study, finding similar documents, you will examine similarity-based algorithms for retrieval. In this course, you will also examine structured representations for describing the documents in the corpus, including clustering and mixed membership models, such as latent Dirichlet allocation (LDA). You will implement expectation maximization (EM) to learn the document clusterings, and see how to scale the methods using MapReduce. Learning Outcomes: By the end of this course, you will be able to: -Create a document retrieval system using k-nearest neighbors. -Describe how k-nearest neighbors can also be used for regression and classification. -Identify various similarity metrics for text data. -Cluster documents by topic using k-means. -Perform mixed membership modeling using latent Dirichlet allocation (LDA). -Describe how to parallelize k-means using MapReduce. -Examine mixtures of Gaussians for density estimation. -Fit a mixture of Gaussian model using expectation maximization (EM). -Compare and contrast initialization techniques for non-convex optimization objectives. -Implement these techniques in Python.
COURSE 5: MACHINE LEARNING: RECOMMENDER SYSTEMS & DIMENSIONALITY REDUCTION
How does Amazon recommend products you might be interested in purchasing? How does Netflix decide which movies or TV shows you might want to watch? What if you are a new user, should Netflix just recommend the most popular movies? Who might you form a new link with on Facebook or LinkedIn? These questions are endemic to most service-based industries, and underlie the notion of collaborative filtering and the recommender systems deployed to solve these problems. In this fourth case study, you will explore these ideas in the context of recommending products based on customer reviews. In this course, you will explore dimensionality reduction techniques for modeling high-dimensional data. In the case of recommender systems, your data is represented as user-product relationships, with potentially millions of users and hundred of thousands of products. You will implement matrix factorization and latent factor models for the task of predicting new user-product relationships. You will also use side information about products and users to improve predictions. Learning Outcomes: By the end of this course, you will be able to: -Create a collaborative filtering system. -Reduce dimensionality of data using SVD, PCA, and random projections. -Perform matrix factorization using coordinate descent. -Deploy latent factor models as a recommender system. -Handle the cold start problem using side information. -Examine a product recommendation application. -Implement these techniques in Python.
DATA MINING SPECIALIZATION
COURSE 1: DATA VISUALIZATION
Learn the general concepts of data mining along with basic methodologies and applications. Then dive into one subfield in data mining: pattern discovery. Learn in-depth concepts, methods, and applications of pattern discovery in data mining. We will also introduce methods for pattern-based classification and some interesting applications of pattern discovery. This course provides you the opportunity to learn skills and content to practice and engage in scalable pattern discovery methods on massive transactional data, discuss pattern evaluation measures, and study methods for mining diverse kinds of patterns, sequential patterns, and sub-graph patterns.
WEEK 1
Course Orientation
You will become familiar with the course, your classmates, and our learning environment. The orientation will also help you obtain the technical skills required for the course.
Reading · Welcome to Data Visualization!
Reading · Syllabus
Reading · About the Discussion Forums
Reading · Updating Your Profile
Reading · Social Media
Reading · Resources
Quiz · Orientation Quiz
Week 1: The Computer and the Human
In this week's module, you will learn what data visualization is, how it's used, and how computers display information. You'll also explore different types of visualization and how humans perceive information.
Reading · Week 1 Overview
Video · Week 1 Introduction
Reading · Week 1 Project Milestone
Video · 1.1.1. Some Books on Data Visualization
Video · 1.1.2. Overview of Visualization
Video · 1.2.1. 2-D Graphics
Video · SVG-example
Video · 1.2.2. 2-D Drawing
Video · 1.2.3. 3-D Graphics
Video · 1.2.4. Photorealism

Video · 1.2.5. Non-Photorealism
Video · 1.3.1. The Human
Video · 1.3.2. Memory
Video · 1.3.3. Reasoning
Video · 1.3.4. The Human Retina
Video · 1.3.5. Perceiving Two Dimensions
Video · 1.3.6. Perceiving Perspective
Quiz · Week 1 Quiz
Other · Week 1 Discussion
WEEK 2
Week 2: Visualization of Numerical Data
In this week's module, you will start to think about how to visualize data effectively. This will include assigning data to appropriate chart elements, using glyphs, parallel coordinates, and streamgraphs, as well as implementing principles of design and color to make your visualizations more engaging and effective.
Reading · Week 2 Overview
Video · Week 2 Introduction
Video · 2.1.1. Data
Video · 2.1.2. Mapping
Video · 2.1.3. Charts
Video · 2.2.1. Glyphs (Part 1)
Video · 2.2.1. Glyphs (Part 2)
Video · 2.2.2. Parallel Coordinates
Video · 2.2.3. Stacked Graphs (Part 1)
Video · 2.2.3. Stacked Graphs (Part 2)
Video · 2.3.1. Tufte's Design Rules
Video · 2.3.2. Using Color
Reading · Programming Assignment 1: Visualize Data Using a Chart
Reading · Programming Assignment 1 Rubric
Peer Review · Programming Assignment 1 Submission
Other · Programming Assignment 1 Help Forum
WEEK 3
Week 3: Visualization of Non-Numerical Data
In this week's module, you will learn how to visualize graphs that depict relationships between data items. You'll also plot data using coordinates that are not specifically provided by the data set.
Reading · Week 3 Overview
Video · Week 3 Introduction
Video · 3.1.1. Graphs and Networks
Video · 3.1.2. Embedding Planar Graphs
Video · 3.1.3. Graph Visualization
Video · 3.1.4. Tree Maps
Video · 3.2.1. Principal Component Analysis
Video · 3.2.2. Multidimensional Scaling
Video · 3.3.1. Packing
Reading · Programming Assignment 2: Visualize Network Data
Reading · Programming Assignment 2 Rubric
Peer Review · Programming Assignment 2 Submission
Other · Programming Assignment 2 Help Forum
WEEK 4
Week 4: The Visualization Dashboard
In this week's module, you will start to put together everything you've learned by designing your own visualization system for large datasets and dashboards. You'll create and interpret the visualization you created from your data set, and you'll also apply techniques from user-interface design to create an effective visualization system.
Reading · Week 4 Overview
Video · Week 4 Introduction
Video · 4.1.1. Visualization Systems
Video · 4.1.2. The Information Visualization Mantra: Part 1
Video · 4.1.2. The Information Visualization Mantra: Part 2
Video · 4.1.2. The Information Visualization Mantra: Part 3
Video · 4.1.3. Database Visualization Part: 1
Video · 4.1.3. Database Visualization Part: 2
Video · 4.1.3. Database Visualization Part: 3
Video · 4.2.1. Visualization System Design
Quiz · Week 4 Quiz
COURSE 2: TEXT RETRIEVAL AND SEARCH ENGINES
Recent years have seen a dramatic growth of natural language text data, including web pages, news articles, scientific literature, emails, enterprise documents, and social media such as blog articles, forum posts, product reviews, and tweets. Text data are unique in that they are usually generated directly by humans rather than a computer system or sensors, and are thus especially valuable for discovering knowledge about people’s opinions and preferences, in addition to many other kinds of knowledge that we encode in text. This course will cover search engine technologies, which play an important role in any data mining applications involving text data for two reasons. First, while the raw data may be large for any particular problem, it is often a relatively small subset of the data that are relevant, and a search engine is an essential tool for quickly discovering a small subset of relevant text data in a large text collection. Second, search engines are needed to help analysts interpret any patterns discovered in the data by allowing them to examine the relevant original text data to make sense of any discovered pattern. You will learn the basic concepts, principles, and the major techniques in text retrieval, which is the underlying science of search engines.
COURSE 3: TEXT MINING AND ANALYTICS
This course will cover the major techniques for mining and analyzing text data to discover interesting patterns, extract useful knowledge, and support decision making, with an emphasis on statistical approaches that can be generally applied to arbitrary text data in any natural language with no or minimum human effort. Detailed analysis of text data requires understanding of natural language text, which is known to be a difficult task for computers. However, a number of statistical approaches have been shown to work well for the "shallow" but robust analysis of text data for pattern finding and knowledge discovery. You will learn the basic concepts, principles, and major algorithms in text mining and their potential applications.
COURSE 4: PATTERN DISCOVERY IN DATA MINING
Learn the general concepts of data mining along with basic methodologies and applications. Then dive into one subfield in data mining: pattern discovery. Learn in-depth concepts, methods, and applications of pattern discovery in data mining. We will also introduce methods for pattern-based classification and some interesting applications of pattern discovery. This course provides you the opportunity to learn skills and content to practice and engage in scalable pattern discovery methods on massive transactional data, discuss pattern evaluation measures, and study methods for mining diverse kinds of patterns, sequential patterns, and sub-graph patterns.
COURSE 5: CLUSTER ANALYSIS IN DATA MINING
Discover the basic concepts of cluster analysis, and then study a set of typical clustering methodologies, algorithms, and applications. This includes partitioning methods such as k-means, hierarchical methods such as BIRCH, density-based methods such as DBSCAN/OPTICS, probabilistic models, and the EM algorithm. Learn clustering and methods for clustering high dimensional data, streaming data, graph data, and networked data. Explore concepts and methods for constraint-based clustering and semi-supervised clustering. Finally, see examples of cluster analysis in applications.
DATA SCIENCE SPECIALIZATION
COURSE 1: THE DATA SCIENTIST’S TOOLBOX
In this course you will get an introduction to the main tools and ideas in the data scientist's toolbox. The course gives an overview of the data, questions, and tools that data analysts and data scientists work with. There are two components to this course. The first is a conceptual introduction to the ideas behind turning data into actionable knowledge. The second is a practical introduction to the tools that will be used in the program like version control, markdown, git, GitHub, R, and RStudio.
WEEK 1
Week 1
During Week 1, you'll learn about the goals and objectives of the Data Science Specialization and each of its components. You'll also get an overview of the field as well as instructions on how to install R.
Reading · Welcome to the Data Scientist's Toolbox
Reading · Pre-Course Survey
Reading · Syllabus
Reading · Specialization Textbooks
Video · Specialization Motivation
Reading · The Elements of Data Analytic Style
Video · The Data Scientist's Toolbox
Video · Getting Help
Video · Finding Answers
Video · R Programming Overview
Video · Getting Data Overview
Video · Exploratory Data Analysis Overview
Video · Reproducible Research Overview
Video · Statistical Inference Overview
Video · Regression Models Overview
Video · Practical Machine Learning Overview
Video · Building Data Products Overview
Video · Installing R on Windows {Roger Peng}
Video · Install R on a Mac {Roger Peng}
Video · Installing Rstudio {Roger Peng}
Video · Installing Outside Software on Mac (OS X Mavericks)
Quiz · Week 1 Quiz
WEEK 2
Week 2: Installing the Toolbox
This is the most lecture-intensive week of the course. The primary goal is to get you set up with R, Rstudio, Github, and the other tools we will use throughout the Data Science Specialization and your ongoing work as a data scientist.
Video · Tips from Coursera Users - Optional Video
Video · Command Line Interface
Video · Introduction to Git
Video · Introduction to Github
Video · Creating a Github Repository
Video · Basic Git Commands
Video · Basic Markdown
Video · Installing R Packages
Video · Installing Rtools
Quiz · Week 2 Quiz
WEEK 3
Week 3: Conceptual Issues
The Week 3 lectures focus on conceptual issues behind study design and turning data into knowledge. If you have trouble or want to explore issues in more depth, please seek out answers on

the forums. They are a great resource! If you happen to be a superstar who already gets it, please take the time to help your classmates by answering their questions as well. This is one of the best ways to practice using and explaining your skills to others. These are two of the key characteristics of excellent data scientists.
Video · Types of Questions
Video · What is Data?
Video · What About Big Data?
Video · Experimental Design
Quiz · Week 3 Quiz
WEEK 4
Week 4: Course Project Submission & Evaluation
In Week 4, we'll focus on the Course Project. This is your opportunity to install the tools and set up the accounts that you'll need for the rest of the specialization and for work in data science.
Peer Review · Course Project
Reading · Post-Course Survey
COURSE 2: R PROGRAMMING
In this course you will learn how to program in R and how to use R for effective data analysis. You will learn how to install and configure software necessary for a statistical programming environment and describe generic programming language concepts as they are implemented in a high-level statistical language. The course covers practical issues in statistical computing which includes programming in R, reading data into R, accessing R packages, writing R functions, debugging, profiling R code, and organizing and commenting R code. Topics in statistical data analysis will provide working examples.
WEEK 1
Week 1: Background, Getting Started, and Nuts & Bolts
This week covers the basics to get you started up with R. The Background Materials lesson contains information about course mechanics and some videos on installing R. The Week 1 videos cover the history of R and S, go over the basic data types in R, and describe the functions for reading and
writing data. I recommend that you watch the videos in the listed order, but watching the videos out of order isn't going to ruin the story.
Reading · Welcome to R Programming
Reading · About the Instructor
Reading · Pre-Course Survey
Reading · Syllabus
Reading · Course Textbook
Reading · Course Supplement: The Art of Data Science
Reading · Data Science Podcast: Not So Standard Deviations
Video · Installing R on a Mac
Video · Installing R on Windows
Video · Installing R Studio (Mac)
Video · Writing Code / Setting Your Working Directory (Windows)
Video · Writing Code / Setting Your Working Directory (Mac)
Reading · Getting Started and R Nuts and Bolts
Video · Introduction
Video · Overview and History of R
Video · Getting Help
Video · R Console Input and Evaluation
Video · Data Types - R Objects and Attributes
Video · Data Types - Vectors and Lists
Video · Data Types - Matrices
Video · Data Types - Factors
Video · Data Types - Missing Values
Video · Data Types - Data Frames
Video · Data Types - Names Attribute

Video · Data Types - Summary
Video · Reading Tabular Data
Video · Reading Large Tables
Video · Textual Data Formats
Video · Connections: Interfaces to the Outside World
Video · Subsetting - Basics
Video · Subsetting - Lists
Video · Subsetting - Matrices
Video · Subsetting - Partial Matching
Video · Subsetting - Removing Missing Values
Video · Vectorized Operations
Quiz · Week 1 Quiz
Video · Introduction to swirl
Reading · Practical R Exercises in swirl Part 1
Practice Programming Assignment · swirl Lesson 1: Basic Building Blocks
Practice Programming Assignment · swirl Lesson 2: Workspace and Files
Practice Programming Assignment · swirl Lesson 3: Sequences of Numbers
Practice Programming Assignment · swirl Lesson 4: Vectors
Practice Programming Assignment · swirl Lesson 5: Missing Values
Practice Programming Assignment · swirl Lesson 6: Subsetting Vectors
Practice Programming Assignment · swirl Lesson 7: Matrices and Data Frames
WEEK 2
Week 2: Programming with R
Welcome to Week 2 of R Programming. This week, we take the gloves off, and the lectures cover key topics like control structures and functions. We also introduce the first programming assignment for the course, which is due at the end of the week.

Reading · Week 2: Programming with R
Video · Control Structures - Introduction
Video · Control Structures - If-else
Video · Control Structures - For loops
Video · Control Structures - While loops
Video · Control Structures - Repeat, Next, Break
Video · Your First R Function
Video · Functions (part 1)
Video · Functions (part 2)
Video · Scoping Rules - Symbol Binding
Video · Scoping Rules - R Scoping Rules
Video · Scoping Rules - Optimization Example (OPTIONAL)
Video · Coding Standards
Video · Dates and Times
Reading · Practical R Exercises in swirl Part 2
Practice Programming Assignment · swirl Lesson 1: Logic
Practice Programming Assignment · swirl Lesson 2: Functions
Practice Programming Assignment · swirl Lesson 3: Dates and Times
Quiz · Week 2 Quiz
Reading · Programming Assignment 1 INSTRUCTIONS: Air Pollution
Quiz · Programming Assignment 1: Quiz
WEEK 3
Week 3: Loop Functions and Debugging
We have now entered the third week of R Programming, which also marks the halfway point. The lectures this week cover loop functions and the debugging tools in R. These aspects of R make R useful for both interactive work and writing longer code, and so they are commonly used in practice.

Reading · Week 3: Loop Functions and Debugging
Video · Loop Functions - lapply
Video · Loop Functions - apply
Video · Loop Functions - mapply
Video · Loop Functions - tapply
Video · Loop Functions - split
Video · Debugging Tools - Diagnosing the Problem
Video · Debugging Tools - Basic Tools
Video · Debugging Tools - Using the Tools
Reading · Practical R Exercises in swirl Part 3
Practice Programming Assignment · swirl Lesson 1: lapply and sapply
Practice Programming Assignment · swirl Lesson 2: vapply and tapply
Quiz · Week 3 Quiz
Peer Review · Programming Assignment 2: Lexical Scoping
WEEK 4
Week 4: Simulation & Profiling
This week covers how to simulate data in R, which serves as the basis for doing simulation studies. We also cover the profiler in R which lets you collect detailed information on how your R functions are running and to identify bottlenecks that can be addressed. The profiler is a key tool in helping you optimize your programs. Finally, we cover the str function, which I personally believe is the most useful function in R.
Reading · Week 4: Simulation & Profiling
Video · The str Function
Video · Simulation - Generating Random Numbers
Video · Simulation - Simulating a Linear Model
Video · Simulation - Random Sampling
Video · R Profiler (part 1)
Video · R Profiler (part 2)
Quiz · Week 4 Quiz
Reading · Practical R Exercises in swirl Part 4
Practice Programming Assignment · swirl Lesson 1: Looking at Data
Practice Programming Assignment · swrl Lesson 2: Simulation
Practice Programming Assignment · swirl Lesson 3: Base Graphics
Reading · Programming Assignment 3 INSTRUCTIONS: Hospital Quality
Quiz · Programming Assignment 3: Quiz
Reading · Post-Course Survey
COURSE 3: GETTING AND CLEANING DATA
Before you can work with data you have to get some. This course will cover the basic ways that data can be obtained. The course will cover obtaining data from the web, from APIs, from databases and from colleagues in various formats. It will also cover the basics of data cleaning and how to make data “tidy”. Tidy data dramatically speed downstream data analysis tasks. The course will also cover the components of a complete data set including raw data, processing instructions, codebooks, and processed data. The course will cover the basics needed for collecting, cleaning, and sharing data.
WEEK 1
Week 1
In this first week of the course, we look at finding data and reading different file types.
Reading · Welcome to Week 1
Reading · Syllabus
Reading · Pre-Course Survey
Video · Obtaining Data Motivation
Video · Raw and Processed Data
Video · Components of Tidy Data
Video · Downloading Files
Video · Reading Local Files
Video · Reading Excel Files
Video · Reading XML
Video · Reading JSON
Video · The data.table Package
Reading · Practical R Exercises in swirl Part 1
Quiz · Week 1 Quiz
WEEK 2
Week 2
Welcome to Week 2 of Getting and Cleaning Data! The primary goal is to introduce you to the most common data storage systems and the appropriate tools to extract data from web or from databases like MySQL.
Video · Reading from MySQL
Video · Reading from HDF5
Video · Reading from The Web
Video · Reading From APIs
Video · Reading From Other Sources
Quiz · Week 2 Quiz
WEEK 3
Week 3
Welcome to Week 3 of Getting and Cleaning Data! This week the lectures will focus on organizing, merging and managing the data you have collected using the lectures from Weeks 1 and 2.
Video · Subsetting and Sorting
Video · Summarizing Data
Video · Creating New Variables
Video · Reshaping Data
Video · Managing Data Frames with dplyr - Introduction
Video · Managing Data Frames with dplyr - Basic Tools
Video · Merging Data
Reading · Practical R Exercises in swirl Part 2
Practice Programming Assignment · swirl Lesson 1: Manipulating Data with dplyr
Practice Programming Assignment · swirl Lesson 2: Grouping and Chaining with dplyr
Practice Programming Assignment · swirl Lesson 3: Tidying Data with tidyr
Quiz · Week 3 Quiz
WEEK 4
Week 4
Welcome to Week 4 of Getting and Cleaning Data! This week we finish up with lectures on text and date manipulation in R. In this final week we will also focus on peer grading of Course Projects.
Video · Editing Text Variables
Video · Regular Expressions I
Video · Regular Expressions II
Video · Working with Dates
Video · Data Resources
Reading · Practical R Exercises in swirl Part 4
Practice Programming Assignment · swirl Lesson 1: Dates and Times with lubridate
Quiz · Week 4 Quiz
Peer Review · Getting and Cleaning Data Course Project
Reading · Post-Course Survey
COURSE 4: EXPLORATORY DATA ANALYSIS

This course covers the essential exploratory techniques for summarizing data. These techniques are typically applied before formal modeling commences and can help inform the development of more complex statistical models. Exploratory techniques are also important for eliminating or sharpening potential hypotheses about the world that can be addressed by the data. We will cover in detail the plotting systems in R as well as some of the basic principles of constructing data graphics. We will also cover some of the common multivariate statistical techniques used to visualize high-dimensional data.
WEEK 1
Week 1
This week covers the basics of analytic graphics and the base plotting system in R. We've also included some background material to help you install R if you haven't done so already.
Reading · Welcome to Exploratory Data Analysis
Reading · Syllabus
Reading · Pre-Course Survey
Video · Introduction
Reading · Exploratory Data Analysis with R Book
Reading · The Art of Data Science
Video · Installing R on Windows (3.2.1)
Video · Installing R on a Mac (3.2.1)
Video · Installing R Studio (Mac)
Video · Setting Your Working Directory (Windows)
Video · Setting Your Working Directory (Mac)
Video · Principles of Analytic Graphics
Video · Exploratory Graphs (part 1)
Video · Exploratory Graphs (part 2)
Video · Plotting Systems in R
Video · Base Plotting System (part 1)
Video · Base Plotting System (part 2)
Video · Base Plotting Demonstration

Video · Graphics Devices in R (part 1)
Video · Graphics Devices in R (part 2)
Reading · Practical R Exercises in swirl Part 1
Practice Programming Assignment · swirl Lesson 1: Principles of Analytic Graphs
Practice Programming Assignment · swirl Lesson 2: Exploratory Graphs
Practice Programming Assignment · swirl Lesson 3: Graphics Devices in R
Practice Programming Assignment · swirl Lesson 4: Plotting Systems
Practice Programming Assignment · swirl Lesson 5: Base Plotting System
Quiz · Week 1 Quiz
Peer Review · Course Project 1
COURSE 5: REPRODUCIBLE RESEARCH
This course focuses on the concepts and tools behind reporting modern data analyses in a reproducible manner. Reproducible research is the idea that data analyses, and more generally, scientific claims, are published with their data and software code so that others may verify the findings and build upon them. The need for reproducibility is increasing dramatically as data analyses become more complex, involving larger datasets and more sophisticated computations. Reproducibility allows for people to focus on the actual content of a data analysis, rather than on superficial details reported in a written summary. In addition, reproducibility makes an analysis more useful to others because the data and code that actually conducted the analysis are available. This course will focus on literate statistical analysis tools which allow one to publish data analyses in a single document that allows others to easily execute the same analysis to obtain the same results.
WEEK 1
Week 1: Concepts, Ideas, & Structure
This week will cover the basic ideas of reproducible research since they may be unfamiliar to some of you. We also cover structuring and organizing a data analysis to help make it more reproducible. I recommend that you watch the videos in the order that they are listed on the web page, but watching the videos out of order isn't going to ruin the story.
Video · Introduction
Reading · Syllabus

Reading · Pre-course survey
Reading · Course Book: Report Writing for Data Science in R
Video · What is Reproducible Research About?
Video · Reproducible Research: Concepts and Ideas (part 1)
Video · Reproducible Research: Concepts and Ideas (part 2)
Video · Reproducible Research: Concepts and Ideas (part 3)
Video · Scripting Your Analysis
Video · Structure of a Data Analysis (part 1)
Video · Structure of a Data Analysis (part 2)
Video · Organizing Your Analysis
Video · Use R version 3.1.1
Quiz · Week 1 Quiz
WEEK 2
Week 2: Markdown & knitr
This week we cover some of the core tools for developing reproducible documents. We cover the literate programming tool knitr and show how to integrate it with Markdown to publish reproducible web documents. We also introduce the first peer assessment which will require you to write up a reproducible data analysis using knitr.
Video · Coding Standards in R
Video · Markdown
Video · R Markdown
Video · R Markdown Demonstration
Video · knitr (part 1)
Video · knitr (part 2)
Video · knitr (part 3)
Video · knitr (part 4)
Quiz · Week 2 Quiz
Video · Introduction to Course Project 1
Peer Review · Course Project 1
WEEK 3
Week 3: Reproducible Research Checklist & Evidence-based Data Analysis
This week covers what one could call a basic check list for ensuring that a data analysis is reproducible. While it's not absolutely sufficient to follow the check list, it provides a necessary minimum standard that would be applicable to almost any area of analysis.
Video · Communicating Results
Video · RPubs
Video · Reproducible Research Checklist (part 1)
Video · Reproducible Research Checklist (part 2)
Video · Reproducible Research Checklist (part 3)
Video · Evidence-based Data Analysis (part 1)
Video · Evidence-based Data Analysis (part 2)
Video · Evidence-based Data Analysis (part 3)
Video · Evidence-based Data Analysis (part 4)
Video · Evidence-based Data Analysis (part 5)
WEEK 4
Week 4: Case Studies & Commentaries
This week there are two case studies involving the importance of reproducibility in science for you to watch.
Video · Caching Computations
Video · Case Study: Air Pollution
Video · Case Study: High Throughput Biology
Video · Commentaries on Data Analysis
Video · Introduction to Peer Assessment 2
Peer Review · Course Project 2
Reading · Post-Course Survey
COURSE 6: STATISTICAL INFERENCE
Statistical inference is the process of drawing conclusions about populations or scientific truths from data. There are many modes of performing inference including statistical modeling, data oriented strategies and explicit use of designs and randomization in analyses. Furthermore, there are broad theories (frequentists, Bayesian, likelihood, design based, …) and numerous complexities (missing data, observed and unobserved confounding, biases) for performing inference. A practitioner can often be left in a debilitating maze of techniques, philosophies and nuance. This course presents the fundamentals of inference in a practical approach for getting things done. After taking this course, students will understand the broad directions of statistical inference and use this information for making informed choices in analyzing data.
WEEK 1
Week 1: Probability & Expected Values
This week, we'll focus on the fundamentals including probability, random variables, expectations and more.
Video · Introductory video
Reading · Welcome to Statistical Inference
Reading · Some introductory comments
Reading · Pre-Course Survey
Reading · Syllabus
Reading · Course Book: Statistical Inference for Data Science
Reading · Data Science Specialization Community Site
Reading · Homework Problems
Reading · Probability
Video · 02 01 Introduction to probability
Video · 02 02 Probability mass functions

Video · 02 03 Probability density functions
Reading · Conditional probability
Video · 03 01 Conditional Probability
Video · 03 02 Bayes' rule
Video · 03 03 Independence
Reading · Expected values
Video · 04 01 Expected values
Video · 04 02 Expected values, simple examples
Video · 04 03 Expected values for PDFs
Reading · Practical R Exercises in swirl 1
Practice Programming Assignment · swirl Lesson 1: Introduction
Practice Programming Assignment · swirl Lesson 2: Probability1
Practice Programming Assignment · swirl Lesson 3: Probability2
Practice Programming Assignment · swirl Lesson 4: ConditionalProbability
Practice Programming Assignment · swirl Lesson 5: Expectations
Quiz · Quiz 1
WEEK 2
Week 2: Variability, Distribution, & Asymptotics
We're going to tackle variability, distributions, limits, and confidence intervals.
Reading · Variability
Video · 05 01 Introduction to variability
Video · 05 02 Variance simulation examples
Video · 05 03 Standard error of the mean
Video · 05 04 Variance data example
Reading · Distributions

Video · 06 01 Binomial distrubtion
Video · 06 02 Normal distribution
Video · 06 03 Poisson
Reading · Asymptotics
Video · 07 01 Asymptotics and LLN
Video · 07 02 Asymptotics and the CLT
Video · 07 03 Asymptotics and confidence intervals
Reading · Practical R Exercises in swirl Part 2
Practice Programming Assignment · swirl Lesson 1: Variance
Practice Programming Assignment · swirl Lesson 2: CommonDistros
Practice Programming Assignment · swirl Lesson 3: Asymptotics
Quiz · Quiz 2
WEEK 3
Week: Intervals, Testing, & Pvalues
We will be taking a look at intervals, testing, and pvalues in this lesson.
Reading · Confidence intervals
Video · 08 01 T confidence intervals
Video · 08 02 T confidence intervals example
Video · 08 03 Independent group T intervals
Video · 08 04 A note on unequal variance
Reading · Hypothesis testing
Video · 09 01 Hypothesis testing
Video · 09 02 Example of choosing a rejection region
Video · 09 03 T tests
Video · 09 04 Two group testing
Reading · P-values
Video · 10 01 Pvalues
Video · 10 02 Pvalue further examples
Reading · Knitr
Video · Just enough knitr to do the project
Reading · Practical R Exercises in swirl Part 3
Practice Programming Assignment · swirl Lesson 1: T Confidence Intervals
Practice Programming Assignment · swirl Lesson 2: Hypothesis Testing
Practice Programming Assignment · swirl Lesson 3: P Values
Quiz · Quiz 3
WEEK 4
Week 4: Power, Bootstrapping, & Permutation Tests
We will begin looking into power, bootstrapping, and permutation tests.
Reading · Power
Video · 11 01 Power
Video · 11 02 Calculating Power
Video · 11 03 Notes on power
Video · 11 04 T test power
Video · 12 01 Multiple Comparisons
Reading · Resampling
Video · 13 01 Bootstrapping
Video · 13 02 Bootstrapping example
Video · 13 03 Notes on the bootstrap
Video · 13 04 Permutation tests
Quiz · Quiz 4
Peer Review · Statistical Inference Course Project
Reading · Practical R Exercises in swirl Part 4
Practice Programming Assignment · swirl Lesson 1: Power
Practice Programming Assignment · swirl Lesson 2: Multiple Testing
Practice Programming Assignment · swirl Lesson 3: Resampling
Reading · Post-Course Survey
COURSE 7: REGRESSION MODELS
Linear models, as their name implies, relates an outcome to a set of predictors of interest using linear assumptions. Regression models, a subset of linear models, are the most important statistical analysis tool in a data scientist’s toolkit. This course covers regression analysis, least squares and inference using regression models. Special cases of the regression model, ANOVA and ANCOVA will be covered as well. Analysis of residuals and variability will be investigated. The course will cover modern thinking on model selection and novel uses of regression models including scatterplot smoothing.
WEEK 1
Week 1: Least Squares and Linear Regression
This week, we focus on least squares and linear regression.
Reading · Welcome to Regression Models
Reading · Book: Regression Models for Data Science in R
Reading · Syllabus
Reading · Pre-Course Survey
Reading · Data Science Specialization Community Site
Reading · Where to get more advanced material
Reading · Regression
Video · Introduction to Regression
Video · Introduction: Basic Least Squares

Reading · Technical details
Video · Technical Details (Skip if you'd like)
Video · Introductory Data Example
Reading · Least squares
Video · Notation and Background
Video · Linear Least Squares
Video · Linear Least Squares Coding Example
Video · Technical Details (Skip if you'd like)
Reading · Regression to the mean
Video · Regression to the Mean
Reading · Practical R Exercises in swirl Part 1
Practice Programming Assignment · swirl Lesson 1: Introduction
Practice Programming Assignment · swirl Lesson 2: Residuals
Practice Programming Assignment · swirl Lesson 3: Least Squares Estimation
Quiz · Quiz 1
WEEK 2
Week 2: Linear Regression & Multivariable Regression
This week, we will work through the remainder of linear regression and then turn to the first part of multivariable regression.
Reading · *Statistical* linear regression models
Video · Statistical Linear Regression Models
Video · Interpreting Coefficients
Video · Linear Regression for Prediction
Reading · Residuals
Video · Residuals
Video · Residuals, Coding Example
Video · Residual Variance
Reading · Inference in regression
Video · Inference in Regression
Video · Coding Example
Video · Prediction
Reading · Looking ahead to the project
Video · Really, really quick intro to knitr
Reading · Practical R Exercises in swirl Part 2
Practice Programming Assignment · swirl Lesson 1: Residual Variation
Practice Programming Assignment · swirl Lesson 2: Introduction to Multivariable Regression
Practice Programming Assignment · swirl Lesson 3: MultiVar Examples
Quiz · Quiz 2
WEEK 3
Week 3: Multivariable Regression, Residuals, & Diagnostics
This week, we'll build on last week's introduction to multivariable regression with some examples and then cover residuals, diagnostics, variance inflation, and model comparison.
Reading · Multivariable regression
Video · Multivariable Regression part I
Video · Multivariable Regression part II
Video · Multivariable Regression Continued
Video · Multivariable Regression Examples part I
Video · Multivariable Regression Examples part II
Video · Multivariable Regression Examples part III
Video · Multivariable Regression Examples part IV
Reading · Adjustment
Video · Adjustment Examples
Reading · Residuals
Video · Residuals and Diagnostics part I
Video · Residuals and Diagnostics part II
Video · Residuals and Diagnostics part III
Reading · Model selection
Video · Model Selection part I
Video · Model Selection part II
Video · Model Selection part III
Reading · Practical R Exercises in swirl Part 3
Practice Programming Assignment · swirl Lesson 1: MultiVar Examples2
Practice Programming Assignment · swirl Lesson 2: MultiVar Examples3
Practice Programming Assignment · swirl Lesson 3: Residuals Diagnostics and Variation
Quiz · Quiz 3
WEEK 4
Week 4: Logistic Regression and Poisson Regression
This week, we will work on generalized linear models, including binary outcomes and Poisson regression.
Reading · GLMs
Video · GLMs
Reading · Logistic regression
Video · Logistic Regression part I
Video · Logistic Regression part II
Video · Logistic Regression part III

Reading · Count Data
Video · Poisson Regression part I
Video · Poisson Regression part II
Reading · Mishmash
Video · Hodgepodge
Reading · Practical R Exercises in swirl Part 4
Practice Programming Assignment · swirl Lesson 1: Variance Inflation Factors
Practice Programming Assignment · swirl Lesson 2: Overfitting and Underfitting
Practice Programming Assignment · swirl Lesson 3: Binary Outcomes
Practice Programming Assignment · swirl Lesson 4: Count Outcomes
Quiz · Quiz 4
Peer Review · Regression Models Course Project
Reading · Post-Course Survey
COURSE 8: PRACTICAL MACHINE LEARNING
One of the most common tasks performed by data scientists and data analysts are prediction and machine learning. This course will cover the basic components of building and applying prediction functions with an emphasis on practical applications. The course will provide basic grounding in concepts such as training and tests sets, overfitting, and error rates. The course will also introduce a range of model based and algorithmic machine learning methods including regression, classification trees, Naive Bayes, and random forests. The course will cover the complete process of building prediction functions including data collection, feature creation, algorithms, and evaluation. WEEK 1
Week 1: Prediction, Errors, and Cross Validation This week will cover prediction, relative importance of steps, errors, and cross validation.
Reading · Welcome to Practical Machine Learning
Reading · Syllabus
Reading · Pre-Course Survey
Video · Prediction motivation
Video · What is prediction?
Video · Relative importance of steps
Video · In and out of sample errors
Video · Prediction study design
Video · Types of errors
Video · Receiver Operating Characteristic
Video · Cross validation
Video · What data should you use?
Quiz · Quiz 1
WEEK 2
Week 2: The Caret Package
This week will introduce the caret package, tools for creating features and preprocessing.
Video · Caret package
Video · Data slicing
Video · Training options
Video · Plotting predictors
Video · Basic preprocessing
Video · Covariate creation
Video · Preprocessing with principal components analysis
Video · Predicting with Regression
Video · Predicting with Regression Multiple Covariates
Quiz · Quiz 2
WEEK 3
Week 3: Predicting with trees, Random Forests, & Model Based Predictions
This week we introduce a number of machine learning algorithms you can use to complete your course project.
Video · Predicting with trees
Video · Bagging
Video · Random Forests
Video · Boosting
Video · Model Based Prediction
Quiz · Quiz 3
WEEK 4
Week 4: Regularized Regression and Combining Predictors
This week, we will cover regularized regression and combining predictors.
Video · Regularized regression
Video · Combining predictors
Video · Forecasting
Video · Unsupervised Prediction
Quiz · Quiz 4
Reading · Course Project Instructions (READ FIRST)
Peer Review · Prediction Assignment Writeup
Quiz · Course Project Prediction Quiz
Reading · Post-Course Survey

ALGORITHMS SPECIALIZATION
COURSE 1: ALGORITHMIC TOOLBOX
The course covers basic algorithmic techniques and ideas for computational problems arising frequently in practical applications: sorting and searching, divide and conquer, greedy algorithms, dynamic programming. We will learn a lot of theory: how to sort data and how it helps for searching; how to break a large problem into pieces and solve them recursively; when it makes sense to proceed greedily; how dynamic programming is used in genomic studies. You will practice solving computational problems, designing new algorithms, and implementing solutions efficiently (so that they run in less than a second).
WEEK 1
Welcome
Welcome to the first module of Data Structures and Algorithms! Here we will provide an overview of where algorithms and data structures are used (hint: everywhere) and walk you through a few sample programming challenges. The programming challenges represent an important (and often the most difficult!) part of this specialization because the only way to fully understand an algorithm is to implement it. Writing correct and efficient programs is hard; please don’t be surprised if they don’t work as you planned—our first programs did not work either! And we will be helping you to make your journey through the specialization by showing how to implement your first programming challenges. We will also introduce testing techniques that will help to increase your chances of passing the assignments from the first attempt. In case your program does not work as intended, we will show how to fix it, even if you don’t yet know what test your implementation currently fails on.
Video · Welcome!
Reading · Overview
Reading · Available Programming Languages
Programming Assignment · A plus B
Video · Solving the Problem (screencast)
Reading · What's Up Next?
Practice Quiz · Solving Programming Assignments
Programming Assignment · Maximum Pairwise Product
Reading · Solving the Problem: Improving the Naive Solution, Testing, Debugging
Video · Solving the Problem: Improving the Naive Solution, Testing, Debugging
Reading · Stress Testing: the [Almost] Silver Bullet for Debugging
Video · Stress Test - Implementation
Video · Stress Test - Find the Test and Debug
Video · Stress Test - More Testing, Submit and Pass!
Reading · FAQ on Programming Assignments
Practice Quiz · Solving Programming Assignments
Reading · Acknowledgements
WEEK 2
Introduction
In this module you will learn that programs based on efficient algorithms can solve the same problem billions of times faster than programs based on naïve algorithms. You will learn how to estimate the running time and memory of an algorithm without even implementing it. Armed with this knowledge, you will be able to compare various algorithms, select the most efficient ones, and finally implement them as our programming challenges!
Video · Why Study Algorithms?
Video · Coming Up
Video · Problem Overview
Video · Naive Algorithm
Video · Efficient Algorithm
Reading · Resources
Video · Problem Overview and Naive Algorithm
Video · Efficient Algorithm
Reading · Resources
Video · Computing Runtimes
Video · Asymptotic Notation
Video · Big-O Notation
Video · Using Big-O
Reading · Resources
Quiz · Logarithms
Quiz · Big-O
Quiz · Growth rate
Video · Course Overview
Programming Assignment · Programming Assignment 1: Introduction
WEEK 3
Greedy Algorithms
In this module you will learn about seemingly naïve yet powerful class of algorithms called greedy algorithms. After you will learn the key idea behind the greedy algorithms, you may feel that they represent the algorithmic Swiss army knife that can be applied to solve nearly all programming challenges in this course. But be warned: with a few exceptions that we will cover, this intuitive idea rarely works in practice! For this reason, it is important to prove that a greedy algorithm always produces an optimal solution before using this algorithm. In the end of this module, we will test your intuition and taste for greedy algorithms by offering several programming challenges.
Video · Largest Number
Video · Car Fueling
Video · Car Fueling - Implementation and Analysis
Video · Main Ingredients of Greedy Algorithms
Quiz · Greedy Algorithms
Video · Celebration Party Problem
Video · Efficient Algorithm for Grouping Children
Video · Analysis and Implementation of the Efficient Algorithm
Video · Long Hike
Video · Fractional Knapsack - Implementation, Analysis and Optimization
Video · Review of Greedy Algorithms

Reading · Resources
Quiz · Fractional Knapsack
Programming Assignment · Programming Assignment 2: Greedy Algorithms
WEEK 4
Divide-and-Conquer
In this module you will learn about a powerful algorithmic technique called Divide and Conquer. Based on this technique, you will see how to search huge databases millions of times faster than using naïve linear search. You will even learn that the standard way to multiply numbers (that you learned in the grade school) is far from the being the fastest! We will then apply the divide-and-conquer technique to design two efficient algorithms (merge sort and quick sort) for sorting huge lists, a problem that finds many applications in practice. Finally, we will show that these two algorithms are optimal, that is, no algorithm can sort faster!
Video · Intro
Video · Linear Search
Video · Binary Search
Video · Binary Search Runtime
Reading · Resources
Quiz · Linear Search and Binary Search
Video · Problem Overview and Naïve Solution
Video · Naïve Divide and Conquer Algorithm
Video · Faster Divide and Conquer Algorithm
Reading · Resources
Quiz · Polynomial Multiplication
Video · What is the Master Theorem?
Video · Proof of the Master Theorem
Reading · Resources
Quiz · Master Theorem
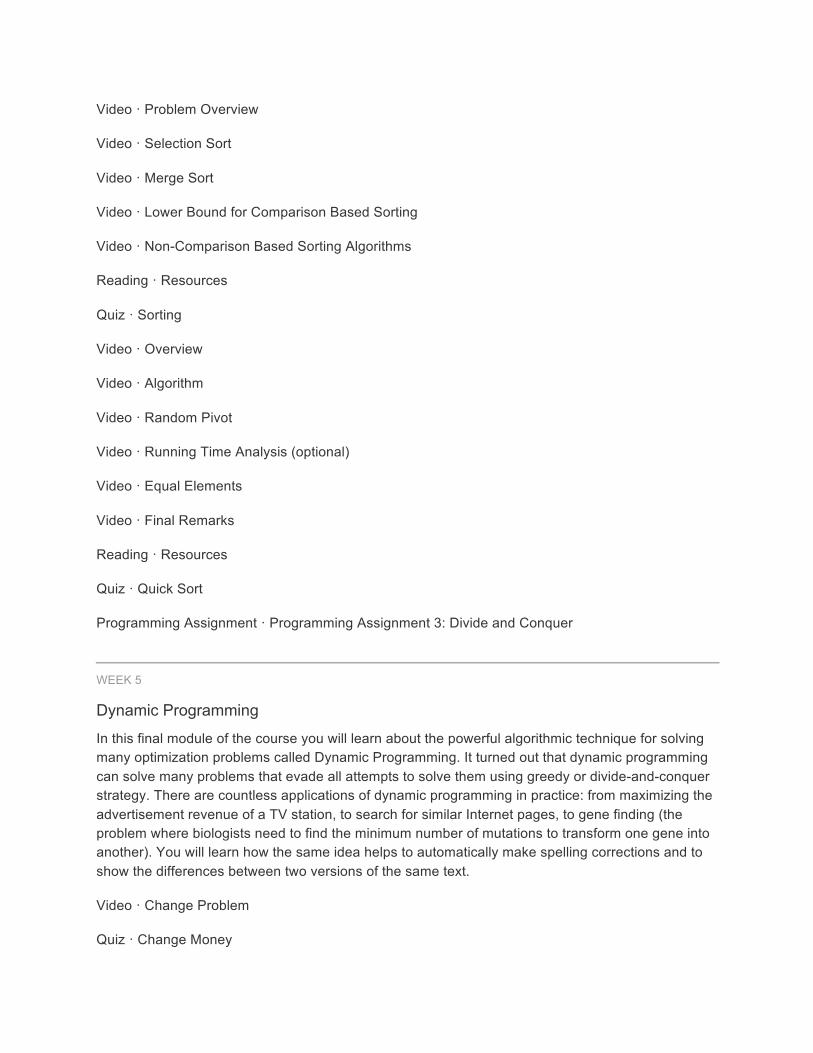
Video · Problem Overview
Video · Selection Sort
Video · Merge Sort
Video · Lower Bound for Comparison Based Sorting
Video · Non-Comparison Based Sorting Algorithms
Reading · Resources
Quiz · Sorting
Video · Overview
Video · Algorithm
Video · Random Pivot
Video · Running Time Analysis (optional)
Video · Equal Elements
Video · Final Remarks
Reading · Resources
Quiz · Quick Sort
Programming Assignment · Programming Assignment 3: Divide and Conquer
WEEK 5
Dynamic Programming
In this final module of the course you will learn about the powerful algorithmic technique for solving many optimization problems called Dynamic Programming. It turned out that dynamic programming can solve many problems that evade all attempts to solve them using greedy or divide-and-conquer strategy. There are countless applications of dynamic programming in practice: from maximizing the advertisement revenue of a TV station, to search for similar Internet pages, to gene finding (the problem where biologists need to find the minimum number of mutations to transform one gene into another). You will learn how the same idea helps to automatically make spelling corrections and to show the differences between two versions of the same text.
Video · Change Problem
Quiz · Change Money
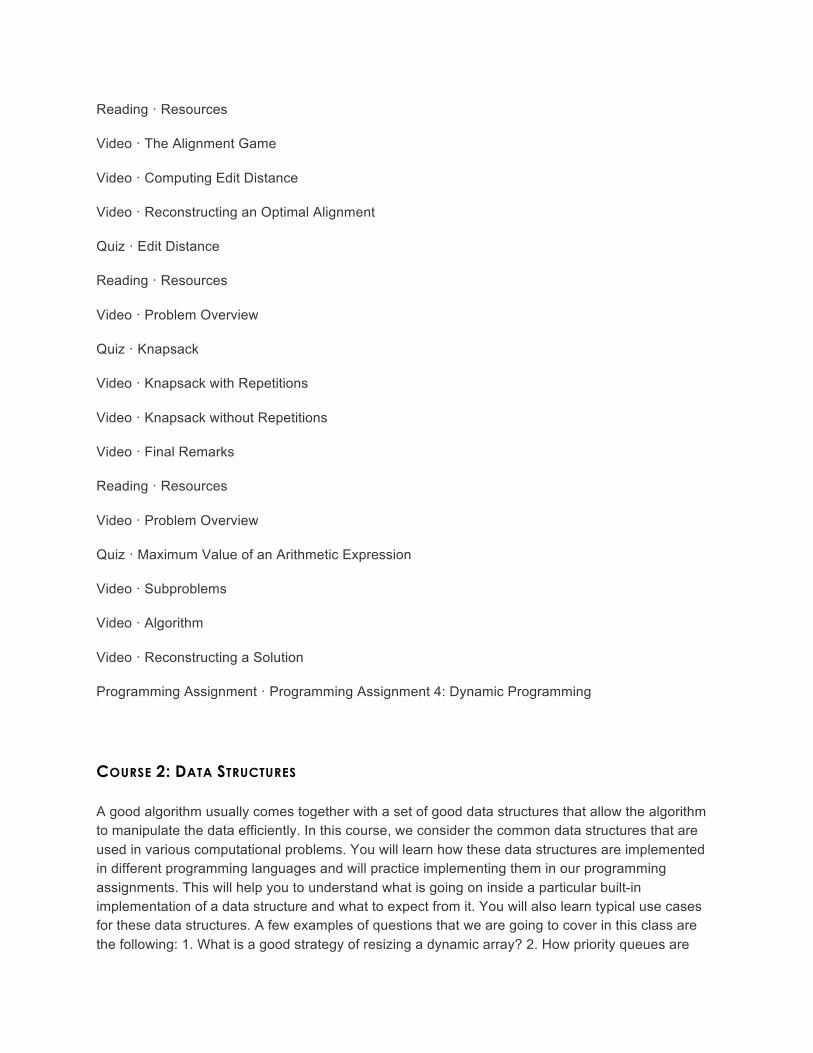
Reading · Resources
Video · The Alignment Game
Video · Computing Edit Distance
Video · Reconstructing an Optimal Alignment
Quiz · Edit Distance
Reading · Resources
Video · Problem Overview
Quiz · Knapsack
Video · Knapsack with Repetitions
Video · Knapsack without Repetitions
Video · Final Remarks
Reading · Resources
Video · Problem Overview
Quiz · Maximum Value of an Arithmetic Expression
Video · Subproblems
Video · Algorithm
Video · Reconstructing a Solution
Programming Assignment · Programming Assignment 4: Dynamic Programming
COURSE 2: DATA STRUCTURES
A good algorithm usually comes together with a set of good data structures that allow the algorithm to manipulate the data efficiently. In this course, we consider the common data structures that are used in various computational problems. You will learn how these data structures are implemented in different programming languages and will practice implementing them in our programming assignments. This will help you to understand what is going on inside a particular built-in implementation of a data structure and what to expect from it. You will also learn typical use cases for these data structures. A few examples of questions that we are going to cover in this class are the following: 1. What is a good strategy of resizing a dynamic array? 2. How priority queues are
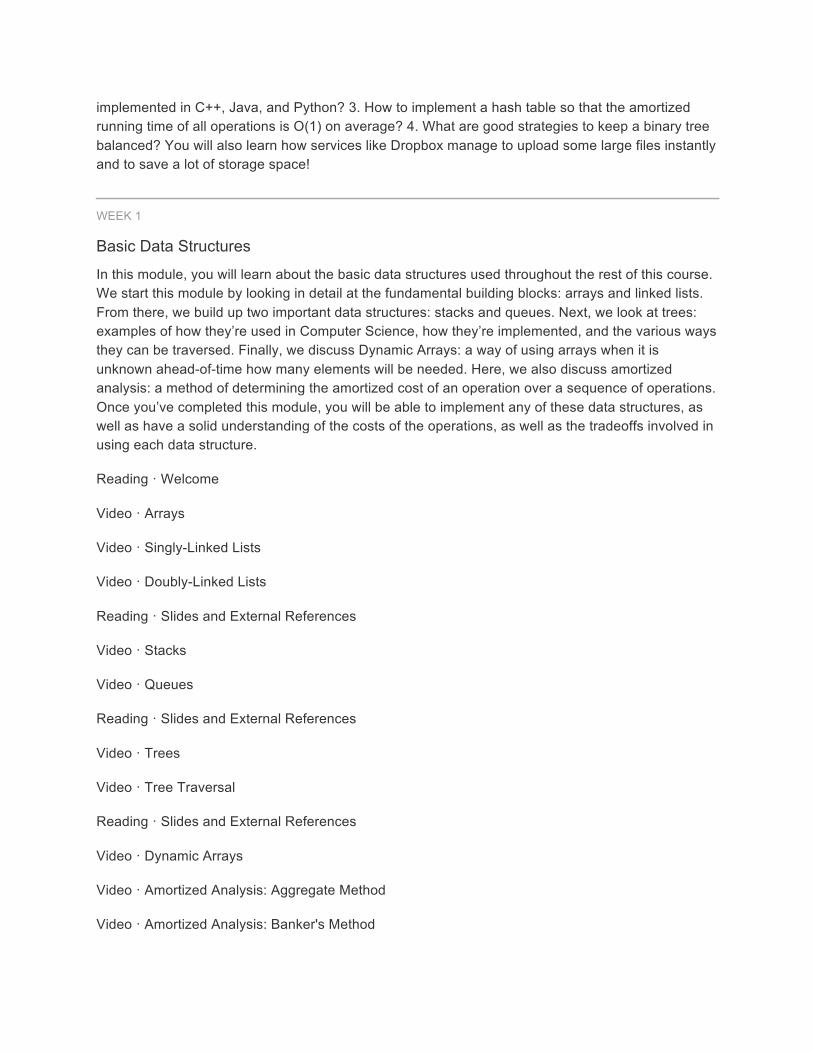
implemented in C++, Java, and Python? 3. How to implement a hash table so that the amortized running time of all operations is O(1) on average? 4. What are good strategies to keep a binary tree balanced? You will also learn how services like Dropbox manage to upload some large files instantly and to save a lot of storage space!
WEEK 1
Basic Data Structures
In this module, you will learn about the basic data structures used throughout the rest of this course. We start this module by looking in detail at the fundamental building blocks: arrays and linked lists. From there, we build up two important data structures: stacks and queues. Next, we look at trees: examples of how they’re used in Computer Science, how they’re implemented, and the various ways they can be traversed. Finally, we discuss Dynamic Arrays: a way of using arrays when it is unknown ahead-of-time how many elements will be needed. Here, we also discuss amortized analysis: a method of determining the amortized cost of an operation over a sequence of operations. Once you’ve completed this module, you will be able to implement any of these data structures, as well as have a solid understanding of the costs of the operations, as well as the tradeoffs involved in using each data structure.
Reading · Welcome
Video · Arrays
Video · Singly-Linked Lists
Video · Doubly-Linked Lists
Reading · Slides and External References
Video · Stacks
Video · Queues
Reading · Slides and External References
Video · Trees
Video · Tree Traversal
Reading · Slides and External References
Video · Dynamic Arrays
Video · Amortized Analysis: Aggregate Method
Video · Amortized Analysis: Banker's Method
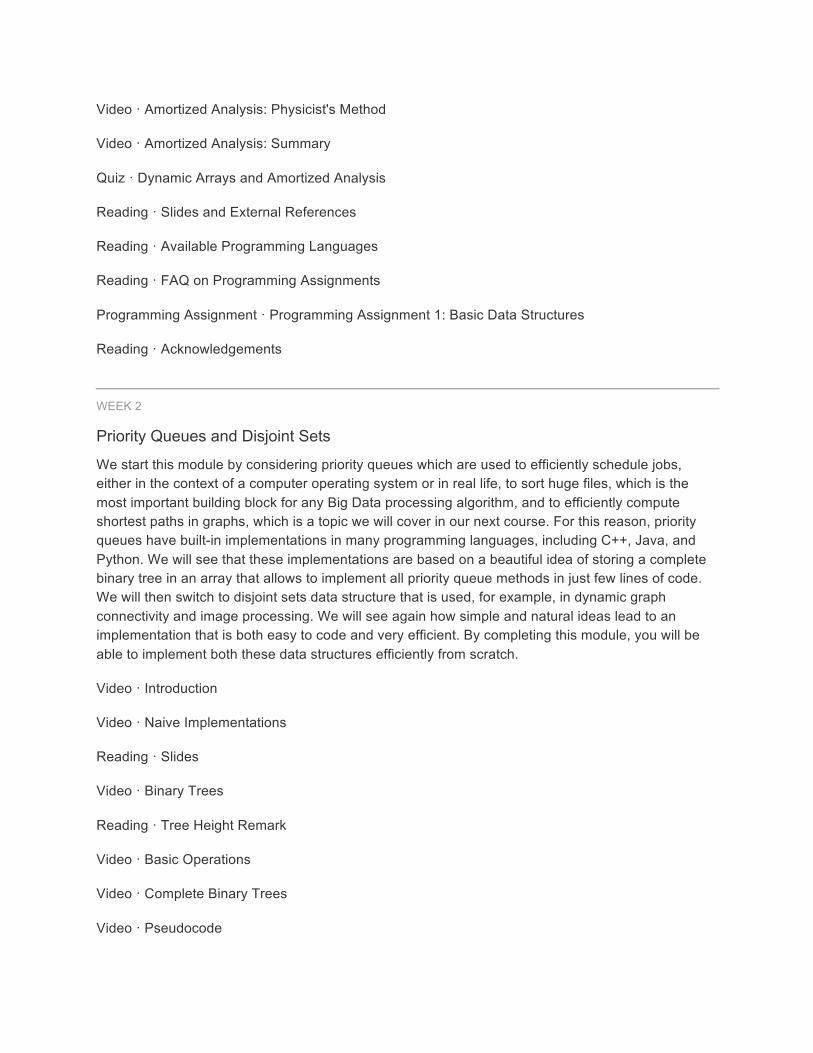
Video · Amortized Analysis: Physicist's Method
Video · Amortized Analysis: Summary
Quiz · Dynamic Arrays and Amortized Analysis
Reading · Slides and External References
Reading · Available Programming Languages
Reading · FAQ on Programming Assignments
Programming Assignment · Programming Assignment 1: Basic Data Structures
Reading · Acknowledgements
WEEK 2
Priority Queues and Disjoint Sets
We start this module by considering priority queues which are used to efficiently schedule jobs, either in the context of a computer operating system or in real life, to sort huge files, which is the most important building block for any Big Data processing algorithm, and to efficiently compute shortest paths in graphs, which is a topic we will cover in our next course. For this reason, priority queues have built-in implementations in many programming languages, including C++, Java, and Python. We will see that these implementations are based on a beautiful idea of storing a complete binary tree in an array that allows to implement all priority queue methods in just few lines of code. We will then switch to disjoint sets data structure that is used, for example, in dynamic graph connectivity and image processing. We will see again how simple and natural ideas lead to an implementation that is both easy to code and very efficient. By completing this module, you will be able to implement both these data structures efficiently from scratch.
Video · Introduction
Video · Naive Implementations
Reading · Slides
Video · Binary Trees
Reading · Tree Height Remark
Video · Basic Operations
Video · Complete Binary Trees
Video · Pseudocode

Reading · Slides and External References
Video · Heap Sort
Video · Building a Heap
Video · Final Remarks
Quiz · Priority Queues: Quiz
Reading · Slides and External References
Video · Overview
Video · Naive Implementations
Reading · Slides and External References
Video · Trees
Video · Union by Rank
Video · Path Compression
Video · Analysis (Optional)
Quiz · Quiz: Disjoint Sets
Reading · Slides and External References
Programming Assignment · Programming Assignment 2: Priority Queues and Disjoint Sets
WEEK 3
Hash Tables
In this module you will learn about very powerful and widely used technique called hashing. Its applications include implementation of programming languages, file systems, pattern search, distributed key-value storage and many more. You will learn how to implement data structures to store and modify sets of objects and mappings from one type of objects to another one. You will see that naive implementations either consume huge amount of memory or are slow, and then you will learn to implement hash tables that use linear memory and work in O(1) on average! In the end, you will learn how hash functions are used in modern distibuted systems and how they are used to optimize storage of services like Dropbox, Google Drive and Yandex Disk!
Video · Applications of Hashing
Video · Analysing Service Access Logs

Video · Direct Addressing
Video · List-based Mapping
Video · Hash Functions
Video · Chaining Scheme
Video · Chaining Implementation and Analysis
Video · Hash Tables
Reading · Slides and External References
Video · Phone Book Problem
Video · Phone Book Problem - Continued
Video · Universal Family
Video · Hashing Integers
Video · Proof: Upper Bound for Chain Length (Optional)
Video · Proof: Universal Family for Integers (Optional)
Video · Hashing Strings
Video · Hashing Strings - Cardinality Fix
Reading · Slides and External References
Quiz · Hash Tables and Hash Functions
Video · Search Pattern in Text
Video · Rabin-Karp's Algorithm
Video · Optimization: Precomputation
Video · Optimization: Implementation and Analysis
Reading · Slides and External References
Video · Instant Uploads and Storage Optimization in Dropbox
Video · Distributed Hash Tables
Reading · Slides and External References

Programming Assignment · Programming Assignment 3: Hash Tables
WEEK 4
Binary Search Trees
In this module we study binary search trees, which are a data structure for doing searches on dynamically changing ordered sets. You will learn about many of the difficulties in accomplishing this task and the ways in which we can overcome them. In order to do this you will need to learn the basic structure of binary search trees, how to insert and delete without destroying this structure, and how to ensure that the tree remains balanced. We will also discuss applications of this data structure for recombining ordered lists of elements.
Video · Introduction
Video · Search Trees
Video · Basic Operations
Video · Balance
Reading · Slides and External References
Video · AVL Trees
Video · AVL Tree Implementation
Video · Split and Merge
Reading · Slides and External References
Video · Applications
Reading · Slides and External References
Video · Splay Trees
Reading · Slides and External References
Programming Assignment · Programming Assignment 4: Binary Search Trees
COURSE 3: ALGORITHMS ON GRAPHS
If you have ever used a navigation service to find optimal route and estimate time to destination, you've used algorithms on graphs. Graphs arise in various real-world situations as there are road networks, computer networks and, most recently, social networks! If you're looking for the fastest
time to get to work, cheapest way to connect set of computers into a network or efficient algorithm to automatically find communities and opinion leaders in Facebook, you're going to work with graphs and algorithms on graphs. In this course, you will first learn what a graph is and what are some of the most important properties. Then you'll learn several ways to traverse graphs and how you can do useful things while traversing the graph in some order. We will then talk about shortest paths algorithms — from the basic ones to those which open door for 1000000 times faster algorithms used in Google Maps and other navigational services. You will use these algorithms if you choose to work on our Fast Shortest Routes industrial capstone project. We will finish with minimum spanning trees which are used to plan road, telephone and computer networks and also find applications in clustering and approximate algorithms.
COURSE 4: ALGORITHMS ON STRINGS
World and internet is full of textual information. We search for information using textual queries, we read websites, books, e-mails. All those are strings from the point of view of computer science. To make sense of all that information and make search efficient, search engines use many string algorithms. Moreover, the emerging field of personalized medicine uses many search algorithms to find disease-causing mutations in the human genome.
COUSE 5: ADVANCED ALGORITHMS AND COMPLEXITY
You've learned the basic algorithms now and are ready to step into the area of more complex problems and algorithms to solve them. Advanced algorithms build upon basic ones and use new ideas. We will start with networks flows which are used in more obvious applications such as optimal matchings, finding disjoint paths and flight scheduling as well as more surprising ones like image segmentation in computer vision or finding dense clusters in the advertiser-search query graphs at search engines. We then proceed to linear programming with applications in optimizing budget allocation, portfolio optimization, finding the cheapest diet satisfying all requirements, call routing in telecommunications and many others. Next we discuss inherently hard problems for which no exact good solutions are known (and not likely to be found) and how to solve them approximately in a reasonable time. We finish with some applications to Big Data and Machine Learning which are heavy on algorithms right now.

CIS 611 SELECTED COURSE MATERIALS DATABASE NORMALIZATION
INDEXES
FUNCTIONAL DEPENDENCY
STORAGE AND FILE SYSTEM

EDX ONLINE COURSES COURSE 1: INTRODUCTION TO DATA STORAGE AND MANAGEMENT TECHNOLOGIES
This course was text and video based, with no real project. With that in mind, I did complete and
pass all the assessments. This course was taught by the IEEE.
In this course, I covered and learned the following topics.
Week 1: Data Storage Fundamentals
Section 1: Enterprise IT Environment – Enterprise IT infrastructure components, direct attached
storage, networked storage, and data center
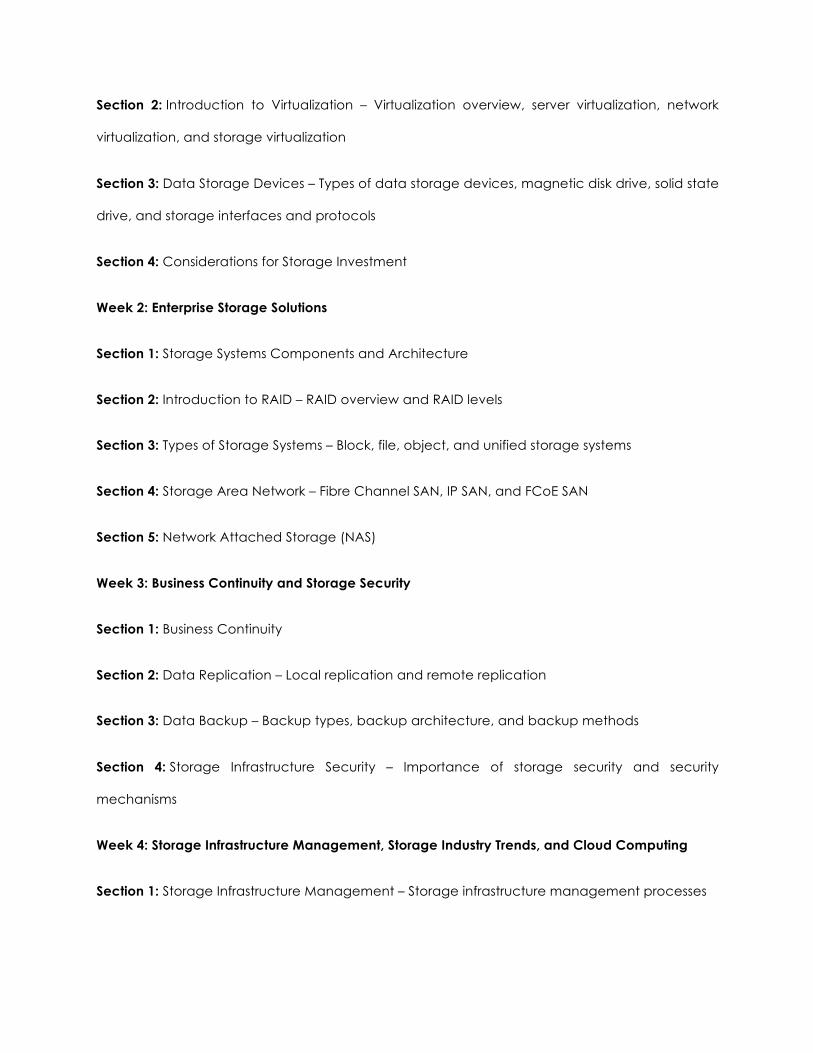
Section 2: Introduction to Virtualization – Virtualization overview, server virtualization, network
virtualization, and storage virtualization
Section 3: Data Storage Devices – Types of data storage devices, magnetic disk drive, solid state
drive, and storage interfaces and protocols
Section 4: Considerations for Storage Investment
Week 2: Enterprise Storage Solutions
Section 1: Storage Systems Components and Architecture
Section 2: Introduction to RAID – RAID overview and RAID levels
Section 3: Types of Storage Systems – Block, file, object, and unified storage systems
Section 4: Storage Area Network – Fibre Channel SAN, IP SAN, and FCoE SAN
Section 5: Network Attached Storage (NAS)
Week 3: Business Continuity and Storage Security
Section 1: Business Continuity
Section 2: Data Replication – Local replication and remote replication
Section 3: Data Backup – Backup types, backup architecture, and backup methods
Section 4: Storage Infrastructure Security – Importance of storage security and security
mechanisms
Week 4: Storage Infrastructure Management, Storage Industry Trends, and Cloud Computing
Section 1: Storage Infrastructure Management – Storage infrastructure management processes

Section 2: Introduction to Cloud Computing – Cloud computing definition, cloud characteristics,
cloud Benefits, and service level agreement (SLA)
Section 3: Cloud Service Models and Deployment Models – Infrastructure as a Service (IaaS),
Platform as a Service (PaaS), and Software as a Service (SaaS), public cloud, private cloud,
community cloud, and hybrid cloud
Section 4: Cloud Storage
Section 5: Storage Industry Trends – All flash storage, converged infrastructure, software-defined
data center, and the Third Platform
COURSE 2: INTRODUCTION TO CLOUD COMPUTING
This course focused on the logistics of cloud computing (how and when to utilize it, and less on
the actual principles of computing)
• NIST Cloud Computing Model
• Value of Model
• Model Organization
• Value to Consumers
• Value to Vendors
• New Revenue and Jobs
• Utility Computing--1961
• Time Sharing--1970s
• Large Distributed Data Centers 1980s-1990s

• Internet Computing 2000-Present
• Essential Characteristics of Cloud Computing


ADDITIONAL COURSEWORK In addition to all of the work done above, I also have a few projects I would like to mention.
SAC APPLICATION The Cleveland State IEEE student chapter hosted an event called the Student Activities
Conference this April. Schools from all over the country come to compete. I developed a full stack
web application for users to register, submit photos, view a scoreboard, receive text messages
from the event, and just be in touch with what was happening at the SAC. I built this web
application using the database knowledge I gained from Dr. Chung.
SENIOR DESIGN As you may know, my group took first place in the 2016 Washkewicz College of Engineering Senior
Design symposium. Our project, titled Cerebro, offered law enforcement a real-time application
that they can use to track suspects as they move from the scene of a crime. It is a very complex
system, but the bottom line is that it is a data driven app. The entire application was built on
Microsoft Azure cloud, and the most important note is that I used what I learned from Dr. Chung
to design and implement this application.
The link is here: https://www.csuohio.edu/engineering/multidisciplinary-cerebro-project-takes-
first-place-senior-design-symposium
“A multidisciplinary team of electrical, mechanical and computer engineering students took first
place at the Washkewicz College of Engineering’s second annual Senior Design Symposium and
Awards Dinner Friday, May 6 for their project entitled, Cerebro Real Time Security.
Cerebro uses an innovative human detection and recognition algorithm to detect humans in the
video streams of cameras within a specified area. As a crime is committed, the suspect is tagged
in the system and tracked from camera to camera as they attempt to flee. This information is then
reported to police in real time.”

WORK EXPERIENCE AND CONCLUSION I cannot stress enough how influential Dr. Chung has been on my career. Her hard work and
dedication to her students has certainly made me a better engineer. I have been offered a full-
time position at Parker Hannifin as a data engineer, and will be starting this coming Monday (May
16th). I attribute a lot of my success thus far within the company to Dr. Chung.
I will be in charge of implementing the company’s data warehouse, as well as heading the project
to deploy and make useful a Hadoop distribution. I will lead the transition of moving our existing
architecture to an off-premise design. I am eager to begin my journey in this field, and have fallen
in love with database systems and its many many many interesting sub-topics.
In conclusion, I can honestly say I have waited four whole years to be as engaged as I was this
last semester in learning.
For me, this course alone was worth the whole cost of college tuition.