munich personal repec archive - uni-muenchen.de · 0 3 5 $ munich personal repec archive...
TRANSCRIPT
MPRAMunich Personal RePEc Archive
Determinants of International BankLending from the Developed World toEast Asia
Reza Yamora Siregar and KM Choy
International Monetary Fund-STI
30. March 2009
Online at http://mpra.ub.uni-muenchen.de/14989/MPRA Paper No. 14989, posted 22. August 2009 14:27 UTC

Determinants of International Bank Lending
from the Developed World to East Asia
Reza Y. Siregar and Keen Meng Choy
MARCH 2009
(Manuscript: forthcoming at IMF Staff Papers)
----------------------------
Reza Siregar (corresponding author) is with the IMF-Singapore Regional Training Institute, Singapore. Keen Meng Choy is in the Economics Division at Nanyang Technological University, Singapore. Without implicating, we would like to thank Sunil Sharma, Joshua Greene, Ranil Salgado and participants at the Singapore Economic Review Conference (2007) and at the SCAPE-EABER Workshop on Intra-Asia Trade and Factor Flows, National University of Singapore (2007) for their comments on early drafts of the paper. We are also grateful for the constructive comments provided by the anonymous referees. Authors’ e-mail addresses: [email protected]; [email protected]; and [email protected].

1
DETERMINANTS OF INTERNATIONAL BANK LENDING
FROM THE DEVELOPED WORLD TO EAST ASIA
Abstract:
The reversal of capital flows from the banking sector, rather than portfolio equity investment,
has long been considered a main reason for the severity of the East Asian financial crisis of
the late 1990s. This study analyzes the factors behind the boom and bust of bank lending,
focusing on loans from private banks in seven OECD countries to nine East Asian economies
during the 1990–2004 period. Our findings suggest that political instability and weaknesses
in the legal, judicial, and bureaucratic systems help explain the continued stagnation in
lending after the financial crisis. Thus, institutional reforms are critical for East Asia to
successfully compete for international bank financing.
JEL Classification Numbers: C23, F11, F34, G21, O53
Keywords: Foreign Bank Loans; East Asia; Gravity Model; Trade Intensity; Financial Risk;
Law and Order; Bureaucratic Quality

2
For most developing economies in East Asia, foreign borrowing from the developed world
has provided much-needed capital to finance rapid economic growth, especially during the
1980s and 1990s.1 Not surprisingly, the sudden reversal of capital flows from the banking
sector was a main reason for the severity of the East Asian financial crisis of the late 1990s.
Accompanying the collapse of economic growth in major East Asian countries was a sharp
decline in loans from OECD-based commercial banks, in particular loans from Japanese
institutions. The hardest hit economies, namely, Indonesia, Malaysia, the Philippines,
Thailand, and South Korea, which had experienced net private inflows averaging around
US$160 billion per annum in 1995 and 1996 (of which about half were short-term commercial
bank loans), saw total foreign liabilities drop by around 45 percent in 1998, as international
banks were unwilling to roll over existing loans.
Although the rates of decline stabilized in 2000 for the most severely affected
economies, only in 2003 did total claims of OECD banks on East Asia start to recover, albeit
unevenly. Loans from Japanese commercial banks at the end of 2004, for instance, were still
only about one-third of the level prevailing at the end of 1997. In contrast, the claims of U.S.
and U.K. banks at the end of 2004 had returned to above 90 percent of their values in 1997.
This paper attempts to examine some of the factors that contributed to the boom and
bust in bank lending to East Asian countries between 1990 and 2004. Little work has been
done on the determinants of international bank lending to these countries during the pre- and
post-1997 financial crisis periods.2 Instead, research so far has focused on the cross-border
1 The causal effect of the banking sector’s liquidity on economic growth has been well studied (Levine, 2005). 2 A few papers such as Jeanneau and Micu (2002), Kawai and Liu (2002), Rose and Spiegel (2004), Papaioannou (2004), and Aviat and Courdacier (2007) looked at international bank lending to emerging market economies as a whole (grouping emerging markets in East Asia with those in Latin America and Africa).

3
trade in goods and services, and on equity flows. However, identifying the driving forces of
international banking activities is of vital importance for understanding the reversals of capital
flows during a crisis and the reasons behind their volatility.
We apply a suitably modified gravity model to a panel dataset of private bank loans from
seven OECD countries to nine East Asian economies during the 1990–2004 period, with the
aim of addressing the following key issues3:
(a) Did geographical locations influence the observed patterns of international bank
lending to East Asia and was such lending constrained by capital adequacy
requirements?
(b) Has bilateral trade in goods led to more trade in assets between the economies
involved?
(c) Has high financial risk reduced or encouraged capital inflows?
(d) Did the law and order situation in a country affect commercial banks’ willingness to
extend loans to it?
(e) Did the quality of the bureaucracy in the borrowing country matter?
The paper proceeds as follows. Section I presents a literature survey and highlights
various stylized facts about the pattern of international bank lending to East Asia. Section II
considers different specifications of a gravity model for asset flows. Section III describes the
data and estimation methods. Section IV presents the key empirical findings for the whole
sample of OECD and East Asian countries as well as subsets of them. The last section offers
some conclusions.
3 The OECD countries included in our study are Belgium, France, Italy, Japan, Netherlands, United Kingdom, and United States of America. The East Asian economies are China, Hong Kong, Indonesia, South Korea, Malaysia, Philippines, Singapore, Taiwan Province of China, and Thailand. The coverage of countries is dictated by the availability of data.

4
I. THE BOOM AND BUST IN INTERNATIONAL BANK LENDING TO EAST ASIA
Stylized Facts
During the 1980s, total annual loans by private sector banks from the seven OECD countries
on the East Asian economies tripled. The rise in lending was especially pronounced in the late
1980s, reflecting the initiatives by many East Asian nations, especially those in Southeast
Asia, to liberalize their banking sectors. Rapid economic growth during the first part of the
1990s led to further inflows from foreign banks. By end-1996, fresh annual bank loans to
these countries totaled more than US$500 billion (see Tables 1 and 2 and Figure 1). Much of
the rise in bank lending represented an increase in short-term liabilities, involving vigorous
growth in trade financing and the creation of offshore banking centers, among other factors
(Jeanneau and Micu, 2002).
In terms of source countries, the rapid expansion of commercial bank lending to East
Asia during the pre-1997 period largely reflected an explosion in loans from Japanese banks
and, to a lesser extent, British banks (Table 2 and Figures 1 and 2). At its peak in 1994,
Japanese lending amounted to more than 65 percent of the total loans from OECD banks.
Ironically, loans from Japanese banks also contracted the most during the Asian financial
crisis. In 2004, the new Japanese bank loans on these countries were barely 30 percent of their
levels at the end of 1996, exceeding total loans from U.K. banks by less than US$1 billion.
Thus, despite the partial recovery in commercial lending since 2002, the exposure of OECD
banks to East Asia in 2004 was only marginally higher than at the end of 1989.
Two groups among the East Asian economies suffered the largest drops in loans from
international banks during the post-1997 period. The first group comprised the two largest
Southeast Asian economies, Indonesia and Thailand, arguably also the most severely affected
by the 1997 financial crisis (Table 1 and Figure 3). Together, they had received nearly US$95
5
billion in bank credit, representing 19 percent of the total lending of OECD banks, at the end
of 1996. In 2004, however, fresh foreign loans to Thailand totaled only about US$11 billion,
or 20 percent of their 1996 level, while loans to Indonesia had fallen from US$41 billion in
1996 to about US$14 billion in 2004. The second largest relative decline in foreign lending
involved the financial hubs of the region, Hong Kong SAR and Singapore (Table 1 and Figure
4). The annual flows of foreign loans to these countries fell to less than US$115 billion in
2004 from about US$268 billion in 1996.
Of the nine Asian economies surveyed, only two, China and Taiwan P.O.C., have seen
a rise in their annual bank loan flows from industrial countries since the 1997 crisis (Table 1
and Figure 5). By the last quarter of 2004, these two countries accounted for 16 percent and
10 percent, respectively, of the fresh OECD bank loans in the region. A decade earlier, they
had jointly received less than 9 percent of bank financing from the same international lenders.
Literature Survey
Understanding the nature and determinants of cross-border asset movements has become a
major subject of research in financial and international economics. While past studies have
focused more on foreign direct investment, attention has centered recently on cross-border
international bank lending. As with trade in goods and services, the early literature on the
“home bias puzzle” emphasized the role of geography and information asymmetries in
explaining cross-country capital movements (Lewis, 1999; Obstfeld and Rogoff (2000); Coval
and Moskowitz, 1999, 2001; Grinblatt and Keloharju, 2001; Hau, 2001). These studies have
shown that institutional investors are biased towards investing in countries located near their
headquarters.

6
More recently, Martin and Rey (2004) and Portes and Rey (2005) have proposed that
asymmetrical information may lead to higher transaction costs between more distant
economies. In these circumstances, agents may learn about each other by trading goods and
thereby exploit the accumulated information to facilitate trade in financial assets, and vice
versa. Trading costs may therefore induce a bias in investors’ portfolios towards domestic
securities and those of their trading partners. In this case, country asset portfolios would
simply reflect changing trade patterns (Obstfeld and Rogoff, 2000; Rose and Spiegel, 2004).
Since the early 2000s, researchers have also focused increasingly on institutional
quality, the legal system, and political risk as factors explaining international capital
movements. Shleifer and Wolfenzon (2002) model how agency costs stemming from
inefficient corporate governance and law enforcement impede external equity inflows into
capital-scarce countries. Wei (2000, 20001) and Wei and Wu (2001) have shown that
corruption and low-transparency exert a distortionary influence on financial flows across
countries, particularly in the case of emerging markets. A more recent paper by Papaioannou
(2004) has specifically focused on the causal effect of a number of legal system indicators on
the level of cross-border lending activities from banks in 19 developed economies to 51
recipient countries, both developed and developing economies, around the world.
Many ways in which the above factors can influence the direction, magnitude, and
volatility of cross-border capital movements have been identified. First and foremost is their
impact on the return, or expected return, of international financial activities. A weak legal
system and poor institutional quality, in particular, have been found to be associated with
inferior economic performance—namely, low and volatile economic growth rates—and
almost always lead to protectionist measures (Acemoglu et al., 2003). Perotti and van Oijen
(2001) have also reported that political instability often results in lower stock returns. A

7
second way in which institutional and political factors can affect financial flows is by raising
monitoring costs and the frequency of insider and other unfair trading practices (Bhattacharya
and Daouk, 2002). Conversely, Papaioannou (2004) has pointed out that a high-quality legal
system minimizes monitoring costs while bureaucratic and judicial efficiency alleviates
agency costs by settling disputes arising from contract incompleteness.
In this burgeoning institution and finance literature, many empirical researchers have
looked at the impact of the institutional and business environment on the behavior of investors
in general. For example, La Porta et al. (1997) and Burger and Warnock (2004) demonstrated
that legal guarantees such as creditor and shareholder rights are key prerequisites for booming
capital markets. However, only a recent study by Papaioannou (2004) has empirically shown
that institutional factors play an important role in explaining the boom and bust of
international bank lending. Our study makes a further contribution to this area of research.
Financial risk factors, such as exposure to exchange rate risk, external debt and net
liquidity positions of borrower nations, represent yet another possible determinant of
international bank lending. The staggering financial risk exposure facing corporate and
financial institutions in East Asia in the wake of the 1997 crisis could have been expected to
discourage lending from foreign and local banks. However, Diamond and Rajan (2000a,
2000b) have offered a more in-depth analysis of the relationship between economic or
financial risk on the one hand, and banks’ willingness to lend on the other. Their model
(henceforth called the DR model) reconciles two functions that a bank typically performs—
liquidity provision and credit creation. They argue that a primary cause of the illiquidity often
found in real and financial markets during a financial crisis lies with the relatively narrow
skills possessed by individuals and institutions, which keep them from being able to transform
otherwise illiquid assets into liquid ones. By contrast, solid banking institutions have the

8
capacity to finance extremely volatile short-term projects, improve their governance and
transparency, and eventually attract investors to provide long-term financing for these
liabilities. In short, the DR model raises the possibility that a rise in financial risk would
actually enhance profit-making opportunities, and thus lead to higher international bank
lending to a local economy.
In addition to a set of pull factors associated with the recipient economies, the role of
the capital adequacy ratio, as a push factor for lending countries, would also be evaluated in
our study. The significance of a bank’s capital position in explaining the size of its lending has
been well documented. One important channel whereby bank capital may affect lending is
through financing costs. Undercapitalized banks would often find it more expensive to finance
lending and consequently, their lending activities are more sensitive to changes in monetary
policy (Kishan and Opiela, 2000). A survey of the Euro Area banks conducted by the
European Central Bank (ECB, 2004) has also demonstrated that the cost associated with
banks’ capital positions partly explains tighter credit standards applied to the approval of
loans. Furthermore, it has been argued in connection with the implementation of the Basle
Accord that regulations on capital requirements are an important factor behind cross-country
credit flows (Cailloux and Stephany Griffith-Jones, 2003).
II. GRAVITY MODELS OF TRADE IN ASSETS
Our study adopts the gravity model for several reasons. To start with, these models have a
long history and have been applied to address numerous issues in economics. Borrowing the
words of Deardoff (1998), gravity models are simple in structure and in principle, consistent
with a wide range of theoretical frameworks. Furthermore, the flexibility of the models allows

9
for both “push” factors originating in source countries and “pull” factors arising from
recipient economies to affect bilateral trade or asset flows.
Because of the attributes discussed above, gravity models have been recognized as a
relatively flexible empirical approach for tackling a variety of applied policy issues. The most
common application of gravity models has largely been in the area of international trade of
goods. Glick and Rose (2002) and Rose (2004), for instance, apply different extensions of the
gravity models to explain the movements of goods around the globe as well as the impact of
trade agreements and currency unions on international flows of goods.
Due to its relative success in explaining good flows, recent applications of the models
have been to the analysis of asset flows. Portes and Rey (2002 and 2005) and Razin (2002) are
some of the seminal papers making use of gravity models to analyze cross-border equity flows
and foreign direct investment, respectively. A recent study has also applied the gravity model
to explain variations in remittance flows to developing countries around the world (Lueth and
Ruiz-Arranz, 2007)4.
One possible shortcoming of the gravity models, however, has been their lack of
theoretical foundation. However, attempts have been carried out to strengthen their theoretical
underpinnings. Bergstrand (1985), Feenstra et.al. (2001) and Anderson and Van Wincoop
(2003) are some of the papers that have provided theoretical frameworks to the trade
applications of gravity models. Much less research, however, has been carried out in the area
of international bank lending, except for Rose and Spiegel (2004). This study develops a
simple theoretical model on international bank lending, and demonstrates that the pattern of
borrowing favors creditors with higher bilateral trade volumes with the debtor. The study then
4 These recipient countries are Bangladesh, Croatia, Indonesia, Kazakhstan, FYR Macedonia, Moldova, Philippines, Serbia and Montenegro, Slovenia, Tajikistan and Thailand.

10
applies the gravity model to test the theoretical findings on an annual panel data set, including
bilateral trade and international bank claims from 20 creditors and 149 debtor countries from
1986 through 1999.
To strengthen the analyses behind our application of the gravity model, we borrow and
extend empirically some of the key theoretical findings of Rose and Spiegel (2004). Having
identified a number of factors that may explain changes in bank lending from the developed
world to East Asia, we now show how a variant of the widely used gravity model of
international trade can be used to explore the empirical determinants of cross-border asset
flows.
In our paper, we consider three specifications of the gravity model. The first is:
( ),1 ,
, ,
ln ln( ) ( )ij ti ij h t ij t
h ti t j t
assetdist country dummies year dummies
gdp gdpα β δ τ ε
⎛ ⎞= + + + +⎜ ⎟⎜ ⎟
⎝ ⎠∑ ∑ (1)
This is the basic gravity model, in which asset flows between two countries are postulated to
depend positively (in normalized form) on their economic masses—as represented by gross
domestic products ( ( ),i j tgdp )—and inversely on the (great circle) geographical distance ( ijdist )
between their respective economic centers.5 Given the objectives of our study, we only focus
on commercial bank lending from the OECD countries. Accordingly, the ,ij tasset variable
represents an annual bank lending flow (denominated in millions of constant US dollars) from
the private banks in a lender country i to a borrower country j in year t.
Unlike the case of trade in goods, the distance variable in Equation (1) should not
necessarily be purely associated with “transportation costs”. Rather, when discussing trade in
assets, one can consider the distance measure more generally as a proxy for information 5 Interestingly, economists do not use the version of the gravity model favored by other social scientists, which involves the squared distance variable and is more faithful to its Newtonian origins.
11
asymmetries and transaction costs, since geographical separation implies barriers to closer
interactions between any two countries’ economic agents, such as fewer cultural and personal
exchanges and the existence of language differences. High information asymmetries would in
turn reduce flows of financial assets from one country to another. On the other hand, returns
on assets in the local economy are likely to be less correlated with the asset returns in distant
economies. Thus, in order to diversify their portfolio investment, investors could be favorably
predisposed to investing in distant economies’ assets (Portes and Rey, 2005; Aviat and
Courdacier, 2007). Given these two contrasting points of views, 1β could be either positive or
negative.
The country dummies in Equation (1) include variables meant to account for the
special status of Singapore and Hong Kong as international financial centers and in the case of
Malaysia, the imposition of capital controls in 1998, the dummy for which takes a value of 1
only after 1997. Furthermore, we identify the economies in our sample belonging to the
Association of Southeast Asian Nations (ASEAN) through another binary variable because
membership in ASEAN may well promote asset inflows into the region through joint
governmental efforts. Since colonial history might also bias bank lending, a dummy variable
for it becomes operative if a lender country i has ever colonized a borrower country j. Lastly,
a full set of time dummies are added to control for the impact of common shocks across
countries (e.g. the state of the world economy in any given year and the Asian financial crisis
of 1997 and 1998).
The second gravity model we estimate is given by:

12
( ),1
, ,
,2 3 , ,
, ,
ln ln( ) ( )
ln ln( )
ij ti ij h t
h ti t j t
ij ti t ij t
i t j t
assetdist country dummies year dummies
gdp gdp
tradeCAR
gdp gdp
α β δ τ
β β ε
⎛ ⎞= + + +⎜ ⎟⎜ ⎟
⎝ ⎠⎛ ⎞
+ + +⎜ ⎟⎜ ⎟⎝ ⎠
∑ ∑ (2)
Specification (2) adds two more potential determinants of the annual flows of bank lending to
the right-hand-side variables. The ,ij ttrade variable represents the total bilateral trade
conducted in any given year between country i and country j. To correct for market size, this
variable is again normalized by the product of the two countries’ GDPs. The variable can be
considered to be an important “pull” factor determining the amount of loans demanded by the
trading nations of East Asia. As mentioned above, Obstfeld and Rogoff (2000) and Rose and
Spiegel (2004) provide both theoretical arguments and empirical evidence to demonstrate that
information gathered from goods trading should also facilitate trade in financial assets. As
briefly discussed, the latter study demonstrates theoretically that an increase in the expected
volume of bilateral trade with an individual country is associated with both an increase in
overall borrowing and an increase in the share of overall borrowing originating in that
country. If these arguments are valid, we should expect higher bilateral trade to stimulate
financial inflows into the recipient countries ( 2 0β > ).
On the supply side, the ,i tCAR variable represents a key “push” factor affecting the
ability of private banks from the developed world to extend credit to borrowers outside their
borders. This variable is a weighted average of the capital adequacy ratios of the major source
banks in each OECD country. Since a low capital position should limit the ability of banks to
increase lending on regulatory and prudential grounds, the coefficient 3β is likely to be
positively signed.

13
After accounting for the above influences, we investigate whether financial, political,
and institutional factors play additional roles in shaping cross-border bank asset flows. To this
end, we augment Equation (2) with ratings of financial risk, the law and order situation, and
bureaucratic quality to develop a third specification6:
( ),1
, ,
,2 3 , 4 , 5 , 6 , ,
, ,
ln ln( ) ( )
ln ln( ) ln( ) ln( ) ( )
ij ti ij h t
h ti t j t
ij ti t j t j t j t ij t
i t j t
assetdist country dummies year dummies
gdp gdp
tradeCAR fr lo bq
gdp gdp
α β δ τ
β β β β β ε
⎛ ⎞= + + +⎜ ⎟⎜ ⎟
⎝ ⎠⎛ ⎞
+ + + + + +⎜ ⎟⎜ ⎟⎝ ⎠
∑ ∑
(3)
The first of the three new variables included in the augmented model is the relative financial
risk ratings of the borrowing countries ( ,j tfr ), which range from 0 (most risky) to 50 (least
risky). The overall rating takes into account five possible sources of financial risk exposure:
external debt (as a share of GDP), foreign debt service (as a percentage of the exports of
goods and services), the current account (as a percentage of exports), net international
liquidity (months of import coverage), and exchange rate stability. Based on a naive rationale,
a generalized increase in financial risk should discourage the lending activities of foreign and
local banks in the domestic economy. However, as discussed earlier, the DR model
demonstrates that higher uncertainty can cause deposits to become extremely fragile, and
hence create a role for banks with adequate capital to manage the illiquid assets and earn
profits. Therefore, the sign of 4β is ambiguous in theory.
The second variable to be added is an index of law and order in a borrower economy
( ,j tlo ). This index assesses the effectiveness of indigenous legal and judicial systems, as well
6 All three rating indicators are drawn from the International Country Risk Guide of the PRS group. Please refer to the Appendix for details.

14
as the degree of adherence to the law. For East Asia in general, this index has moved very
closely with the overall political stability index.7 Thus, it partly reflects the political stability
of a country. The index assigns a score from 1 to 6 to each country, with a higher score
indicating a stronger legal system and more effective law enforcement. Presumably a stable
law and order situation is a necessary condition for international banking activities to take
place. Thus, 5β should be larger than zero.
The last explanatory variable in Equation (3) is a proxy for the quality of the
bureaucracy in the borrowing country ( ,j tbq ). It takes on values between 0 and 4, with a
higher number reflecting better institutional performance (logarithms are not taken due to zero
scores). As explained in the literature survey, we expect the coefficient on bureaucratic quality
to be positive and significant, because a more transparent and less corrupt bureaucracy in a
given country tends to foster greater confidence in bank lenders and lead them to extend more
credit.
III. DATA AND ESTIMATION METHODS
Before reporting the empirical results, we present a brief description of the data and the
econometric techniques used to estimate the three gravity models for asset trade. First,
bilateral statistics on the annual bank lending flows of source OECD countries’ banks are
taken from the Bank for International Settlement’s (BIS) International Locational Banking
Statistics (IBS) for the 1990–2004 period.8 The OECD banks are from Belgium, France, Italy,
7 The degree of correlation between these two variables for the whole of East Asia during the full sample period is around 0.72. For the Southeast Asian countries, the average is slightly higher; for Indonesia, it is 0.86. We opted to use the law and order index since it better explains bank lending in the regressions reported below.
8 Flows are estimated by the BIS as the exchange rate adjusted changes in total loans.

15
Japan, the Netherlands, United Kingdom, and the United States while the recipient countries
from East Asia are China, Hong Kong SAR, Indonesia, South Korea, Malaysia, Philippines,
Singapore, Taiwan P.O.C., and Thailand. The bank capital ratios for the lender countries in
this sample are extracted from the Bankscope database for the same period, although there are
no observations for the US and France during 1990–1992 and the Netherlands during 1990–
1994.9 Consequently, the 846 observations we have comprise an unbalanced panel. The GDP
and trade time series come from the World Bank’s World Development Indicators database.
As mentioned, the three institutional ratings (financial risk; law and order; and bureaucratic
quality) are described in detail in the Appendix.
Table 3 provides the basic summary statistics for the dependent and independent
variables. We performed the panel unit root test of Im, Pesaran, and Shin (2003) on the
logarithms of the time-varying variables and found strong, albeit inconclusive, evidence that
they are all stationary.10 This is to be expected, as the bank loan and trade variables are taken
as shares in GDP while the capital ratios, financial risk rating, and the law and order and
bureaucratic quality indices are all bounded within fixed ranges. Figure 6 plots normalized
bank loans against geographical distance, both expressed in logarithms. The scatter graph
reveals a weak negative correlation between bank claims and distance from lender to
borrower, especially after the latter exceeds about 3000 km. In contrast, the scatter plot of
9 The weights used in the calculation of the capital adequacy ratios are the asset sizes of individual banks. The coverage of banks is constrained by what is available in the database, with the consequence that a given bank may be included in the computation in some years but not in others.
10 The evidence is unambiguous only for the financial risk, law and order, and bureaucratic quality variables. In the case of the other variables, the results depend on the lag length used in the ADF-type regressions. Nonetheless, we should bear in mind the low power of unit root tests in panels with a relatively short time span. For the sake of brevity, the test results are not reported, but they will be made available upon request.

16
bank loans versus bilateral trade volumes in Figure 7 suggests there is a direct correlation
between physical trade in goods and services and financial trade in banking assets.11
As regards econometric issues, the unit root tests imply that panel cointegration
methods are not needed to obtain efficient and consistent estimates of the parameters in the
gravity equations. Thus, all the specifications described in the previous section are initially
estimated with panel techniques based on ordinary least squares (OLS), except that we report
White’s heteroskedasticity-robust standard errors for the point estimates.12 Specifically, the
presence of the time-invariant distance variable in the estimating equations naturally leads us
to adopt a random effects model in which heterogeneity across country-pairs is subsumed
within the disturbance term ( ,ij tε ), although one could argue that the countries selected might
not constitute a random sample drawn from a large population.
To check the robustness of the coefficient estimates to this assumption, we also
perform a fixed effects regression by dropping the distance variable and the country and
regional dummies. In effect, this method employs dummy variables for all countries, both as
lenders and as borrowers, to eliminate any correlation between unobserved effects and the
explanatory variables. Furthermore, in view of the fact that most economic relationships tend
to persist through time and the effects of the explanatory variables in the gravity model may
take more than a single period to work themselves out, we estimate a dynamic panel data
model in which the first lag of bank loans is included as a predetermined variable in Equation
(3).13 It is well-known that when this is done, both the random and fixed effects estimators are
11 The scatter plots for the other explanatory variables are harder to interpret and are therefore omitted.
12 The use of normalized ratios should also mitigate the problem of heteroskedasticity.
13 A referee has brought up the point that the use of contemporaneous data on financial risk, law and order, and bureaucratic performance presumes that commercial banks knew the ratings on these variables at the time of the
17
biased, so we employ the Arellano-Bond (1991) generalized method of moments (GMM)
estimator instead. Unfortunately, this method again does not supply us with estimates of the
time-invariant variables in the equation.
IV. EMPIRICAL RESULTS
We estimated the three versions of our gravity model on the data described in the previous
section to study the following questions:
(a) Can geographical distances between lender and borrower countries explain the uneven
distribution of bank loans to the region?
(b) Do “push” and “pull” factors play equally important roles in stimulating bank lending?
(c) How have financial risk, political stability, and the quality of the bureaucracy affected
capital flows to individual economies?
(d) Why did loans by Japanese banks to East Asia drop much more than loans from U.S.
and U.K. banks during the financial crisis?
(e) Why were the declines in bank credit especially large for the two largest economies in
the region, Indonesia and Thailand, and for the region’s financial centers, Hong Kong
and Singapore?
(f) Why did loans to China and Taiwan P.O.C. recover so strongly after the crisis?
We report first the results of our estimates for the full sample of OECD and East Asian
countries, before turning to three groups of borrower nations and selected major lenders. A
range of different panel estimation procedures will be reported for the full sample. Because
the full sample results are quite robust, only the findings from random effects specifications
lending decision. But the data we use from the International Country Risk Guide are precisely the type of information that banks rely on in practice when making loans.

18
are presented for the various subgroups of the data sample. Moreover, our primary focus is on
the direct impact of the factors affecting bank lending on the flow of new loans from the
OECD to the East Asian countries. Given our limited number of observations and the
complexity of the causal effects involved, we eschewed the estimation of simultaneous
equation or structural VAR models, which would shed light on any indirect effects that are
present.
Full Sample Results
Table 4 presents the results of the gravity regressions for the complete data set. Altogether,
seven specifications are estimated. According to the R-squared statistics, the different sets of
explanatory variables explain at least half of the variation in the logarithms of normalized
bank assets in all but the third specification based on fixed effects estimation. This finding is
consistent with the results from the asymptotic chi-squared tests of overall statistical
significance shown in the last row.
Since they are not of direct interest to us, we do not report the detailed coefficient
estimates for the country and time dummy variables. As intuition would suggest, the
coefficients for the financial center, ASEAN membership and colonial history dummies are
always positive and significant at conventional levels. Interestingly, the dummy variable for
Malaysian capital controls is also found to have a significant positive sign. This finding seems
to support the argument that capital controls in Malaysia have successfully shielded the
economy from the volatile financial markets during the 1997 crisis and facilitated the return of
19
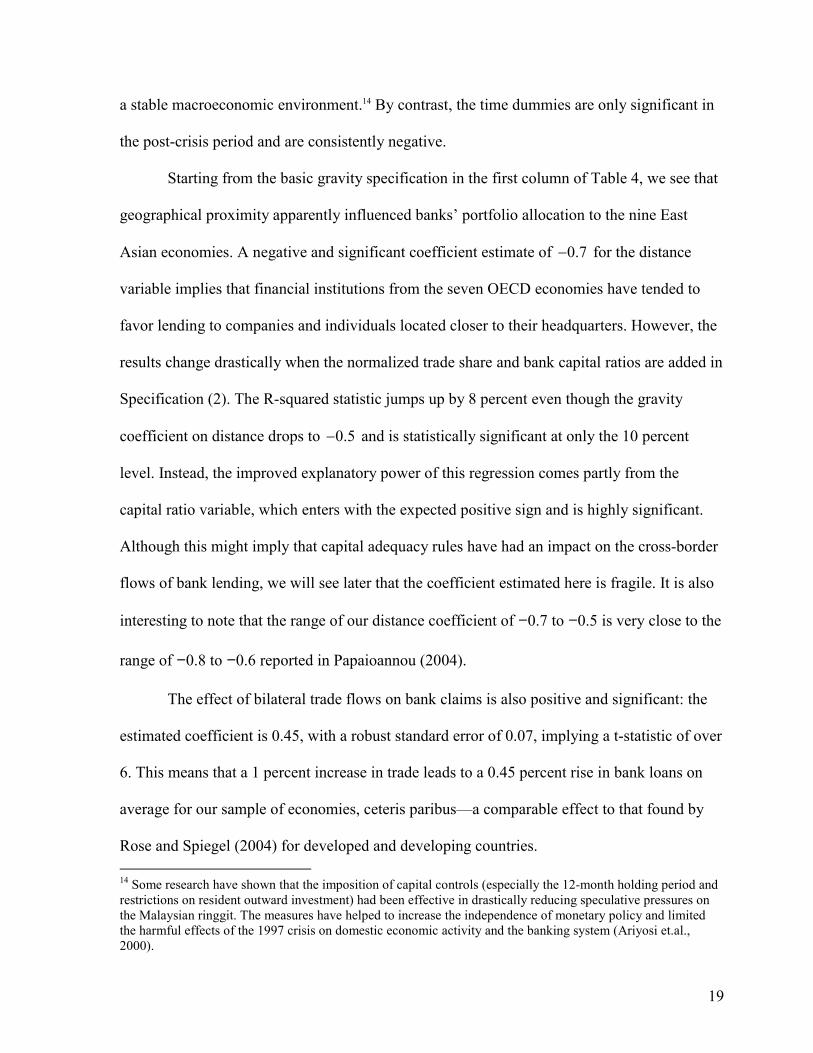
a stable macroeconomic environment.14 By contrast, the time dummies are only significant in
the post-crisis period and are consistently negative.
Starting from the basic gravity specification in the first column of Table 4, we see that
geographical proximity apparently influenced banks’ portfolio allocation to the nine East
Asian economies. A negative and significant coefficient estimate of 0.7− for the distance
variable implies that financial institutions from the seven OECD economies have tended to
favor lending to companies and individuals located closer to their headquarters. However, the
results change drastically when the normalized trade share and bank capital ratios are added in
Specification (2). The R-squared statistic jumps up by 8 percent even though the gravity
coefficient on distance drops to 0.5− and is statistically significant at only the 10 percent
level. Instead, the improved explanatory power of this regression comes partly from the
capital ratio variable, which enters with the expected positive sign and is highly significant.
Although this might imply that capital adequacy rules have had an impact on the cross-border
flows of bank lending, we will see later that the coefficient estimated here is fragile. It is also
interesting to note that the range of our distance coefficient of −0.7 to −0.5 is very close to the
range of −0.8 to −0.6 reported in Papaioannou (2004).
The effect of bilateral trade flows on bank claims is also positive and significant: the
estimated coefficient is 0.45, with a robust standard error of 0.07, implying a t-statistic of over
6. This means that a 1 percent increase in trade leads to a 0.45 percent rise in bank loans on
average for our sample of economies, ceteris paribus—a comparable effect to that found by
Rose and Spiegel (2004) for developed and developing countries. 14 Some research have shown that the imposition of capital controls (especially the 12-month holding period and restrictions on resident outward investment) had been effective in drastically reducing speculative pressures on the Malaysian ringgit. The measures have helped to increase the independence of monetary policy and limited the harmful effects of the 1997 crisis on domestic economic activity and the banking system (Ariyosi et.al., 2000).

20
When the additional financial and institutional variables in Specification (3) are
included in the extended gravity model, the coefficients of the distance, trade and bank capital
variables in the random effects regression and their associated standard errors remain intact. In
the case of the financial risk variable, our estimation results seem to support the arguments
made by the DR model: a rise in financial risk in East Asian borrowers, especially during the
1997 crisis, is associated with higher lending by commercial banks from the OECD
countries.15 As for the quality of the bureaucracy, its positive coefficient confirms that
countries with effective governments attract more bank lending. The estimated coefficient is
very significant, a remarkable result given the proxy’s low variability (see Table 3). The law
and order variable does not appear to have influenced bank lending, at least not when the full
sample of countries is considered. However, when we look at two separate groups of
economies below, namely Indonesia and Thailand, and Singapore and Hong Kong SAR, we
are able to shed more light on the importance of this variable.
As a check on robustness, the next column reports the results of modeling country
heterogeneity as fixed effects. The point estimates of the time-varying variables from the fixed
effects regression are very close to those of the random effects model, but the robust standard
errors are noticeably larger. This result is still remarkable as the fixed effects estimator
exploits only the variation within each country-pair panel over time and ignores cross-
sectional variation, unlike the more efficient random effects estimator, which takes both into
account.
In addition, the dynamic panel estimator of Arellano and Bond (1991) generates
estimates that are similar to those obtained from the OLS-based methods. Most of the 15 This finding is also consistent with that of Morgan et al. (2003). They reported a negative correlation between out-of-state bank share and state business volatility. Peek and Rosengreen (2000) unraveled a similar behavior for foreign banks during the Tequila crisis in Argentina, Brazil, and Mexico.

21
parameter estimates are statistically significant, with the exceptions being the coefficients for
the capital ratio variable and the law and order proxy, which are close to zero. We therefore
conclude that these two variables aside, the parameter estimates are robust across the different
specifications and estimation methods. It is also interesting to note that the lagged dependent
variable is found to be significant with an estimated coefficient of 0.62, suggesting moderate
persistence in bank lending patterns. This finding confirms that past observations on the
explanatory variables would indirectly influence the size of bank lending today. In particular,
a deterioration in the quality of institutions in a recipient economy would have delayed effects
on the volume of bank loans.
Note that Specifications (2) and (3) include a measure of trade among the explanatory
variables, for reasons described earlier. Since trade flows could potentially be affected by
financial flows, and vice versa, this may lead to simultaneity bias in the estimated coefficients
due to the trade variable being correlated with the error term. Unlike Rose and Spiegel (2004)
who assume trade variables to be exogenous, we gauged this potential endogeneity problem
by regressing trade volumes first on geographical distance and the gravity dummies, and then
adding bank claims to see if the latter helps to explain the former. It turns out that the
magnitude and significance of the distance coefficient are hardly altered when bank loans are
added to the regression while the R-squared statistic rises only marginally, indicating that
there is little feedback from credit lending to trade activities.
Given the rapid structural changes in the economies of East Asia, triggered partly by
the 1997 financial crisis, it is arguably too simplistic to examine bank lending activities for the
full sample period. The last two columns of Table 4, therefore, explore the stability of our
empirical results over time. Here, we break up the sample into pre- and post-financial crisis
periods, with the former including observations up to 1998 and the latter representing

22
observations from 1999 onwards. This is an extension of previous studies that focus only on a
consolidated period. The choice to include 1998 as part of the pre-crisis period is dictated by
the annual nature of our data and by the timing of the crisis episodes. For most of the crisis-
effected economies, the year 1997 still saw positive growth rates and relatively robust
macroeconomic performances. It was only in 1998 that we witnessed a severe and broad-
based deterioration in economic conditions. Furthermore, some of the East Asian countries
included in this study were largely unaffected by the 1997 crisis, so we opted not to exclude
the years 1998 and 1999 in our final regression results reported in Table 4.
Several interesting findings emerge from this exercise. To begin, the distance variable
is statistically significant during the pre-crisis period but becomes insignificant after that.16
This finding is consistent with the trend to decentralize the decision making process of the
lending activities of OECD banks. When the OECD banks initially established their
operations in East Asia during the pre-1997 crisis period, decisions on where and how much
to lend were predominantly made directly from the headquarters. During this early period,
therefore, the distance factor representing information costs was an influential variable.
However, a decentralization process emerged, especially since the mid-1990s, highlighted by
a shift in the lending strategy from predominantly cross-border activities carried out by the
main headquarters of banks to local lending managed by their branches, or their regional
headquarters, in each of the borrower countries.
A number of factors contributing to the rise in the local lending by the branches or
subsidiaries of the foreign banks have been well documented by early studies. One of them is
lower regulatory restriction, including that on foreign ownership policy (Cerutti, et.al.
16 The time dummies were dropped from the post-crisis period since they turned out to be statistically insignificant. Given the importance of Japanese lending to East Asia, we also tried excluding Japanese bank loans from the subperiod regressions, but the results are qualitatively similar.

23
(2007)).17 As an integral part of their bank restructuring policies, major Southeast and East
Asian economies, such as Indonesia, Thailand and Korea, had relaxed entry regulations and
allowed majority ownership by foreign investors of their domestic banks in 1998 and 1999.
The commitment to meet the entry requirements to World Trade Organization (WTO)
membership has also been partly responsible for the rapid opening of the financial sector,
including the banking sector, in China (Liu (2005)).
The rise in local exposure, including lending in the domestic currency, essentially
reduced the weight on “distance cost” factor in explaining the lending decision of OECD
banks to East Asia.18 The extent of local exposure in total bank lending by the BIS reporting
banks to Asia rose from around 13 percent in December 1995 to about 30 percent in
September 2001 (Lubin, 2002).19 The average share of local claims held by U.S. banks alone
was over 60 percent, and as high as 70–80 percent in individual economies such as Hong
Kong SAR, Singapore, Thailand, Malaysia and Taiwan P.O.C. (Herrero and Martinez-Peria,
2007).
Another noteworthy finding is the reduced economic significance of the trade variable
over the two subperiods (its coefficient falls from 0.54 to 0.42). Thus, international trade in
goods and services seems to have played a weaker facilitating role for the asset trade after
1997. In contrast, financial risk ratings influenced international bank lending much more in
17 For most of the Southeast Asian economies, the initial stages of financial sector reform and the opening of the domestic economy (not only at the capital city, but also at several other large cities) to the full operations of the foreign banks took place in the early 1990s.
18 It is important to stress here that our test results suggest that indeed there is a decline in the importance of the ‘distance cost’ factor, or the weight being placed on the distance variable in explaining lending of the OECD banks to East Asia during the post-crisis. However, this does not necessarily imply that the distance cost has actually subsided from the pre- to the post-crisis.
19 The BIS data do not discriminate between cross-border and local claims by foreign banks in bilateral lending, however. They are combined under what the BIS calls “international claims”.

24
the post-crisis period, as seen in the doubling of its coefficient. Surprisingly, the capital ratio
estimates now turn negative for both sub-periods and lose their significance. Perhaps most
interesting of all, the estimated coefficients on the law and order and bureaucratic quality
variables take on the correct signs and great significance in the aftermath of the Asian crisis.
This means that developed country lenders have become more sensitive and attuned to non-
economic factors, namely the political, legal, and bureaucratic environments in borrower
countries, since the crisis.
Indonesia and Thailand
Geographical distance seems to have been a significant determinant of lending by the OECD
banks to Indonesia and Thailand from 1990 to 1998, but not afterwards (Table 5). As
explained above, the fall in the importance of distance factor is due largely to the higher share
of local or regional loans and the concomitant decline in international cross-border lending to
the two countries. The rise in local claims can be seen from the greater ownership of local
financial assets by OECD banks. From 1994 to 1999, the proportion of total banking sector
assets owned by foreign banks in Korea, Thailand, and Indonesia rose from about 4 percent to
7 percent (Mathieson and Roldos, 2001). As briefly discussed, the authorities in Indonesia and
Thailand have moved to allow foreign banks to acquire a majority stake in the domestic
commercial banks during the 1997 financial crisis. In Thailand, the government permitted
foreign banks that already have a full branch or a Bangkok International Banking Facility
(BIBF) to apply for majority ownerships of local banks. During the early stage of the bank
restructuring process, the Thai authority sold major ownerships of four local private
commercial banks with over 300 branches all over the country to foreign investors (Rajan and
Montreevat (2003)). In 1998, Indonesia lifted restrictions on branching and sub-branching for
25
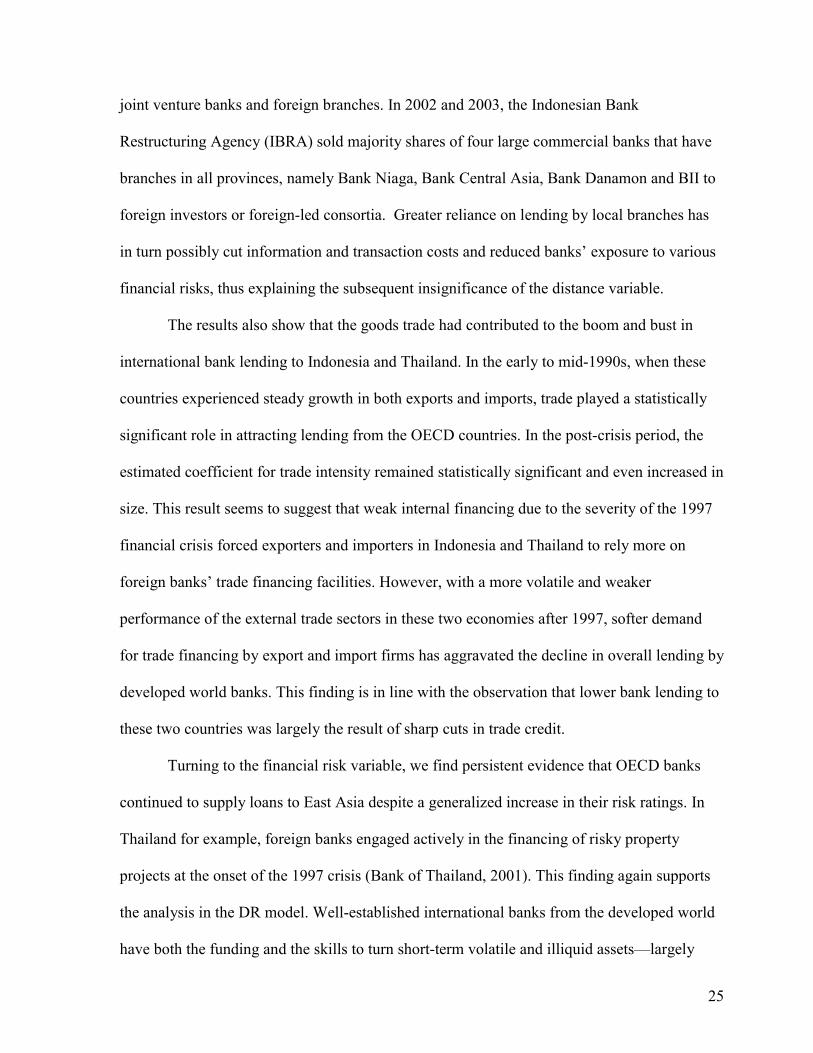
joint venture banks and foreign branches. In 2002 and 2003, the Indonesian Bank
Restructuring Agency (IBRA) sold majority shares of four large commercial banks that have
branches in all provinces, namely Bank Niaga, Bank Central Asia, Bank Danamon and BII to
foreign investors or foreign-led consortia. Greater reliance on lending by local branches has
in turn possibly cut information and transaction costs and reduced banks’ exposure to various
financial risks, thus explaining the subsequent insignificance of the distance variable.
The results also show that the goods trade had contributed to the boom and bust in
international bank lending to Indonesia and Thailand. In the early to mid-1990s, when these
countries experienced steady growth in both exports and imports, trade played a statistically
significant role in attracting lending from the OECD countries. In the post-crisis period, the
estimated coefficient for trade intensity remained statistically significant and even increased in
size. This result seems to suggest that weak internal financing due to the severity of the 1997
financial crisis forced exporters and importers in Indonesia and Thailand to rely more on
foreign banks’ trade financing facilities. However, with a more volatile and weaker
performance of the external trade sectors in these two economies after 1997, softer demand
for trade financing by export and import firms has aggravated the decline in overall lending by
developed world banks. This finding is in line with the observation that lower bank lending to
these two countries was largely the result of sharp cuts in trade credit.
Turning to the financial risk variable, we find persistent evidence that OECD banks
continued to supply loans to East Asia despite a generalized increase in their risk ratings. In
Thailand for example, foreign banks engaged actively in the financing of risky property
projects at the onset of the 1997 crisis (Bank of Thailand, 2001). This finding again supports
the analysis in the DR model. Well-established international banks from the developed world
have both the funding and the skills to turn short-term volatile and illiquid assets—largely

26
caused by the collapse of major local banks and non-bank financial institutions and the
relatively slow restructuring process of the financial sector in Indonesia and Thailand—into
long-term, more stable, and profitable investments.
In addition to the trade and financial risk factors, OECD lenders appear to have placed
even more weight on the quality of the bureaucracy and the legal system in deciding whether
to extend bank loans to Thailand and Indonesia during the post-crisis, as opposed to the pre-
crisis, period. Consistent with a priori expectations, a deterioration in the quality of
bureaucratic institutions in these economies, particularly in the case of Thailand, has
depressed the lending activities of OECD banks in these economies during the post-1997
period, as indicated by a significant and positive coefficient for the ,j tbq variable. Similarly,
the importance of law and order in attracting international bank lending to these countries
increased after 1997. During this period, both Indonesia and Thailand experienced fairly sharp
declines in their law enforcement efforts, according to the ,j tlo variable. In Indonesia, the
worsening law and order situation started very much at the early stages of the financial crisis,
and only showed signs of improvement in 2004. In contrast, political stability and law and
order in Thailand deteriorated further in early 2003.
Hong Kong SAR and Singapore
As in Indonesia and Thailand, the redistribution strategy of OECD banks also helps to explain
the insignificant role played by distance in the regressions for Hong Kong SAR and Singapore
shown in Table 5. This result underscores their status as the financial hubs of East Asia, for it
is in these two countries more than anywhere else that commercial bank loans from the OECD
are to be considered as local or regional. Again not surprisingly, trade growth has been
27
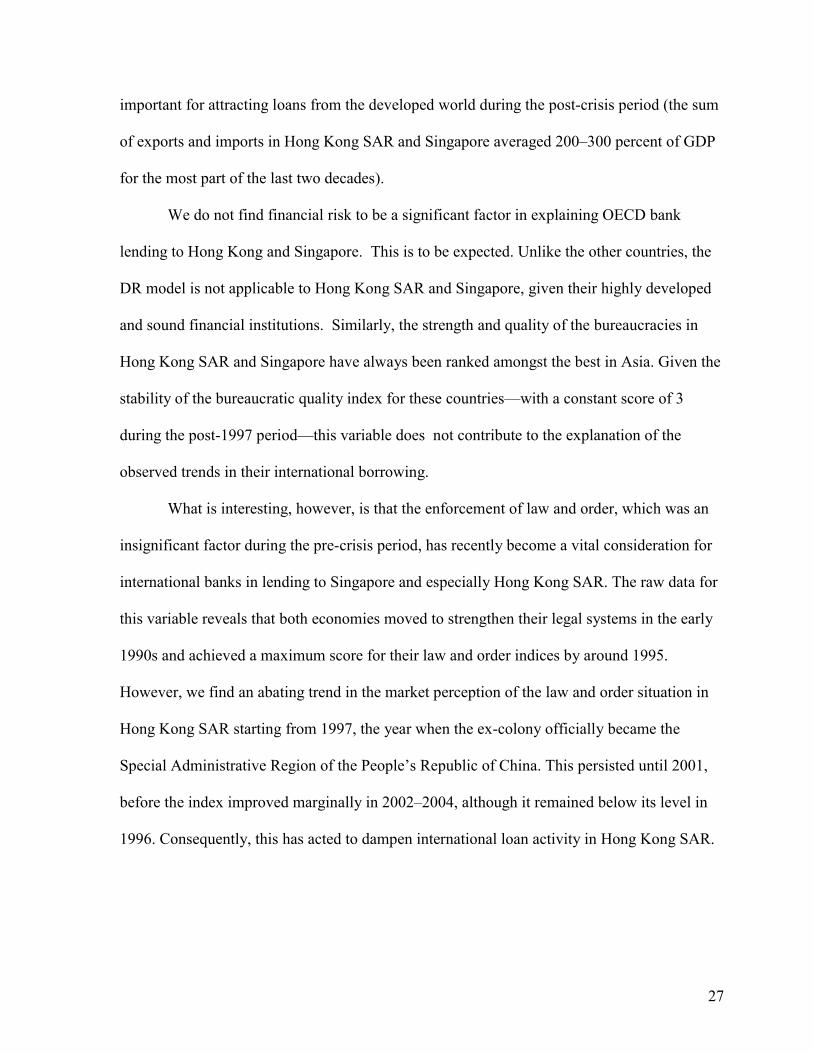
important for attracting loans from the developed world during the post-crisis period (the sum
of exports and imports in Hong Kong SAR and Singapore averaged 200–300 percent of GDP
for the most part of the last two decades).
We do not find financial risk to be a significant factor in explaining OECD bank
lending to Hong Kong and Singapore. This is to be expected. Unlike the other countries, the
DR model is not applicable to Hong Kong SAR and Singapore, given their highly developed
and sound financial institutions. Similarly, the strength and quality of the bureaucracies in
Hong Kong SAR and Singapore have always been ranked amongst the best in Asia. Given the
stability of the bureaucratic quality index for these countries—with a constant score of 3
during the post-1997 period—this variable does not contribute to the explanation of the
observed trends in their international borrowing.
What is interesting, however, is that the enforcement of law and order, which was an
insignificant factor during the pre-crisis period, has recently become a vital consideration for
international banks in lending to Singapore and especially Hong Kong SAR. The raw data for
this variable reveals that both economies moved to strengthen their legal systems in the early
1990s and achieved a maximum score for their law and order indices by around 1995.
However, we find an abating trend in the market perception of the law and order situation in
Hong Kong SAR starting from 1997, the year when the ex-colony officially became the
Special Administrative Region of the People’s Republic of China. This persisted until 2001,
before the index improved marginally in 2002–2004, although it remained below its level in
1996. Consequently, this has acted to dampen international loan activity in Hong Kong SAR.

28
China and Taiwan P.O.C.
Among the East Asian economies, only China and Taiwan P.O.C. boasted higher bank loans
in 2004 compared to late 1996. As in the rest of East Asia, the annual OECD bank claims on
these economies have fluctuated since early 2000. However, unlike the rest, China and
Taiwan P.O.C. each experienced at least one year of a sharp upsurge in commercial bank
loans. The total fresh bank claims of international banks on China in 2003, for instance, was
still 30 percent less than the level in late 1997, but it grew by close to 50 percent in 2004,
fuelled partly by the steady rise in foreign ownership participation in the economy (Podpiera,
2006). Taiwan P.O.C, on the other hand, experienced a growth of 85 percent in OECD bank
borrowing in 2003 alone. For China, banks from the U.S., U.K., and Japan were largely
responsible for the sharp rise in total bank claims seen in 2004. As for Taiwan P.O.C., banks
from the Netherlands also aggressively increased lending to the local economy.
One of the key drivers to the rise in the foreign ownership participation in the Chinese
banking system was the inception of the country into the World Trade Organization (WTO).
The liberalization of the banking sector to meet the WTO requirements began very slowly in
1996 in Shenzen, but began to spread and deepen to other parts of China since 2001. One of
the most significant events since full WTO entry in late 2003 was the initiative to allow
foreign banks with a remimmbi (RMB) lincense to to handle businesses with local Chinese
enterprises in local currency in thirteen cities that had been declared financially opened. In
January 2004, four foreign banks, namely Citibank, SBC, Mizhuo bank and Hong Kong based
Bank of East Asia, were given approval to begin such businesses (Liu (2005)).
The presence of “structural breaks” in the bank loans to these two economies has
arguably contributed to the weak regression results (Figure 5 and Table 5). The joint R-
squared statistics for China and Taiwan P.O.C. range between 4 to 10 percent, significantly

29
lower than the corresponding values for the other borrower countries. The only explanatory
variable with a significant coefficient estimate is the capital ratio for the post-crisis period and
it carries the wrong sign. This suggests that the independent variables employed in this study
are inadequate for capturing the observed movements in OECD bank claims on these two
economies.
Lender Country Results
Next, we examine the factors affecting international bank lending from the perspective of the
lender banks in three major economies, namely Japan, the U.S., and the U.K. As noted in the
introduction to the paper, Japanese banks remained the largest source of bank loans from the
developed world to East Asia. However, their total claims have fallen drastically compared to
U.S. and U.K. banks in the post-crisis era. It is therefore important to understand the causes of
this prolonged stagnation in Japanese lending. Specifically, the gravity model allows us to
ascertain whether it is due primarily to “push” or “pull” factors. The high R-squared statistics
in Table 6, ranging from 0.82 to 0.97, underscore the strong explanatory power of our chosen
set of determinants of bank lending.
Furthermore, a number of empirical results are worth stressing. First is the role of the
banks’ capital position, as proxied by the ,i tCAR variable. We found the post-crisis coefficient
for this variable to be significant only in the cases of the US and the Japanese banks. Looking
at the CARs of the UK banks, the average annual level has been well above 20 percent since
1999. Thus, it is no surprise that the CAR position has not been an issue for this group of
banks. In contrast, the Japanese and Italian banks had been maintaining the lowest levels of
CAR among the OECD banks during the observed period. The CARs for the Japanese banks
up to 1997 averaged less than 9 percent, and it went up by less than 2 percent to around 10.5

30
percent since 1999, still lower than the average for the overall OECD banks included in this
study. Our result confirms that the relatively weaker capital position of the Japanese banks has
indeed contributed to the prolonged weakening of their lending to the East Asian countries.
This finding is also consistent with the Japanese banking crisis in 1998 and the introduction of
legislation to restructure banks’ balance sheets, which was aggravated by a weakening yen.
Second, we find contrasting evidence on the distance variable. This factor was an
insignificant determinant of the lending of US banks during the pre-crisis period, but became
an important factor since 1999. The opposite is true for the UK and the Japanese banks.
Certainly, more empirical testing should be done to look further into each lender’s case to
arrive at conclusive analyses of the role of geographical distance in influencing the size of
bank lending. Here, we find that two out of the three lender countries analyzed, namely the
UK and Japan, support the argument that there has been a shift from purely international
cross-border activities to a local/regional lending strategy on the part of OECD banks.
Third, as the DR model postulates, a rise in financial risk is linked with higher bank
lending flows from the US, UK and the Japanese banks. All three groups of banks have
become more sensitive to the financial risk factor in their overall lending activities to the East
Asian countries during the post-crisis period.
In addition, three other factors also figure prominently in explaining the pronounced
differences in the post-1997 pattern of bank lending by these three groups of banks. One is the
trade variable. This factor has contributed significantly to the decline in new loans from the
US, UK and the Japanese banks to East Asian countries. The average trade/GDP ratios of
Japan, U.K. and U.S. with East Asia all declined during the post-1997 period. The trade ratios
for the U.S. and the U.K. dropped at annual rates of 7 and 8 percent, respectively, contributing
significantly to the boom and bust of their bank lending to our group of Asian economies. For
31
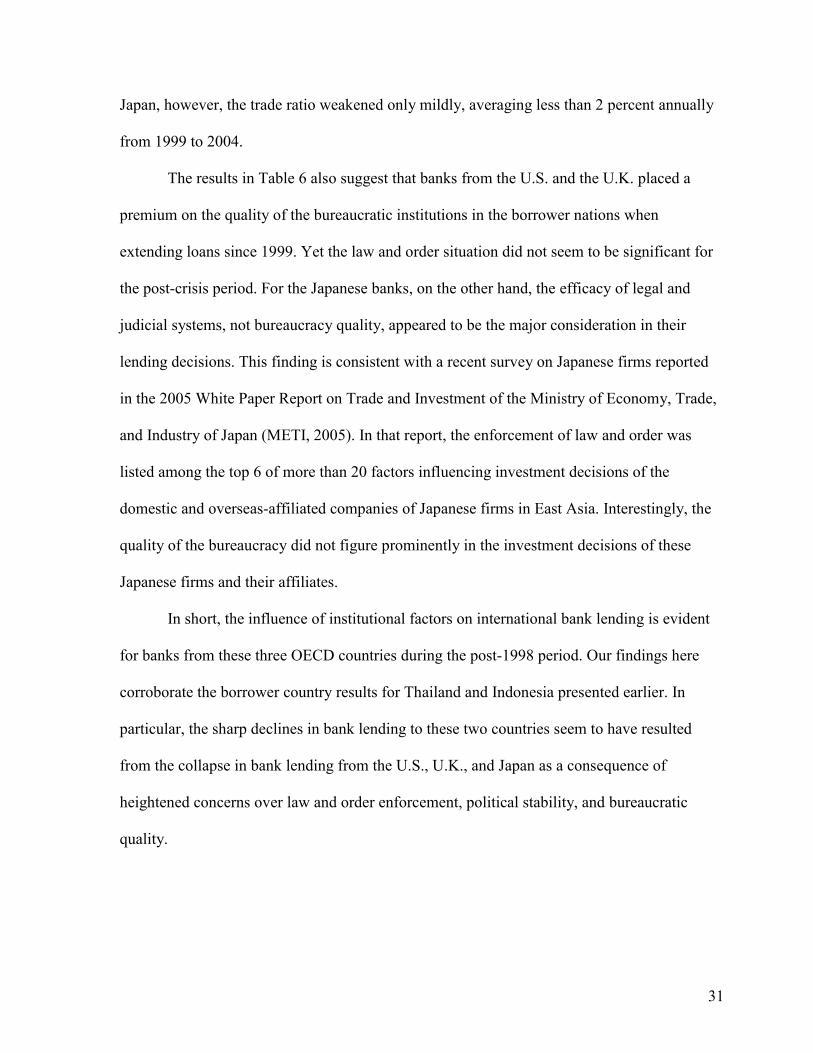
Japan, however, the trade ratio weakened only mildly, averaging less than 2 percent annually
from 1999 to 2004.
The results in Table 6 also suggest that banks from the U.S. and the U.K. placed a
premium on the quality of the bureaucratic institutions in the borrower nations when
extending loans since 1999. Yet the law and order situation did not seem to be significant for
the post-crisis period. For the Japanese banks, on the other hand, the efficacy of legal and
judicial systems, not bureaucracy quality, appeared to be the major consideration in their
lending decisions. This finding is consistent with a recent survey on Japanese firms reported
in the 2005 White Paper Report on Trade and Investment of the Ministry of Economy, Trade,
and Industry of Japan (METI, 2005). In that report, the enforcement of law and order was
listed among the top 6 of more than 20 factors influencing investment decisions of the
domestic and overseas-affiliated companies of Japanese firms in East Asia. Interestingly, the
quality of the bureaucracy did not figure prominently in the investment decisions of these
Japanese firms and their affiliates.
In short, the influence of institutional factors on international bank lending is evident
for banks from these three OECD countries during the post-1998 period. Our findings here
corroborate the borrower country results for Thailand and Indonesia presented earlier. In
particular, the sharp declines in bank lending to these two countries seem to have resulted
from the collapse in bank lending from the U.S., U.K., and Japan as a consequence of
heightened concerns over law and order enforcement, political stability, and bureaucratic
quality.

32
Overall Lessons Learned: Integrated and Comparative Analyses
Based on the wealth of findings and discussion presented earlier, a number of key features and
determinants of OECD bank lending to East Asia should be highlighted. To start with, it is
important to underline that some of our test results are time-specific and country-specific. The
significance of the explanatory variables often shifts from the pre- to post-crisis period.
Similarly, estimation results for explanatory variables are sensitive to different groupings of
borrowers and lenders. This general conclusion reinforces the need to go beyond full sample
panel analyses, and instead to focus more on narrow sets of observations, as carried out in this
study.
We find the capital adequacy ratio to be a common important push factor affecting
bank loans when the full sample is considered. However, when we look at the pre- and post-
crisis periods, the coefficients became insignificant. Interestingly, this push factor is also
found to be highly sensitive to the source countries of lender banks. The loans of US and
Japanese banks, for instance, are highly dependent on capital ratios, but this is not true for UK
banks.
Similarly, there is a close link between trade activity and new bank lending. As for the
case of the ,i tCAR variable, the robustness of the trade-lending nexus is source-bank and
destination-country specific. If we break up the sample, the role of the trade variable
diminished during the post-crisis (Table 4). However, the opposite is true when we examine
different lender and borrower specific cases (Tables 5 and 6).
It is also clear that the institutional variables have, in general, assumed greater
importance over time in explaining bank lending to East Asia from the OECD banks. Yet, we
find the three major groups of lenders to be influenced by different institutional factors. The
US and the UK banks are more concerned with bureaucratic quality, while the Japanese banks
33
seem more sensitive to legal risk. In particular, we find lending activities in Indonesia and
Thailand during the post-crisis period to have increasingly been determined by the two
institutional risk factors.
Only in the case of the distance variable do we have relatively more conclusive
findings demonstrating that geographical proximity played a significant role in explaining
lending of the OECD banks to East Asia during the pre-crisis period, but not during the post-
crisis. The increasingly decentralized decision-making processes of OECD banks have very
likely contributed to this phenomenon. Furthermore, the results suggest that there is a decline
in the importance of information costs between the two sub-periods.
It is therefore safe to conclude that the characteristics and determinants of bank
lending from the OECD to East Asia are predominantly lender and borrower specific.
Moreover, we find shifts in the significance of the determinants during the pre-1997 crisis
period and the post-crisis era, reflecting changes in the nature and business of international
bank lending.
V. CONCLUDING REMARKS
Despite record-breaking performances in their stock markets during recent years, the banking
sector remains a critical part of the financial system in the nine East Asian countries studied in
this paper. With most of these countries opening their capital accounts and liberalizing their
banking sectors in the late 1980s, foreign banks have been an important source of financing.
This paper extends early research on the factors affecting foreign lending by examining the
determinants of lending by OECD banks to East Asia both before and after the Asian financial
crisis.
34
Our study finds a number of push and pull determinants of the lending of the OECD
banks to the East Asian countries. The results also suggest that political instability and
weaknesses in the legal, judicial, and bureaucratic systems help explain the continued
stagnation in lending after the financial crisis. Thus, institutional reforms are critical for East
Asia to successfully compete for international bank financing. Lastly, our analyses have also
shown that the characteristics and determinants of bank lending from the developed world to
East Asia are largely lender and borrower specific. Therefore, it is essential for future research
to examine lender and borrower groups individually across different periods to gain more
insight into the driving forces of international banking activities and hence, policy measures
that are needed to encourage and manage them.

35
REFERENCES
Acemoglu, D., Johnson, S., and Robinson, J.A., and Thaicharoen, Y. (2003), “Institutional
Causes, Macroeconomic Symptoms: Volatility, Crises and Growth,” Journal of Monetary Economics 50, pp. 49–123.
Anderson, J. and Van Wincoop, E. (2003), “Gravity with Gravitas: A Solution to the Border
Puzzle,” American Economic Review, 93(1), pp.170-192. Ariyosi, A., Habermeier, K., Laurens, B., Otket-Robe, I., Canales-Kriljenko, J.I., and
Kirilenko, A. (2000), “Capital Controls: Country Experiences with Their Use and Liberalization,” IMF Occasional Paper 190, Washington D.C.
Aviat, A. and N. Courdacier (2007), “The Geography of Trade in Goods and Asset Holdings,”
Journal of International Economics, 71, pp. 22-51.
Bank of Thailand (2001), “Bulletin of the Financial Institutions’ Service Analysis Team, Second Quarter,” Bangkok, Thailand.
Bergstrand, J.H. (1985), “The Gravity Equation in International Trade: Some Microeconomic
Foundations and Empirical Evidence,” The Review of Economics and Statistics, 67(3), pp. 474-81.
Bhattacharya, U., and H. Daouk (2002), “The World Price of Insider Trading,” Journal of Finance 57, pp. 75–108.
Cailloux, J and S. Griffith-Jones (2003), “International Bank Lending and the East Asian
Crisis,” in S. Griffith-Jones, R. Gottschalk and J. Cailloux (eds.), International Capital Flows in Calm and Turbulent Times: The Need for New International Architecture, Ann Arbor : University of Michigan Press.
Cerutti, E., Dell’Ariccia, and Marinez-Peria, M.S. (2007), “How Banks Go Abroad: Branches
or Subsidiaries?” Journal of Banking and Finance, 31, pp. 1669–1692. Coval, J., and T. Moskowitz (1999), “Home Bias at Home: Local Equity Preference in
Domestic Portfolios,” Journal of Finance 54, pp. 2045–2073.
Coval, J., and T. Moskowitz (2001), “The Geography of Investment: Informed Trading and Asset Prices,” Journal of Political Economy 109, pp. 811–841.
Deardorff, A.V. (1998), “Determinants of Bilateral Trade: Does Gravity Work in a
Neoclassical World?” in Jeffrey A. Frankel (eds.), The Regionalization of the World Economy, NBER, pp.7-22.

36
Diamond, D.W., and Rajan, R.G. (2000a), “A Theory of Bank Capital,” the Journal of Finance 55, pp. 2431–2465.
Diamond, D.W., and Rajan, R.G. (2000b), “Banks, Short-Term Debt and Financial Crises: Theory, Policy Implications and Applications,” NBER Working Paper No. 7764.
European Central Bank (ECB) (2004), The Euro Area Bank Lending Survey, October.
Feenstra, R., Markusen, J., and Rose, A. (2001), “Using the Gravity Equation to Differentiate
Among Different Theories of Trade,” Canadian Journal of Economics, Vol. 34, No.2. Glick, R., and A.K. Rose (2002), “Does a Currency Union Affect Trade? The Time Series
Evidence,” European Economic Review 46, pp. 1111–1123.
Grinblatt, M., and M. Keloharju (2001), “How Distance, Language and Culture Influence Stockholdings and Trades,” Journal of Finance 56, pp. 1053–1073.
Hau, H. (2001), “Location Matters: An Examination of Trading Profits,” Journal of Finance 56, pp. 1959–1983.
Herrero, A.G. and Martinez-Peria, M.S. (2007), “The Mix of International Banks’ Foreign Claims: Determinants and Implications,” Journal of Banking and Finance, 31, pp. 1613–1631.
Im, K.Y., Pesaran, M.H., and Shin, Y. (2003), “Testing for Unit Roots in Heterogeneous
Panels,” Journal of Econometrics 115, pp. 53–74. Jeanneau, S and Micu, M. (2002), “Determinants of International Bank Lending to Emerging
Market Countries,” BIS Working Paper No. 112. Kawai, M. and Liu, L-G. (2002), “Determinant of International Commercial Lending to
Developing Countries,” mimeo. Kishan, R.P. and Opiela, T.P. (2000), “Bank Size, Bank Capital, and the Bank Lending
Channel,” Journal of Money, Credit and Banking, 32, 1, February, pp.121-141. Leuth, E and Ruiz-Arranz, M. (2006), “A Gravity Model of Workers’ Remittances,” IMF
Working Paper No.06/290, December.
Lewis, K.K. (1999), “Trying to Explain the Home Bias in Equities and Consumption,” Journal of Economic Literature 37, pp. 571–608.
Levine, R. (2005), “Finance and Growth: Theory and Evidence,” in Philippe Aghion and Steve Durlauf (eds.), Handbook of Economic Growth, the Netherlands: Elsevier Science.
37
Liu, C.G. (2005), “Scaling the Great Wall: An Analysis of Foreign Banks’ Entry into China,” North Carolina Bank Institute, Vol. 9, pp.397-418.
Lubin, D. (2002), “Bank Lending to Emerging Markets: Crossing the Border,” Discussion Paper No. 2002/61, World Institute for Development Economics Research, the United Nations University.
Martin, P. and Helene, R. (2004), “Financial Super-Markets: Size Matters for Asset Trade,”
Journal of International Economics, 64, pp.335-361.
Mathieson, D.J. and Roldos, J. (2001), “The Role of Foreign Banks in Emerging Markets,” Mimeo (http://www1.worldbank.org/finance/assets/images/Mathieson_presentation.pdf.)
Ministry of Economy, Trade and Industry (METI) (2005), “White Paper on International Trade,” Japan (http://www.meti.go.jp/english/report/index.html).
Montreevat, S. and Rajan, R.S. (2003), “Financial Crisis, Bank Restructuring and Foreign
Bank Entry: An Analytic Case Study of Thailand”, CIES Working Paper, no.131, School of Economics, University of Adelaide, June.
Morgan, D.P., Bertrand, R., and Straham, P.E. (2003), “Bank Integration and State Business Cycles,” NBER Working Paper No. 9704.
Obstfeld, M. and K. Rogoff (2000), “The Six Major Puzzles in International
Macroeconomics: Is There a Common Cause?” NBER Macroeconomics Annual 15, pp. 339–390.
Papaioannou, E. (2004), “International Bank Flows: Determinants and Institutional Role,”
Mimeo, London Business School.
Peek, J., and Rosengren, E. (2000), “Implications of the Globalization of the Banking Sector: the Latin American Experience,” New England Economic Review, September/October.
Perotti, E.C. and van Oijen, P. (2001), “Privatization, Political Risk, and Stock Market Development in Emerging Economies,” Journal of International Money and Finance 20, pp. 43–69.
Podpiera, R. (2006), “Progress in China’s Banking Sector Reform: Has Bank Behavior Changed?” IMF Working Paper 06/71.
Portes, R. and H. Rey (2002), “The Determinants of Cross-Border Transaction Equity Flows,” mimeo London Business School.
Portes, R. and H. Rey (2005), “The Determinants of Cross-Border Equity Flows,” Journal of
International Economics 65, pp. 269–296.

38
Razin, A. (2002), “FDI Contribution to Capital Flows and Investment in Capacity,” NBER
Working Paper 9204.
Rose, A.K. (2004), “Do We Really Know That the WTO Increases Trade?” American Economic Review 94, pp. 98–114.
Rose, A.K. and M.M. Spiegel (2004), “A Gravity Model of Sovereign Lending: Trade Default, and Credit,” IMF Staff Papers 51, pp. 50–63.
Shleifer, A. and Wolfenzon, D. (2002), “Investor Protection and Equity Markets,” Journal of Financial Economic 66, pp. 3–27.
Wei, S-J. (2000a), “How Taxing is Corruption on International Investors,” Review of Economics and Statistics 82, pp. 1–11.
Wei, S-J. (2001), “Local Corruption and Global Capital Flows,” Brookings Papers on Economic Activity 2, pp. 303–354.
Wei, S-J. and Wu, Y. (2001), “Negative Alchemy? Corruption, Composition of Capital Flows,
and Currency Crises,” NBER Working Paper 8187.

39
Appendix: Data Description and Sources
Variable Description Source
,
, ,
ij t
i t j t
assetgdp gdp
Annual bank lending flows of source OECD countries’ banks to East Asian borrower economies (normalized by the countries’ gross domestic products).
The World Bank’s World Development Indicators database and the Bank for International Settlement database
ijdist The geographical distance (in kilometers) between the economic centers of a lender country and a borrower economy
Jon Haveman’s International Trade Data web-site (http://www.macalester.edu/research/economics/ PAGE/HAVEMAN/Trade.Resources/TradeData.html)
,
, ,
ij t
i t j t
tradegdp gdp
Bilateral imports of goods between OECD and East Asian economies
The World Bank database
,i tCAR Asset-weighted average of the total capital adequacy ratios of the major source banks in each OECD country
Bankscope database
,j tfr Index of financial risk ranges from 0 to 50. A higher index associates with a lesser financial risk. The risk includes factors such as external debt (over GDP), foreign debt service (as a percentage of exports of goods and services), the current account (as a percentage of exports), net international liquidity (months of import coverage), and exchange rate stability
The International Country Risk Guide of the PRS group
,j tlo Index of law and order ranges from 1 to 6; a higher index implies a stronger legal system
The International Country Risk Guide of the PRS group
,j tbq Index of bureaucratic quality ranges from 0 to 4; A higher index implies a better overall bureaucracy
The International Country Risk Guide of the PRS group

40
Table 1. Basic Trends for Borrower Countries
Country Average Annual Growth Rates
(in %)
Average Annual Value of Bank Loans
(in US$ billions)
1991-1997 1998-1999 2000-2004 1990-1997 1998-1999 2000-2004
Indonesia
10.91 –18.92 –11.02 29.27 29.40 17.07
Malaysia
16.83 –11.66 5.80 10.41 12.99 13.18
Philippines
9.31 –5.90 –4.31 7.68 11.38 8.94
Thailand
25.63 –33.36 –10.56 31.09 25.98 11.91
Singapore
1.48 –27.92 –2.76 119 65.63 48.02
South-Korea 15.77 –16.77 4.05 34.22 38.10 35.07
Taiwan
13.56 –10.58 19.41 13.29 14.20 16.67
Hong Kong
4.14 –24.43 –3.17 155.13 86.53 63.36
China
14.97 –17.83 11.50 27.44 32.97 30.41
Source: The World Bank and the Bank for International Settlement Database.

41
Table 2. Basic Trends of Annual New Bank Lending for Lender Countries
Country Average Annual Growth Rates (in %)
Average Annual New Bank Lending (in US$ billions)
1991-1997 1998-1999 2000-2004 1990-1997 1998-1999 2000-2004
Belgium
19.0 –39.9 9.43 13.30 7.4 8.4
France
13.7 –16.8 –3.23 43.4 46.8 30.9
Italy
–0.9 –33.0 –3.9 13.1 6.6 5.3
Japan
2.11 –29.60 –5.99 267.72 134.94 83.12
Netherlands
20.4 –5.6 10.1 13.8 25.4 22.5
UnitedKingdom 31.26 –12.69 4.61 45.73 70.90 64.83
United States 10.25 –17.34 9.23 30.58 25.15 29.57
Source: The World Bank and the Bank for International Settlement Database.

42
Table 3. Summary Statistics
Table 4. Full Sample Estimates
Specification (1) Random effects
(2) Random effects
(3) Random effects
(3) Fixed effects
(3) Dynamic
panel
(3) Pre-crisis
(3) Post-crisis
Lagged loan share … … … … 0.62*
(0.07) … …
Distance –0.70* (0.30)
–0.50 (0.26)
–0.51 (0.25) … … –0.55*
(0.25) –0.29 (0.23)
Trade share …
0.45* (0.07)
0.43* (0.07)
0.39* (0.15)
0.34* (0.10)
0.54* (0.10)
0.42* (0.10)
Capital ratio … 0.26* (0.08)
0.25* (0.08)
0.23 (0.12)
–0.02 (0.06)
–0.07 (0.07)
–0.07 (0.10)
Financial risk
…
… –0.52* (0.18)
–0.51 (0.30)
–0.43* (0.15)
–0.60* (0.18)
–1.32* (0.59)
Law and order
…
… –0.17 (0.10)
–0.17 (0.16)
0.05 (0.08)
–0.42* (0.13)
0.49* (0.12)
Bureaucratic quality
… … 0.12*
(0.03) 0.12
(0.07) 0.14* (0.05)
0.02 (0.04)
0.62* (0.10)
Constant 0.81 (2.40)
0.43 (2.32)
2.30 (2.33)
–1.78 (1.03)
–0.18* (0.07)
4.50 (2.32)
1.62 (3.10)
R-squared 0.49 0.57 0.58 0.37 … 0.62 0.50
Number of observations 846 846 846 846 720 468 378
chi-squared test
473.43 (0.0000)
546.87 (0.0000)
644.11 (0.0000)
20.26 (0.0000)
570.86 (0.0000)
252.86 (0.0000)
2245.43 (0.0000)
Notes: The dependent variable is total bank loans normalized by GDP and all variables are in logarithms except for the bureaucratic quality index. Estimated coefficients for the country and time dummy variables are not reported. Figures in parentheses are heteroskedasticity-robust standard errors except for the case of the chi-squared tests of the overall regression’s significance, where they represent the marginal significance level (the F-test is reported for the fixed effects estimation). An asterisk indicates statistical significance at the 5% level.
Mean Standard Deviation Maximum Minimum
,ij tasset (annual new lending as % of GDP) 0.02829 0.05694 0.65546 0.00012
ijdist (kilometers) 9454.105 3012.143 16370.82 1158.401
,ij ttrade ( % of GDP) 0.03017 0.02848 0.16201 0.00192
,i tCAR 12.103 4.254 33.9 3.6
,j tfr [0,50] 41.378 5.823 49 22
,j tlo [1,6] 4.230 1.161 6 1
,j tbq [0,4] 2.704 0.849 4 0

43
Table 5. Borrower Country Estimates
Borrower Countries Indon + Thai (Full Sample)
Indon + Thai (Pre-crisis)
Indon + Thai (Post-crisis)
HK + Sing (Full Sample)
HK + Sing (Pre-crisis)
HK + Sing (Post-crisis)
China + Tai (Full Sample)
China + Tai (Pre-crisis)
China + Tai (Post-crisis)
Distance
–1.88* (0.63)
–1.56* (0.77)
–0.63 (0.86)
–1.23 (0.91)
–1.46* (0.74)
–0.76 (0.76)
–0.27 (0.73)
–0.38 (0.92)
–0.03 (0.47)
Trade share 0.19 (0.18)
0.57* (0.17)
0.76* (0.22)
0.21 (0.22)
0.46 (0.27)
0.63* (0.21)
–0.04 (0.16)
0.14 (0.18)
0.07 (0.28)
Capital ratio 0.49* (0.16)
0.16 (0.13)
–0.25 (0.26)
0.37* (0.14)
–0.01 (0.11)
–0.08 (0.13)
–0.03 (0.15)
–0.09 (0.14)
–0.52* (0.22)
Financial risk 0.12 (0.45)
1.06 (0.80)
–2.48* (0.96)
2.17 (2.48)
1.02 (2.33)
–0.13 (3.62)
–0.90 (0.74)
–0.35 (1.67)
4.78 (2.60)
Law and order –0.44* (0.21)
–1.07* (0.43)
0.58* (0.19)
1.67* (0.79)
0.50 (1.43)
1.64* (0.38)
0.59 (0.71)
0.02 (1.61)
0.54 (0.53)
Bureaucratic quality
–0.00 (0.06)
–0.03 (0.08)
0.61* (0.15)
–0.43* (0.20)
–0.18 (0.27)
0.07 (0.51)
0.07 (0.20)
0.05 (0.18)
0.66 (0.57)
Constant
11.84 (6.07)
8.31 (7.62)
11.13 (8.73)
–0.65 (12.58)
8.28 (9.50)
3.15 (16.68)
–1.41 (6.82)
–0.71 (8.95)
–24.88* (10.91)
R-squared 0.51 0.56 0.41 0.43 0.38 0.28 0.04 0.10 0.02 Number of observations 188 104 84 188 104 84 188 104 84
chi-squared test 560.64 (0.0000)
133.16 (0.0000)
538.93 (0.0000)
509.38 (0.0000)
63.98 (0.0000)
264.60 (0.0000)
182.12 (0.0000)
37.98 (0.0005)
602.80 (0.0000)
Notes: All estimates are based on the random effects model. The dependent variable is total bank loans normalized by GDP and all variables are in logarithms except for the bureaucratic quality index. Estimated coefficients for the country and time dummy variables are not reported. Figures in parentheses are heteroskedasticity-robust standard errors except for the case of the chi-squared tests of the overall regression’s significance, where they represent the marginal significance level. An asterisk indicates statistical significance at the 5% level.

44
Table 6. Lender Country Estimates
Notes: The dependent variable is total bank loans normalized by GDP and all variables are in logarithms except for the bureaucratic quality index. Estimated coefficients for the country and time dummy variables are not reported. Blanks represent dropped variables due to multicollinearity. Figures in parentheses are heteroskedasticity-robust standard errors except for the case of the chi-squared tests of the overall regression’s significance, where they represent the marginal significance level. An asterisk indicates statistical significance at the 5% level.
Lender Countries US (Pre-crisis)
UK (Pre-crisis)
Japan (Pre-crisis)
US (Post-crisis)
UK (Post-crisis)
Japan (Post-crisis)
Distance 1.03 (1.44) 1.68* (0.46)
0.92* (0.37)
3.94* (1.85)
1.47 (0.87)
–0.52 (0.37)
Trade share 0.32* (0.11)
0.19* (0.09)
–0.14 (0.17)
0.90* (0.21)
0.35* (0.09)
0.49* (0.23)
Capital ratio … –8.74* (1.87) … 6.19*
(2.94) –0.15 (0.12)
2.50* (0.79)
Financial risk –0.48 (0.88)
–0.05 (0.16)
–0.76 (0.59)
–5.27* (1.21)
–1.61* (0.72)
–5.21* (0.69)
Law and order –1.95* (0.72)
–0.72* (0.16)
–0.08 (0.46)
0.30 (0.43)
–0.07 (0.13)
0.69* (0.22)
Bureaucratic Quality
0.33* (0.10)
0.03 (0.06)
0.25 (0.14)
0.62* (0.12)
0.24* (0.06)
–0.22 (0.18)
Constant –11.13 (15.06) … –9.64*
(3.75) –37.54 (19.69)
–10.93 (9.68)
13.15* (5.20)
R-squared 0.82 0.97 0.85 0.84 0.97 0.92
Number of observations 54 81 81 54 54 54
chi-squared test 611.91 (0.0000)
3285.08 (0.0000)
656.05 (0.0000)
28658.56 (0.0000)
.6 (0.0000)
19042.27 (0.0000)

45
Figure 1. Annual International Bank Lending from Seven OECD Countries’ Banks and from Japanese Banks to East Asia
(in billions of US$)
0
100
200
300
400
500
600
90 91 92 93 94 95 96 97 98 99 00 01 02 03 04
Total Japan
Source: The World Bank and the Bank for International Settlement Database.
Figure 2. Annual Lending of the US and UK Banks to East Asia (in billions of US$)
10
20
30
40
50
60
70
80
90
90 91 92 93 94 95 96 97 98 99 00 01 02 03 04
US UK
Source: The World Bank and the Bank for International Settlement Database.

46
Figure 3. Annual New Lending
from Seven OECD countries’Banks to Indonesia and Thailand (in billions of US$)
0
10
20
30
40
50
60
90 91 92 93 94 95 96 97 98 99 00 01 02 03 04
Indonesia Thailand
Source: The World Bank and the Bank for International Settlement Database.
Figure 4. Annual New Lending from Seven OECD countries’ Banks to Hong Kong and Singapore
(in billions of US$)
0
40
80
120
160
200
240
90 91 92 93 94 95 96 97 98 99 00 01 02 03 04
Hong Kong Singapore
Source: The World Bank and the Bank for International Settlement Database.

47
Figure 5. Annual New Lending
from Seven OECD countries’ Banks to China and Taiwan (in billions of US$)
0
10
20
30
40
50
90 91 92 93 94 95 96 97 98 99 00 01 02 03 04
China Taiwan
Source: The World Bank and the Bank for International Settlement Database.
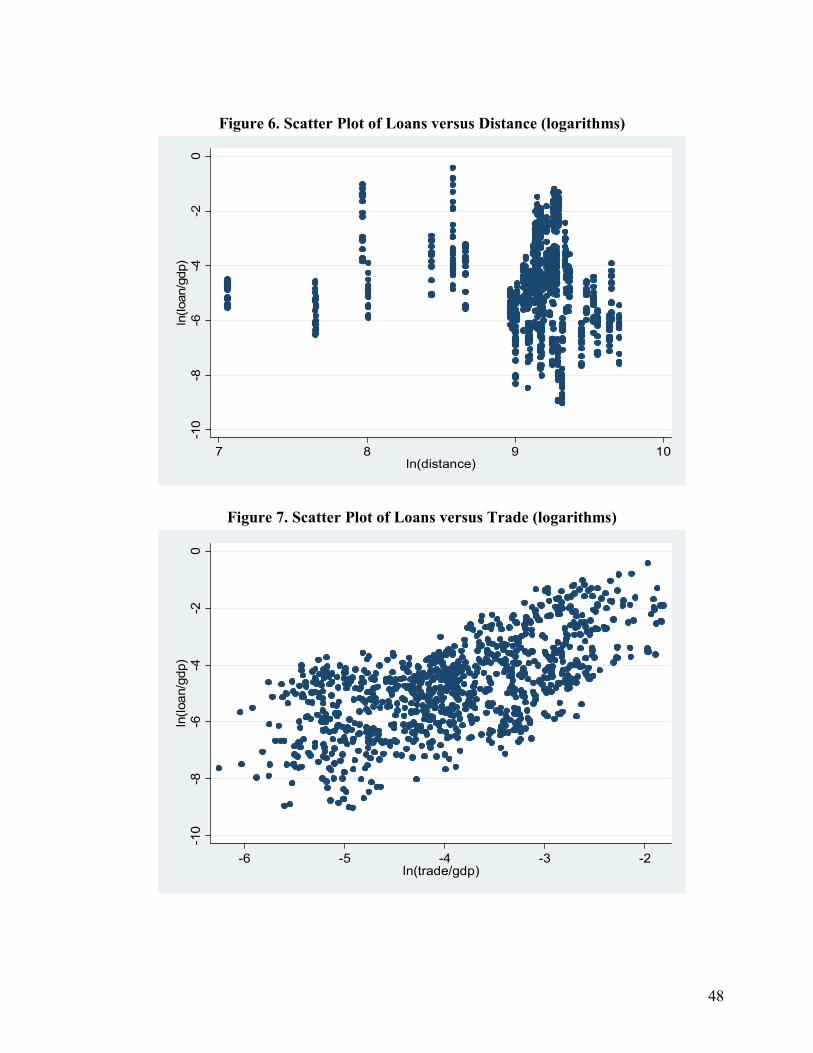
48
Figure 6. Scatter Plot of Loans versus Distance (logarithms)
-10
-8-6
-4-2
0ln
(loan
/gdp
)
7 8 9 10ln(distance)
Figure 7. Scatter Plot of Loans versus Trade (logarithms)
-10
-8-6
-4-2
0ln
(loan
/gdp
)
-6 -5 -4 -3 -2ln(trade/gdp)