munich personal repec archive - uni-muenchen.de · munich personal repec archive wto and regional...
TRANSCRIPT
MPRAMunich Personal RePEc Archive
WTO and regional trade negotiationoutcomes: quantitative assessments ofpotential implications on Bangladesh
Selim Raihan and Mohammad A Razzaque
South Asian Network on Economic Modeling (SANEM),Department of Economics, University of Dhaka, Bangladesh
June 2007
Online at https://mpra.ub.uni-muenchen.de/38475/MPRA Paper No. 38475, posted 30. April 2012 13:31 UTC
WTO AND REGIONAL TRADE NEGOTIATION
OUTCOMES:
QUANTITATIVE ASSESSMENTS OF POTENTIAL IMPLICATIONS ON
BANGLADESH
Edited by Selim Raihan
Abdur Razzaque
F I R S T P U B L I S H E D B Y P A T H A K S H A M A B E S H
A N D U N N A Y A N S H A M A N N A Y D H A K A , B A N G L A D E S H , A U G U S T 2 0 0 7
C o p y r i g h t 2 0 0 7 © S e l i m R a i h a n a n d A b d u r R a z z a q u e A l l r i g h t s r e s e r v e d
W T O A N D R E G I O N A L T R A D E N E G O T I A T I O N O U T C O M E S : Q U A N T I T A T I V E
A S S E S S M E N T S O F P O T E N T I A L I M P L I C A T I O N S O N B A N G L A D E S H
6
Despite being somewhat paradoxical, the world has in recent times witnessed ambitious multilateral trade negotiations along with a proliferation of regional trading blocs. Almost all countries are now involved in both types of trading arrangements, with Bangladesh actively participating in several important trade talks under the World Trade Oganisation (WTO) alongside its commitments to the South Asian Free Trade Area (SAFTA). Different multilateral and regional trade negotiations have, however, different implications. For example, while the liberalisation of global agricultural trade – by reducing subsidies in rich countries and thereby causing prices to rise – will benefit many developing country farmers, it may hurl a formidable challenge for the net food importing countries in ensuring food security for their poor populations. Similarly, WTO negotiations in non-agricultural goods aim at improving market access for many, but for the least developed countries, including Bangladesh, currently enjoying tariff preferences in a large range of products in major markets, the ensuing outcomes could lead to preference erosion, undermining their competitiveness. Regional trading arrangements can also be challenging as they tend to replace global imports with less efficient regional supplies resulting in adverse welfare consequences. Effective trade negotiations partly depend on a priori assessments of possible negotiation outcomes. As such, it is very important to provide the policymakers and trade negotiators with informed inputs on the potential implications of negotiating issues. Since trade negotiations comprise subject matters of conflicting interests – often amongst countries at comparable levels of development that otherwise share and support similar views and positions – only country-specific objective analyses based on appropriate research methods can inform the negotiators in the best possible way. This book is an endeavour in that direction. It focuses on some of the major issues in the on-going multilateral and regional trade negotiations, and employs state-of-the-art analytical tools to empirically assess their likely implications for Bangladesh. While the analyses and results presented would be useful for policymakers and trade negotiators, this volume would also be of interest to trade analysts involved in empirical research.
C O N T E N T S
7
CONTENT
List of Figures 11 List of Tables 13 List of Boxes 16 Contributors 17 Abbreviation 18 Preface 21
Chapter 1: Multilateral and Regional Trade Negotiations:
The Perspectives from Bangladesh 23- 30 Selim Raihan and Abdur Razzaque
1.1. Introduction 23 1.2. Objectives of the Study 27 1.3. Methodology 28 1.4 Outline of the Book 29
Chapter 2: Methodology of Linking Global CGE Model to a Country CGE
Model for Poverty and Welfare Analysis 31-46 Selim Raihan
2.1. Introduction 31 2.2. The GTAP Model 32
2.2.1. Household Income and Expenditure 32 2.2.2. The Government Consumption 33 2.2.3. Savings and Investment 33 2.2.4. Producers’ Income 34 2.2.5 Production Technology 34 2.2.6. International Trade 34 2.2.7. Base Data and Base Year Adjustments 34 2.2.8. Data, Region and Commodity Aggregation 35
2.3. The Bangladesh Dynamic CGE Model 37
W T O A N D R E G I O N A L T R A D E N E G O T I A T I O N O U T C O M E S : Q U A N T I T A T I V E
A S S E S S M E N T S O F P O T E N T I A L I M P L I C A T I O N S O N B A N G L A D E S H
8 2.3.1 Basic Features of the Model 38
2.3.1.1. Static Aspects of the Model 38 2.3.1.2. Dynamic Aspects of the Model 39
2.3.2. A Numerical Representation of the Bangladesh Economy 40 2.4. Linking the Global Model with the Country Model 45
Chapter 3: Global Agricultural Trade Liberalisation:
Implications for the Bangladesh Economy 47-75 Selim Raihan and Abdur Razzaque
3.1. Introduction 47 3.2. World Agricultural Trade: Some Stylized Facts 49 3.3. Negotiations on Global Agricultural Trade Liberalisation 52 3.4. Agriculture and the Bangladesh Economy 55 3.5. Welfare Effects of Global Agricultural Trade Liberalisation:
Estimates from the GTAP Model 57 3.5.1. Simulation Design for Agricultural Trade Liberalisation 58 3.5.2. GTAP Simulation Outcomes for Agricultural Trade Liberalisation 58
3.6. Macroeconomic, Sectoral, Poverty and Welfare Effects of Global Agricultural Trade Liberalisation: Estimates using the Bangladesh Dynamic CGE Model 63
3.6.1. Results of the Bangladesh Dynamic Model for AGRLIB1 64 3.6.2. Results of the Bangladesh Dynamic Model for AGRLIB2 67 3.6.3. Results of the Bangladesh Dynamic Model for AGRLIB 3 68
3.7. Conclusion 69
Chapter 4: LDCs’ Duty-free and Quota-free (DFQF) Access to Developed Countries’ Markets: Perspectives from Bangladesh 76-103 Selim Raihan and Abdur Razzaque
4.1. Introduction 76 4.2. Some Stylized Facts about the LDCs 77 4.3. The Current Status of Negotiations and
the Concerns of the Developing Countries 81 4.4. Global and Regional Welfare Effects of DFQF Market Access:
Estimates from the GTAP Model 84 4.4.1. Simulation Design for the DFQF Scenarios 84 4.4.2. GTAP Simulation Outcomes for the DFQF Scenarios 86
C O N T E N T S
9 4.5. The Impacts of DFQF Market Access Scenarios on the Bangladesh
Economy: Estimates using the Bangladesh Dynamic CGE Model 88 4.5.1. Results from the Bangladesh Dynamic Model for DFQF1 Scenario 89 4.5.2. Results from the Bangladesh Dynamic Model for DFQF2 Scenario 94 4.5.3. Results from the Bangladesh Dynamic Model for DFQF3 Scenario 95
4.6. The Bangladesh Strategies and Concerns 95 4.7. Conclusion 98
Chapter 5: WTO Negotiations on the Non-agricultural Market Access
(NAMA): Implications for the Bangladesh Economy 104-135 Selim Raihan, Abdur Razzaque and Rabeya Khatoon
5.1. Introduction 104 5.2. Negotiations on NAMA: Background and the Current State of Art 105 5.3. The Tariff Cut Formulas 107 5.4. The Concerns over Possible Preference Erosion for LDCs 109 5.5. Welfare Effects and Preference Erosion of Bangladesh for NAMA
Scenarios: Estimates from the GTAP Model 116 5.5.1. GTAP Simulation Design for Different NAMA Scenarios 116 5.5.2. Welfare Effects of NAMA Scenarios: GTAP Simulation Outcomes 120 5.5.3. Estimating the Preference Erosion of Bangladesh in the EU market 121
5.6. The Impacts of NAMA Scenarios on the Bangladesh Economy: Estimates using the Bangladesh Dynamic CGE Model 124
5.6.1. Results of the Bangladesh Dynamic Model for NAMA1 125 5.6.2. Results of the Bangladesh Dynamic Model for NAMA 2 128 5.6.3. Results of the Bangladesh Dynamic Model for NAMA 3 128
5.7. Conclusion 129
Chapter 6: SAFTA and Other Regional Trading Arrangements (RTAs) in South Asia: The Stakes of Bangladesh 136-160 Selim Raihan and Abdur Razzaque
6.1. Introduction 136 6.2. The South Asian Free Trade Area (SAFTA) 137
6.2.1. Salient Features of the Agreement on SAFTA 139 6.2.1.1. Trade Liberalisation Programme 139 6.2.1.2. Sensitive Lists 141 6.2.1.3. Non-Tariff and Para-Tariff barriers 141
W T O A N D R E G I O N A L T R A D E N E G O T I A T I O N O U T C O M E S : Q U A N T I T A T I V E
A S S E S S M E N T S O F P O T E N T I A L I M P L I C A T I O N S O N B A N G L A D E S H
10 6.2.1.4. Rules of Origin 142 6.2.1.5. Institutional Arrangement 142 6.2.1.6. Mechanism for Compensation of Revenue loss 143 6.2.1.7. Technical Assistance for LDCs 143 6.2.1.8. Safeguard Measures 143 6.2.1.9. Consultations and Dispute Settlement Procedures 144
6.3. Bay of Bengal Initiatives on Multi-Sectoral Technical and Economic Cooperation (BIMSTEC) 144
6.3.1. Core Elements of the Framework Agreement 145 6.3.1.1. Trade in goods 146 6.3.1.2. Trade in Services and Investment 147 6.3.1.3. Dispute Settlement Mechanism 147 6.3.1.4. Institutional Arrangement 148
6.3.2. Current Sate of Negotiations on BIMSTEC 148 6.4. Bangladesh’s Negotiations on Bilateral FTAs with India,
Pakistan and the USA 149 6.5. Inter-Regional Trade in South Asia: Some Stylized Facts 150 6.6. Welfare Effects of Regional Trading Arrangements (RTA) 153 6.7. Trade Creation and Trade Diversion Effects under SAFTA:
Estimates using the GTAP Model 155 6.7.1. GTAP Simulation Design for Different SAFTA Scenarios 156 6.7.2. Decomposition of the Welfare Effects into Trade Creation and
Trade Diversion 156 6.8 Conclusion 160
Chapter 7: Two Years After MFA Phase Out:
Concerns for Bangladesh 161-174 Abdur Razzaque and Selim Raihan
7.1. Bangladesh’s Apparel Exports: Looking Backward in Order to Look Forward 161
7.2. Concerns about Bangladesh’s Survival in a Quota-free World 164 7.3. Actual Export Performance after the MFA Phase-Out 165 7.4. Factors behind the Post-MFA Developments and Future Implications 166 7.5. MFA Phase Out: A Blessing for Bangladesh? 173
C O N T E N T S
11Chapter 8: WTO’s “Aid for Trade”: Issues and Concerns 175-181
Selim Raihan and Rabeya Khatoon 8.1. Introduction 175 8.2. Negotiations on Aid for Trade 176 8.3. The Current Status and the Achievements 178 8.4. The Concerns over Aid for Trade 179 8.5. Policy Implications and Conclusion 180
Chapter 9: WTO Negotiations on Trade in Services:
The Bangladesh Perspective 182-198 Abdur Razzaque and Selim Raihan
9.1. Introduction 182 9.2. Importance of Services Sector for the Bangladesh Economy 184 9.3. Services Trade Under Mode4: Existing Barriers and Scope of Liberalisation 185 9.4. Review of the Hong Kong Ministerial Outcomes 187 9.5. Bangladesh’s Position on Hong Kong Ministerial Issues 181
9.5.1. LDC Modalities: Implementation Progress 181 9.5.2. Market Access for LDCs 193 9.5.3. Technical Assistance 194 9.5.4. Domestic Regulations 194 9.5.5. LDC Negotiation Strategies: Bangladesh Perspectives 196 9.5.6. LDCs in Plurilateral Negotiations 197
9.6. Concluding Remarks 197
Chapter 10: Market Access Problems of Bangladesh’s Export Products: A Study on Some Selected Sub-Sectors 199-230 Abu Eusuf, Mahbub Alam, Mokammel K. Toufique and Rabeya Khatoon
10.1 Introduction 199 10.2. Prospects of Exports from Seven Thrust Sectors 200
10.2.1. Agro Processing 200 10.2.2. Herbal Medicine 206 10.2.3. Light Engineering 208 10.2.4. Home Textile 211
W T O A N D R E G I O N A L T R A D E N E G O T I A T I O N O U T C O M E S : Q U A N T I T A T I V E
A S S E S S M E N T S O F P O T E N T I A L I M P L I C A T I O N S O N B A N G L A D E S H
12 10.2.5. Jute Diversified Products 213 10.2.6. Specialized Crafts 215 10.2.7. Manpower Export 216
10.3. Market Access Problems of Bangladesh’s Export Products 217 10.3.1. Standards and Quality of Products 217 10.3.2. Export Demand Response to Changes in World Income and Price 220 10.3.3. Advent of Substitutes in World Market 222 10.3.4. Trade Policies of the Trading Partners 223 10.3.5. Pressure Groups and Social Campaign 227 10.3.6. Restrictions on Movement of Natural Persons 228
10.4. Conclusion and Bangladesh’s Strategy 229
Chapter 11: Summary and Conclusion 231-239 Selim Raihan and Abdur Razzaque
REFERENCE 240 INDEX 245
C O N T E N T S
13
L IST OF F IGURES
Figure 3.1: Annual Percentage Change in World Trade in Agricultural
Products 50 Figure 3.2: Developed Countries’ Spending as Domestic Support on
Agriculture (Notified domestic support, 1999, and export subsidies, 1998. US$ million) 55
Figure 3.3: Global Welfare Gains from different Agricultural Liberalisation Scenarios 61
Figure 3.4: Short and Long run Impacts of AGRILB1 Scenario on Households’ Head-count Poverty 66
Figure 4.1: LDCs’ Share in World Exports (1951-2005) 79 Figure 4.2: Composition of Merchandise Exports in LDC and other
Developing Countries (Percentage of total merchandise exports) 81
Figure: 4.3: RMG Export Growth under DFQF scenarios (percentage point change from the BAU scenario) 90
Figure 4.4: More Concentration of the Export Basket? (Export growth of other sectors under DFQF1) 91
Figure 4.5: Short and Long run Impacts of DFQF1 Scenario on Households’ Head-count Poverty 93
Figure 5.1: Preference Erosion and Gains of Bangladesh’s RMG Exports in different Markets under NAMA1 122
Figure 5.2: Preference Erosion and Gains of Bangladesh’s RMG Exports in different markets under NAMA2 123
Figure 5.3: Preference Erosion and Gains of Bangladesh’s RMG Exports in different markets under NAMA3 123
Figure 5.4: More Concentration of the Export Basket? (Export growth of other sectors under NAMA1) 126
W T O A N D R E G I O N A L T R A D E N E G O T I A T I O N O U T C O M E S : Q U A N T I T A T I V E
A S S E S S M E N T S O F P O T E N T I A L I M P L I C A T I O N S O N B A N G L A D E S H
14 Figure 5.5: Short and Long run Impacts of NAMA1 Scenario on
Households’ Head-count Poverty 127 Figure 6.1: Country-wise Share (%) in Intra-SAARC Imports in 2003 151 Figure 6.2: Country-wise Share (%) in Intra-SAARC Exports in 2003 152 Figure 6.3: Trade Creation and
Trade Diversion Effects of SAFTA1 Scenario 157 Figure 6.4: Trade Creation and
Trade Diversion Effects of SAFTA2 Scenario 159 Figure 7.1(a): Apparel, Non-apparel and Total Exports 162 Figure 7.1(b): Share of Apparel and Non-apparel Exports in Total Exports 162 Figure 7.2: RMG Exports by Woven and Knitwear Products 166 Figure 7.3: Growth in Apparel Exports: 2000-2006 (percent) 166 Figure 7.4: Growth of China’s Exports in the EU and USA 167 Figure 7.5: Share of EU Market (in value terms) by different Countries 169 Figure 7.6: Share of US market (in value terms) by different Countries 169 Figure 7.7: Nominal Exchange Rates for different Currencies 172 Figure 7.8: Real Exchange Rates of Taka vis-à-vis
Some Selected Countries 172 Figure 8.1: Aid for Trade: Narrow and Broad Definitions 177 Figure 10.1: Goat Skin Production in Bangladesh 202 Figure 10.2: Percentage of Horticultural Production that are Processed 204 Figure 10.3: Vegetables Export from Bangladesh (Value, Thousand US $) 205 Figure 10.4: Share of Small and Cottage Industries in Total Number of
Engineering Plants (1989-90) 206 Figure 10.5: Share of Small and Cottage Industries in Total People
employed in Engineering Plants (1989-90) 207 Figure 10.6: Annual Turnover in the Herbal Medicine Sector (Million Taka) 208 Figure 10.7: EU Imports Value of Medicinal & Aromatic Plants
(Thousand Euro), 2002 209 Figure 10.8: Import Value of Herbal Chemicals by the Major
Importers of the World (Billion US $), 2003 210 Figure 10.9: Export Performance of Home Textiles (Million US$) 212 Figure 10.10: Major Export Destinations of Home Textile in 1999-00 213 Figure 10.11: Export Earnings from Jute Products (Million Taka) 214 Figure 10.12: Bangladesh Export Earnings from Handicrafts 215 Figure 10.13: Bangladesh's Export Destinations of Handicraft
Products in 2002-03 ('000 US$) 216
C O N T E N T S
15
L IST OF TABLES
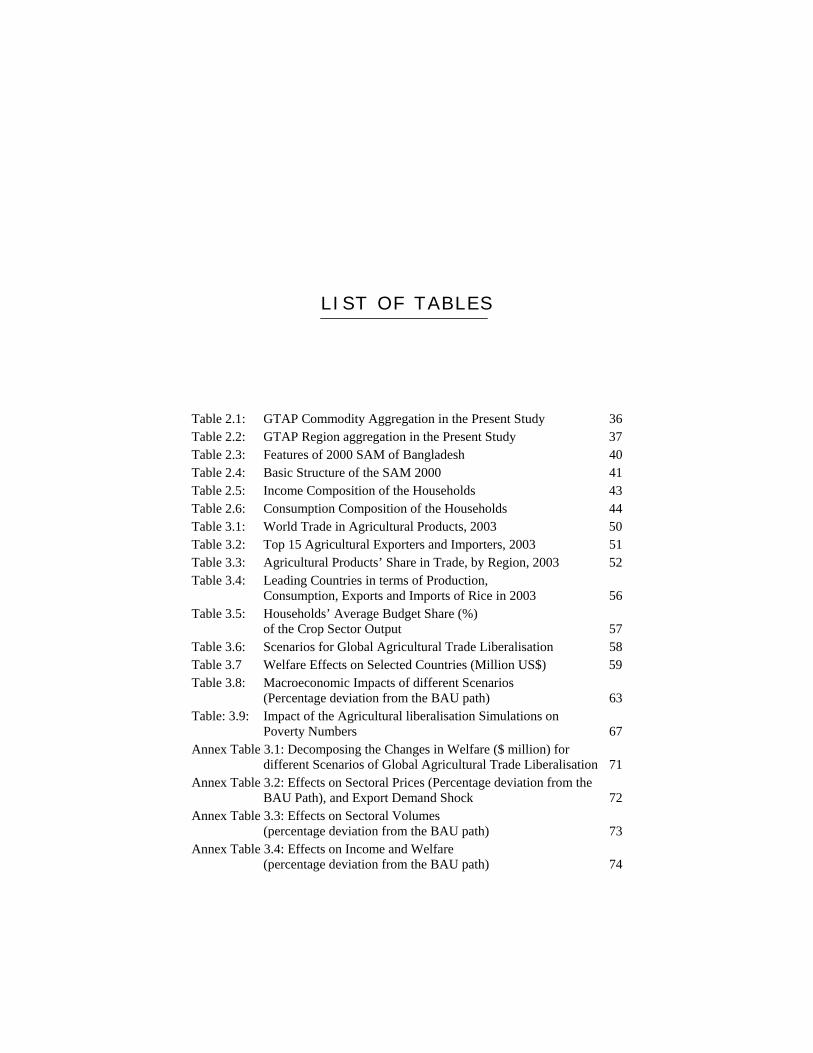
Table 2.1: GTAP Commodity Aggregation in the Present Study 36 Table 2.2: GTAP Region aggregation in the Present Study 37 Table 2.3: Features of 2000 SAM of Bangladesh 40 Table 2.4: Basic Structure of the SAM 2000 41 Table 2.5: Income Composition of the Households 43 Table 2.6: Consumption Composition of the Households 44 Table 3.1: World Trade in Agricultural Products, 2003 50 Table 3.2: Top 15 Agricultural Exporters and Importers, 2003 51 Table 3.3: Agricultural Products’ Share in Trade, by Region, 2003 52 Table 3.4: Leading Countries in terms of Production,
Consumption, Exports and Imports of Rice in 2003 56 Table 3.5: Households’ Average Budget Share (%)
of the Crop Sector Output 57 Table 3.6: Scenarios for Global Agricultural Trade Liberalisation 58 Table 3.7 Welfare Effects on Selected Countries (Million US$) 59 Table 3.8: Macroeconomic Impacts of different Scenarios
(Percentage deviation from the BAU path) 63 Table: 3.9: Impact of the Agricultural liberalisation Simulations on
Poverty Numbers 67 Annex Table 3.1: Decomposing the Changes in Welfare ($ million) for
different Scenarios of Global Agricultural Trade Liberalisation 71 Annex Table 3.2: Effects on Sectoral Prices (Percentage deviation from the
BAU Path), and Export Demand Shock 72 Annex Table 3.3: Effects on Sectoral Volumes
(percentage deviation from the BAU path) 73 Annex Table 3.4: Effects on Income and Welfare
(percentage deviation from the BAU path) 74
W T O A N D R E G I O N A L T R A D E N E G O T I A T I O N O U T C O M E S : Q U A N T I T A T I V E
A S S E S S M E N T S O F P O T E N T I A L I M P L I C A T I O N S O N B A N G L A D E S H
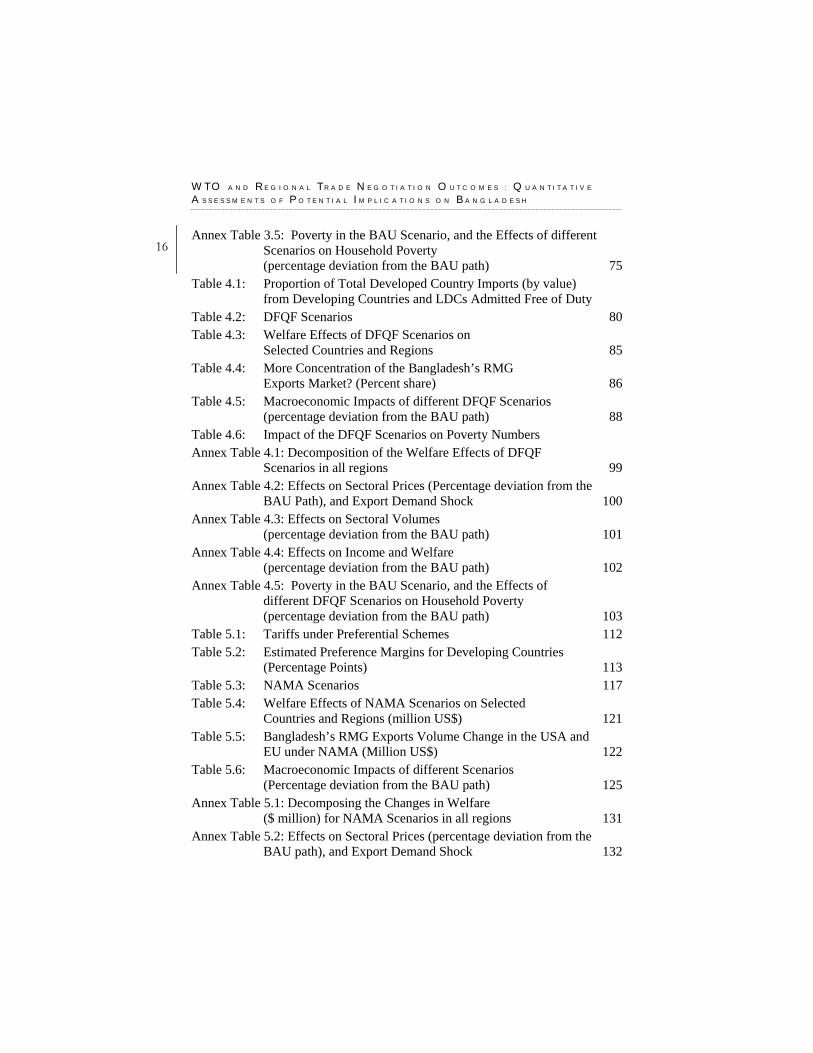
16 Annex Table 3.5: Poverty in the BAU Scenario, and the Effects of different
Scenarios on Household Poverty (percentage deviation from the BAU path) 75
Table 4.1: Proportion of Total Developed Country Imports (by value) from Developing Countries and LDCs Admitted Free of Duty
Table 4.2: DFQF Scenarios 80 Table 4.3: Welfare Effects of DFQF Scenarios on
Selected Countries and Regions 85 Table 4.4: More Concentration of the Bangladesh’s RMG
Exports Market? (Percent share) 86 Table 4.5: Macroeconomic Impacts of different DFQF Scenarios
(percentage deviation from the BAU path) 88 Table 4.6: Impact of the DFQF Scenarios on Poverty Numbers Annex Table 4.1: Decomposition of the Welfare Effects of DFQF
Scenarios in all regions 99 Annex Table 4.2: Effects on Sectoral Prices (Percentage deviation from the
BAU Path), and Export Demand Shock 100 Annex Table 4.3: Effects on Sectoral Volumes
(percentage deviation from the BAU path) 101 Annex Table 4.4: Effects on Income and Welfare
(percentage deviation from the BAU path) 102 Annex Table 4.5: Poverty in the BAU Scenario, and the Effects of
different DFQF Scenarios on Household Poverty (percentage deviation from the BAU path) 103
Table 5.1: Tariffs under Preferential Schemes 112 Table 5.2: Estimated Preference Margins for Developing Countries
(Percentage Points) 113 Table 5.3: NAMA Scenarios 117 Table 5.4: Welfare Effects of NAMA Scenarios on Selected
Countries and Regions (million US$) 121 Table 5.5: Bangladesh’s RMG Exports Volume Change in the USA and
EU under NAMA (Million US$) 122 Table 5.6: Macroeconomic Impacts of different Scenarios
(Percentage deviation from the BAU path) 125 Annex Table 5.1: Decomposing the Changes in Welfare
($ million) for NAMA Scenarios in all regions 131 Annex Table 5.2: Effects on Sectoral Prices (percentage deviation from the
BAU path), and Export Demand Shock 132
C O N T E N T S
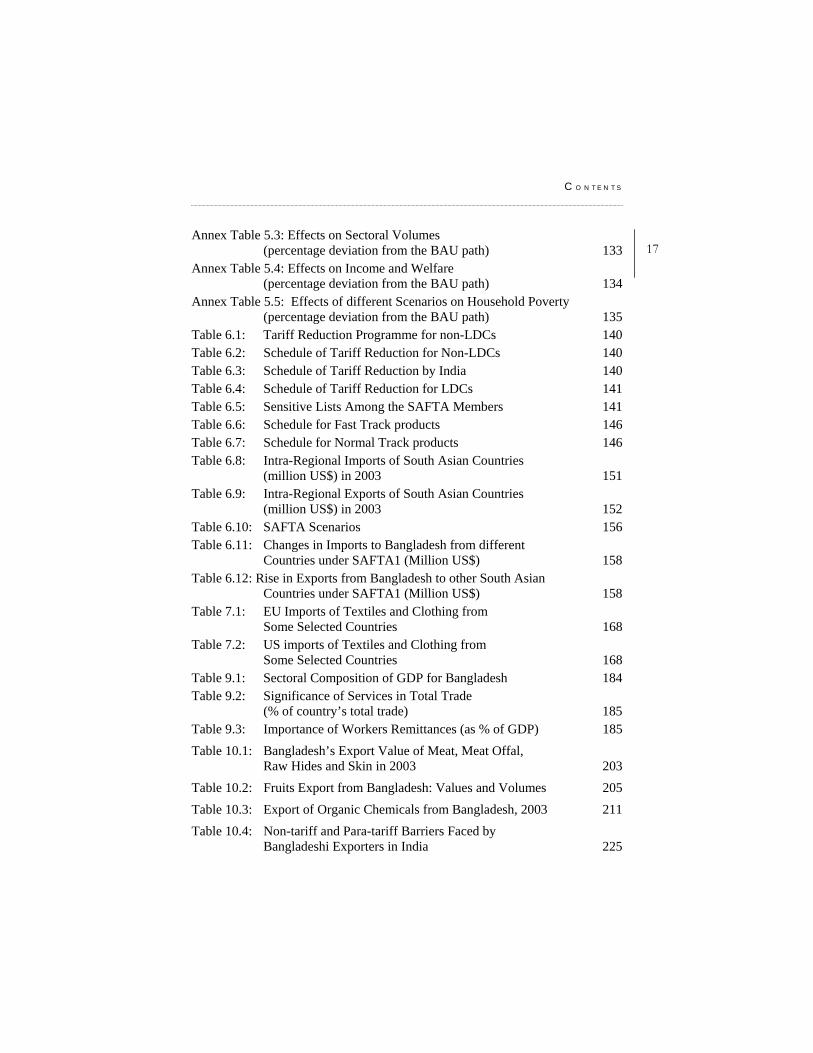
17Annex Table 5.3: Effects on Sectoral Volumes
(percentage deviation from the BAU path) 133 Annex Table 5.4: Effects on Income and Welfare
(percentage deviation from the BAU path) 134 Annex Table 5.5: Effects of different Scenarios on Household Poverty
(percentage deviation from the BAU path) 135 Table 6.1: Tariff Reduction Programme for non-LDCs 140 Table 6.2: Schedule of Tariff Reduction for Non-LDCs 140 Table 6.3: Schedule of Tariff Reduction by India 140 Table 6.4: Schedule of Tariff Reduction for LDCs 141 Table 6.5: Sensitive Lists Among the SAFTA Members 141 Table 6.6: Schedule for Fast Track products 146 Table 6.7: Schedule for Normal Track products 146 Table 6.8: Intra-Regional Imports of South Asian Countries
(million US$) in 2003 151 Table 6.9: Intra-Regional Exports of South Asian Countries
(million US$) in 2003 152 Table 6.10: SAFTA Scenarios 156 Table 6.11: Changes in Imports to Bangladesh from different
Countries under SAFTA1 (Million US$) 158 Table 6.12: Rise in Exports from Bangladesh to other South Asian
Countries under SAFTA1 (Million US$) 158 Table 7.1: EU Imports of Textiles and Clothing from
Some Selected Countries 168 Table 7.2: US imports of Textiles and Clothing from
Some Selected Countries 168 Table 9.1: Sectoral Composition of GDP for Bangladesh 184 Table 9.2: Significance of Services in Total Trade
(% of country’s total trade) 185 Table 9.3: Importance of Workers Remittances (as % of GDP) 185 Table 10.1: Bangladesh’s Export Value of Meat, Meat Offal,
Raw Hides and Skin in 2003 203 Table 10.2: Fruits Export from Bangladesh: Values and Volumes 205 Table 10.3: Export of Organic Chemicals from Bangladesh, 2003 211 Table 10.4: Non-tariff and Para-tariff Barriers Faced by
Bangladeshi Exporters in India 225
W T O A N D R E G I O N A L T R A D E N E G O T I A T I O N O U T C O M E S : Q U A N T I T A T I V E
A S S E S S M E N T S O F P O T E N T I A L I M P L I C A T I O N S O N B A N G L A D E S H
18
L IST OF BOXES
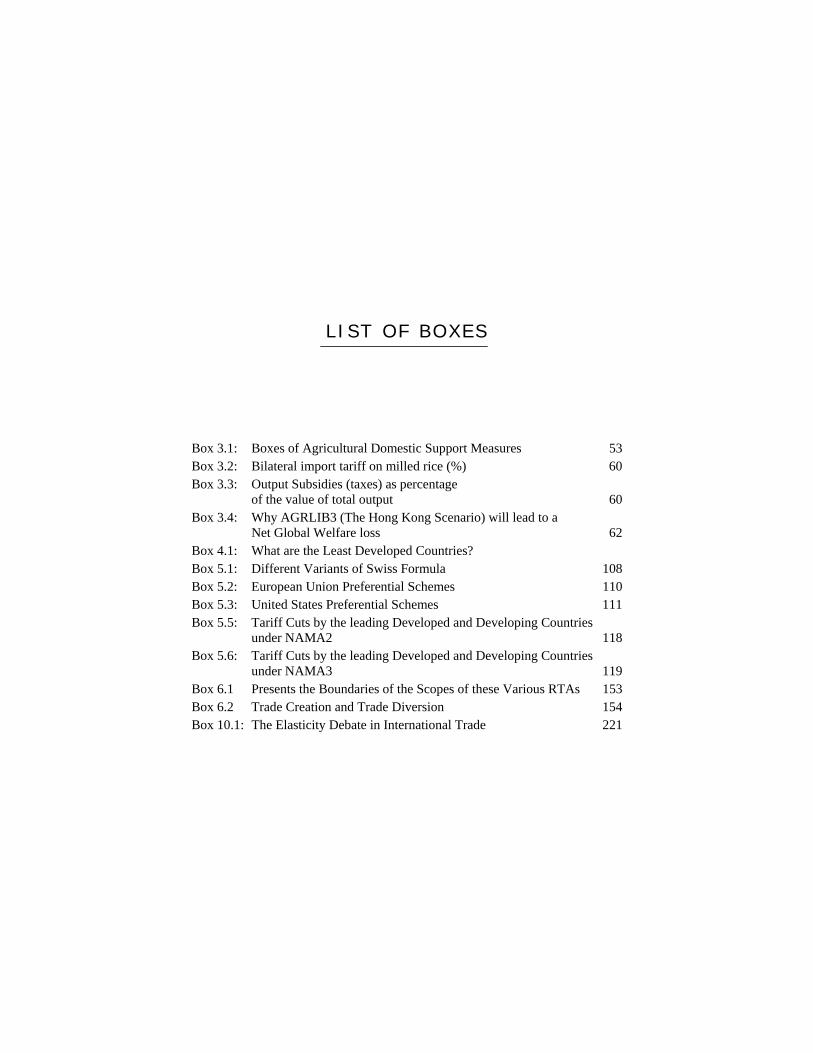
Box 3.1: Boxes of Agricultural Domestic Support Measures 53 Box 3.2: Bilateral import tariff on milled rice (%) 60 Box 3.3: Output Subsidies (taxes) as percentage
of the value of total output 60 Box 3.4: Why AGRLIB3 (The Hong Kong Scenario) will lead to a
Net Global Welfare loss 62 Box 4.1: What are the Least Developed Countries? Box 5.1: Different Variants of Swiss Formula 108 Box 5.2: European Union Preferential Schemes 110 Box 5.3: United States Preferential Schemes 111 Box 5.5: Tariff Cuts by the leading Developed and Developing Countries
under NAMA2 118 Box 5.6: Tariff Cuts by the leading Developed and Developing Countries
under NAMA3 119 Box 6.1 Presents the Boundaries of the Scopes of these Various RTAs 153 Box 6.2 Trade Creation and Trade Diversion 154 Box 10.1: The Elasticity Debate in International Trade 221
C O N T E N T S
17
CONTRIBUTORS
The researchers who contributed in this book are Selim Raihan, Abdur Razzaque, Mokammel K. Toufique and Rabeya Khatoon of the Department of Economics, University of Dhaka, Abu Eusuf of the Department of Development Studies, University of Dhaka, and Mahbub Alam of the South Asian Network on Economic Modeling.
W T O A N D R E G I O N A L T R A D E N E G O T I A T I O N O U T C O M E S : Q U A N T I T A T I V E
A S S E S S M E N T S O F P O T E N T I A L I M P L I C A T I O N S O N B A N G L A D E S H
18
ABBREVIATIONS ABI Argentina, Brazil and India ACP African, Caribbean and Pacific ADD Anti-Dumping Duty AfT Aid for Trade BAU Business as Usual BBS Bangladesh Bureau of Statistics BGMEA Bangladesh Garment Manufactures and Exporters Association BIMSTEC Bay of Bengal Initiatives on Multi-Sectoral Technical and
Economic Cooperation BIS Bureau of Indian Standards BIST-EC Bangladesh India Sri Lanka Thailand Economic Cooperation BSTI Bangladesh Standards and Testing Institution CBI Caribbean Basin Initiative CDE Constant Difference of Elasticity CDP Committee for Development Policy CES Constant Elasticity of Substitution CET Constant Elasticity of Transformation CGE Computable General Equilibrium CIF Cost, Insurance and Freight COE Committee of Experts CPI Consumer Price Index CVD Counter Veiling Duty DFQF Duty Free Quota Free EBA Everything But Arms
C O N T E N T S
19EC European Community ECOSOC Economic and Social Council EPB Export Promotion Bureau EU European Union EV Equivalent Variation FTA Free Trade Area GATS General Agreement on Trade in Services GATT General Agreement on Tariffs and Trade GDP Gross Domestic Product GNI Gross National Income GSP Generalized System of Preference GSTP Generalized System of Trade Preferences GTAP Global Trade Analysis Project HIES Household Income and Expenditure Survey HS Harmonised System ICTSD International Centre for Trade and Sustainable Development IF Integrated Framework ILO International Labour Organization IMF International Monetary Fund I-S Investment–Savings ISO International Organization for Standardization ITC International Trade Center ITU International Telecommunication Union L/C Letter of Credit LDC Least Developed Country LES Linear Expenditure System MFA Multi-Fibre Arrangement MFN Most Favoured Nation MOC Ministry of Commerce MoP Margin of preference MRA Mutual Recognition Agreements NAFTA North American Free Trade Area NAMA Non-Agricultural Market Access NGMA Negotiating Group on Market Access NIEs Newly Industrialising Economies
W T O A N D R E G I O N A L T R A D E N E G O T I A T I O N O U T C O M E S : Q U A N T I T A T I V E
A S S E S S M E N T S O F P O T E N T I A L I M P L I C A T I O N S O N B A N G L A D E S H
20 NTB Non-Tariff Barriers OECD Organisation for Economic Co-operation and Development PTA Preferential Trading Arrangement QR Quantitative Restriction RMG Ready-Made Garments RoO Rules of Origin ROW Rest of the World RTA Regional Trading Agreements S&DT Special and Differential Treatment SAARC South Asian Association for Regional Cooperation SAFTA South Asian Free Trade Area SAM Social Accounting Matrix SAP Structural Adjustment Programme SAPTA SAARC Preferential Trading Arrangement SMC SAFTA Ministerial Council SPS Sanitary and Phyto-Sanitary SPSM Sanitary and Phyto-Sanitary Measures SPV Service Provider Visa SSA Sub-Saharan Africa T&C Textile and Clothing TBT Technical Barriers to Trade TIFA Trade and Investment Framework Agreement TNC Trade Negotiating Committee UAE United Arab Emirates UN United Nations UNCTAD United Nations Conference on Trade and Development UNDP United Nations Development Program UNICEF United Nations International Children’s Emergency Fund US United States USA United States of America WTO World Trade Organisation

C O N T E N T S
21
PREFACE Trade negotiations are not easy. Yet these negotiations have significant implications for countries like Bangladesh. Effective policy negotiations depend partly on the policy makers’ perception about the implications of different negotiation outcomes. It is, therefore, imperative that the policy makers are provided with various alternative scenarios of policy outcomes. The present study does exactly this using global and country general equilibrium models.
It has been found in this research that despite significant gains in global welfare due to full liberalisation of agricultural products Bangladesh stands to lose from it as it is a net importer of the same. Even a partial liberalisation will lead to welfare loss and increased poverty in Bangladesh.
On the other hand the impacts of different Duty Free Quota Free scenarios on Bangladesh and other LDCs could lead to positive welfare gains. If such access is only to the USA market the welfare gains could be even larger. The implications of such gains will have positive impact on poverty alleviation in Bangladesh.
This study as also estimated the impacts of different scenarios of the negotiations on Non-agricultural market access (NAMA). It appears that the NAMA scenarios, in general, will lead to large preference erosion for Bangladesh’s RMG exports in EU and Canadian Markets, where Bangladesh now has DFQF access. However, NAMA scenarios also lead to large gain for Bangladesh in the USA market.
Similar application of the global general equilibrium model has been made to find the welfare implication of full implementation of SATFA. The results are not beneficial for Bangladesh because of the large negative trade diversion effect which offsets the positive trade creation effect. Unless Bangladesh can raise her export share into the Indian market substantially there will be not much scope of improving welfare gains from this process of liberalisation.
W T O A N D R E G I O N A L T R A D E N E G O T I A T I O N O U T C O M E S : Q U A N T I T A T I V E
A S S E S S M E N T S O F P O T E N T I A L I M P L I C A T I O N S O N B A N G L A D E S H
22 With respect to an analysis on post MFA period the study also
throws some light on the possible impact of removal of trade restrictions on China by the EU and the US from the beginning of 2009. Bangladesh will be facing a serious challenge in the changed context, as there are similarities between types of products exported to the US market by China and Bangladesh.
The study also suggests Aid for Trade to be incorporated in the national growth and development strategy of Bangladesh. For that matter a better relationship between Bangladesh and aid-giving agencies has to be fostered, particularly to promote employment creation objective.
The study also reflects on negotiations on global liberalisation of services. Bangladesh, with huge number of low-skilled labour, is likely to gain from ‘non-reciprocal’ mode 4 liberalisation. Bangladesh can seek for this special provision under LDC modalities.
The study has also explored the problems of market access of seven Bangladeshi products with export potentials. The problems identified include, among others, standards and quality of product, demand deficiencies in importing countries, advent of substitutes in international markets, trade policies of importing countries, anti-export campaigns by pressure groups, and restrictions against the movement of natural persons from Bangladesh and other developing countries to the developed countries. The study suggests specific market analysis in the EU and other markets to open up new opportunities. It also calls for stronger negotiation with EU to relax rules of origin for LDCs like Bangladesh. In addition to the developed countries’ markets (i.e. the USA), Bangladesh also should try to get DFQF access to advanced developing countries’ (i.e. India) markets.
I am grateful to all the authors namely Dr. Selim Raihan for doing an excellent job. I owe a gratitude to UNDP, Regional Office, Colombo, for providing the necessary research grants. I am grateful to Ratnakar Adhikari and his colleague Yumiko Yamamoto at the UNDP, Regional office, Colombo, for their sincere support. Many thanks go to Shaheen-ul-Alam and Waliul Islam of Unnayan Shammanay for providing necessary administrative assistance to the authors. I must thank Shahidul Islam Bizu of Pathak Shamabesh for publishing this book with so much of care. I am sure this study will be a valuable source of reference for the policy makers and as well as other stakeholders.
Atiur Rahman
Chairman Unnayan Shammanay
CHAPTER ONE
Selim Raihan and Abdur Razzaque WTO and Regional Trade Negotiations: The Perspectives from Bangladesh
1.1. Introduction
Over the last two decades Bangladesh has been involved in a number of multilateral and regional trade negotiations. There is no denying that multilateral trade negotiations under WTO as well as regional and bilateral trade negotiations have important implications for the Bangladesh economy. With the help of some sophisticated economic tools, this study has conducted some quantitative assessments of the potential implications of these trade negotiations for the Bangladesh economy.
There are a number of multilateral trade negotiations under WTO in which Bangladesh has either offensive or defensive interests. It appears that Bangladesh has defensive interests (i.e., the country is likely to suffer if the agreements are implemented) in the negotiations on global agricultural trade liberalisation and on non-agricultural market access (NAMA). On the other hand, Bangladesh’s offensive interests (i.e., the country is likely to gain if the agreements are implemented) lie in the
W T O A N D R E G I O N A L T R A D E N E G O T I A T I O N O U T C O M E S : Q U A N T I T A T I V E
A S S E S S M E N T S O F P O T E N T I A L I M P L I C A T I O N S O N B A N G L A D E S H
24 negotiations on providing duty-free-quota-free (DFQF) market access to the LDCs, on mode 4 under the services trade liberalisation, and on aid for trade. Similar to the multilateral trade negotiations, Bangladesh has some offensive and defensive interests in her regional and bilateral trade negotiations.
With respect to the negotiations on global agricultural trade liberalisation, it appears that, as a net importer of agricultural products, Bangladesh is likely to lose out from such negotiations. A number of studies have predicted that, with the elimination of export and production subsidies, prices of agricultural commodities are likely to increase in the international market. This will be beneficial to a number of developing countries that have clear comparative advantage in this sector. Liberalisation will also imply further market access opportunities for these countries as a result of reduced tariff barriers in the developed country markets. However, not all developing countries are net-exporters of agricultural products, and many of them actually depend on the world market for their supplies. Consequently, agricultural trade liberalisation could adversely affect these countries.
Bangladesh, together with many other LDCs, has long been arguing for ensuring DFQF market access for their products in the developed countries. Bangladesh is one of the very few LDCs for which high tariffs in USA continue to be a major problem for its most important export items, as the USA has excluded them from its most attractive preferential schemes. As a consequence, Bangladesh’s exports of textile and clothing in the USA market are subject to an average tariff peak of 16 percent with many individual items facing rates as high as 35-40 percent. This high tariff seriously affects Bangladesh’s relative competitiveness. In the Hong Kong Ministerial Conference (MC) in December 2005, developed countries made binding commitment with regard to providing DFQF access to products originating from LDCs. However, the Hong Kong MC allowed ‘members facing difficulties’ to reduce the LDC product coverage for duty-free treatment to 97 percent of tariff lines. As Bangladesh’s exports are heavily concentrated on a few textile and clothing categories, the Hong Kong MC declaration is likely to imply no additional benefits at all.
Bangladesh is very much concerned about the possibility of her preference erosion in the EU and Canadian market because of the WTO negotiations with respect to non-agricultural market access (NAMA).
W T O A N D R E G I O N A L T R A D E N E G O T I A T I O N S : T H E P E R S P E C T I V E F R O M
B A N G L A D E S H
25The NAMA negotiations are proceeding towards the elimination or the reduction of bound tariff rates, bringing unbound tariff rates under binding commitments which will be subject to formula cuts, and identifying and removing Non-tariff Barriers (NTBs). The consensus on NAMA modalities, reached so far, include the use of a ‘Swiss-type’ formula for the reduction in the bound tariff rates, consideration of a non-linear mark up approach for establishing base rates of the unbound tariff rates, special and differential treatments for the developing countries in terms of allowing them ‘less than full reciprocity’ of commitments, and to keep LDCs above any commitment to undertake tariff cuts. It is, however, important to note that though the LDCs are exempted from tariff cuts under the NAMA negotiations, they are likely to suffer from possible preference erosion in countries (for example in the EU) where they are currently enjoying DFQF market access.
Bangladesh has entered into or in the process of several regional and bilateral trading arrangements, i.e., SAFTA, BIMSTEC, FTAs with India, Pakistan and the USA. Among these negotiations SAFTA has been initiated in July 2006. All other trading negotiations are yet to be materialised. There have been some strong arguments for the regional economic integration in South Asia, as this integration is thought to generate significant intraregional trade and welfare gains for the South Asian countries. It is expected that the SAFTA mechanism, when fully implemented, will provide Bangladesh improved market access, help boost its exports to the region, and improve the country’s intraregional trade balance. SAFTA is expected to generate substantial new trade, the so-called static gains. The dynamic gains could be even higher than the static gains due to the possible expansion in the scale of operation by getting access to the markets of the relatively larger member countries. However, critics have pointed out that the potential benefits from the SAFTA are little because of a number of reasons. For example, it is pointed out that there are limited complementarities in the region. Therefore, even under the free trade mechanism the expansion of intra-regional trade would not be very substantial. Secondly, these countries trade very little among themselves and major trading partners of the individual South Asian countries are located in the West. Thirdly, it is alleged that SAFTA may lead to substantial trade diversion than trade creation for some of the member countries. Finally, such a regional integration may work as a stumbling bloc to multilateral trade liberalisation.
W T O A N D R E G I O N A L T R A D E N E G O T I A T I O N O U T C O M E S : Q U A N T I T A T I V E
A S S E S S M E N T S O F P O T E N T I A L I M P L I C A T I O N S O N B A N G L A D E S H
26 There no denying the fact that the MFA phase-out has been a serious
concern for the economy of Bangladesh. Despite Bangladesh’s posting some robust export growth rates in the first two years following the quota phase out, there are credible reasons to believe that the safeguard measures imposed on China both by the EU and USA have critically supported the country’s achieving such an impressive performance. Removal of all restrictions from China, which is to take effect from the very beginning of 2009, would definitely lead to a much more challenging situation. Only in the first six months of 2005 China was allowed to export freely and Bangladesh eventually saw its exports for that year declining in the EU market. Although no such trend could be observed in the USA market, Bangladesh was found to have performed much better after the quantitative limits had been slapped on China. There is a high similarity between export items of Bangladesh and China in the USA market and consequently free trade in that market will potentially open up a fierce competition between these two suppliers. It might be that the previously existing quota rents had helped Bangladesh keep afloat in the USA market before quantitative limits were imposed on China. On the other hand, the quota-free access to the EU market even before the expiry of the quota regime dissipated all quota rents for Bangladesh, making it unable to cushion the price fall that marked the transition to post-MFA period causing export receipts to decline. In this backdrop, there are genuine concerns to suppose that in a truly free trade situation China would pose formidable challenge to Bangladesh and other suppliers.
The WTO negotiation on Aid for Trade (AfT) has the potentials to bring some important benefits for the Bangladesh economy. International aid circulating from the developed to the developing and least developed countries is not new. Along with its other bilateral and multilateral characteristics, there is a common ideology that international assistance comes with some development strategies, designed by the developed country experts in most of the cases. However, in international trade negotiations under WTO talks, a new concept of Aid for Trade (AfT) has been incorporated in the Hong Kong Ministerial Declaration for the first time, as a special and committed assistance aimed at fostering trade. AfT has an initial objective of helping specially the LDCs and also the developing countries to maximise the benefits from enhanced market access as well as to minimise the costs of trade liberalisation.
W T O A N D R E G I O N A L T R A D E N E G O T I A T I O N S : T H E P E R S P E C T I V E F R O M
B A N G L A D E S H
27As mentioned before, Bangladesh has offensive interests in the mode
4 liberalisation under the WTO’s services trade negotiations. Bangladesh has large endowment of low and semi-skilled labour, and the remittance from the low and semi skilled labour contributes significantly in the alleviation of poverty in the country.
In the post-Hong Kong period, trade policy makers in Bangladesh have put maximum emphasis on two things: (i) diversification of export base of the country so that trade preference opportunities can be meaningfully exploited and (ii) sustaining RMG export through enhanced competitiveness. There is no denying the fact that, the export basket of Bangladesh is highly concentrated with only the ready-made garment sector constituting more than 75 percent of total export earnings. The need for the diversification of the export basket has been stressed with grave importance in the industrial and export policies. However, together with the supply-side constraints, a number of market access problems are hindering the expansion of the export-oriented non-RMG sectors in the economy.
Against the backdrop of the aforementioned discussions, it can be mentioned that the academicians, policy makers and trade-related major stakeholders have all along stressed the need for Bangladesh’s capacity building in trade negotiations. Therefore, for Bangladesh handling trade negotiation issues should comprise a comprehensive strategy for future trade promotion. In this context, the present research should be considered as a timely and important initiative.
1.2. Objectives of the Study
The goal of study is to facilitate trade policy making and trade negotiations, through informed policy inputs and discussions, backed by solid analytical research, which in the process will contribute to capacity building with regard to the understanding and analysis of trade policy in Bangladesh. The specific objectives of the study are: (i) to study the major WTO issues that are of important trade and economic interest to Bangladesh; (ii) to provide a tracking of multilateral trade negotiations under various WTO Agreements; (iii) to provide ex ante analyses of potential costs and benefits of alternative negotiation outcomes at multilateral and regional levels; and (iv) to identify the trade negotiation
W T O A N D R E G I O N A L T R A D E N E G O T I A T I O N O U T C O M E S : Q U A N T I T A T I V E
A S S E S S M E N T S O F P O T E N T I A L I M P L I C A T I O N S O N B A N G L A D E S H
28 issues for Bangladesh, and to suggest her stance on important multilateral and regional and trade negotiating issues.
1.3. Methodology
Like any other useful work, the present study has reviewed the relevant literature, data analysis, and discussions with the concerned stakeholders. In addition, we incorporated strong analytical frameworks to provide credible results and thereby to promote informed policy analysis. The application of this kind of methodology means the use of cross-country comparisons, and simulation exercises based on general equilibrium models.
Effective policy negotiations partly depend on the policymakers’ (negotiators’) a priori assessment about the implications arising from different negotiation outcomes. Therefore, it is very important to provide the policymakers with ex ante analysis of alternative scenarios. For example, for a net-food importing LDC it is crucial for its negotiators to have a clear idea about the potential implications of agriculture trade liberalisation (or, for that matter any other liberalisation scheme) under the WTO-led multilateral trade negotiations. These types of ex ante analyses have been undertaken using various methodologies; and in the current study we have used a global general equilibrium model to simulate the effects arising from alternative negotiating outcomes for Bangladesh.
Along with multilateral trade negotiations, regional and bilateral trade agreements have figured out very prominently in recent times. Bangladesh is also negotiating in a number of regional and bilateral forums. Again, as mentioned in the just above point, effective support to these negotiations can be provided by undertaking the relevant ex ante analyses. In the current research, we have conducted such analyses using the global general equilibrium model. 1.4 Outline of the Book This study has addressed various issues related to several important multilateral trade negotiations under WTO, and the regional trading
W T O A N D R E G I O N A L T R A D E N E G O T I A T I O N S : T H E P E R S P E C T I V E F R O M
B A N G L A D E S H
29agreements. A number of ex ante analyses, using global and country general equilibrium models, have been undertaken by simulating the effects arising from alternative negotiating scenarios.
In chapter two of this book, Selim Raihan has explained the methodology of linking the global CGE model (the GTAP model) with the country CGE model for Bangladesh with the aim of exploring the welfare and poverty impacts at the household level arising from different multilateral trade negotiations. This chapter has discussed the main features of the GTAP and the Bangladesh dynamic CGE model. It has also explained how the price and volume shocks from the GTAP model are introduced in the country CGE model.
Selim Raihan and Abdur Razzaque, in chapter three, have explored the impacts of global agricultural trade liberalisation on the Bangladesh economy. Using the GTAP model and the Bangladesh CGE model three simulations depicting full liberalisation, partial liberalisation and the Hong Kong scenarios have been performed and their potential implications have been analysed.
Chapter four is written by Selim Raihan and Abdur Razzaue, and the authors have examined the implications of different DFQF scenarios for the Bangladesh economy. Using the GTAP and the country CGE models three simulations have been performed. These simulations are: full DFQF market access of LDCs in the developed countries, full DFQF market access of LDCs in the developed and in the advanced developed countries markets, and full DFQF market access of LDCs only in the USA.
In chapter five, Selim Raihan, Abdur Razzaque and Rabeya Khatoon have explored three different NAMA scenarios with a view to estimate Bangladesh’s preference erosion in the EU market, as well as her possible gains in the USA and other markets. Using the GTAP general equilibrium method this paper has also estimated the welfare impacts of different NAMA scenarios. The Bangladesh dynamic CGE model has been applied to explore the impacts of different NAMA scenarios on the economy of Bangladesh.
Selim Raihan and Abdur Razzaque, in chapter six, have analysed the
implications of Bangladesh’s negotiations for different regional and bilateral trading agreements. In particular, this paper has examined the potentials effects of SAFTA. Using the global general equilibrium
W T O A N D R E G I O N A L T R A D E N E G O T I A T I O N O U T C O M E S : Q U A N T I T A T I V E
A S S E S S M E N T S O F P O T E N T I A L I M P L I C A T I O N S O N B A N G L A D E S H
30 model, namely the GTAP model, this chapter has estimated the trade creation and trade diversion effects for Bangladesh and other South Asian countries out of different SAFTA scenarios.
In chapter seven, Abdur Razzaque and Selim Raihan have explored the concerns and prospects of RMG sector during the post MFA-phase out period. This chapter has explained the past performances of the RMG exports and the concerns over the fact that in a truly free trade situation (after 2008) China is likely to pose formidable challenge to Bangladesh and other suppliers.
Selim Raihan and Rabeya Khatoon, in chapter eight, have reiterated the importance of aid for trade (AfT) for helping specially the LDCs to maximise the benefits from enhanced market access as well as to minimise the costs of trade liberalisation.
In chapter nine, Abdur Razzaque and Selim Raihan have emphasised on the fact that Bangladesh has important stakes in the negotiations on global liberalisation of the service sector, especially the liberalisation with respect to the movement of natural persons. Few critical issues have been explored with respect to service trade liberalisation, which are of utmost importance for Bangladesh as an LDC. These are LDC modalities, market access, domestic regulation, mode 4 liberalisation and the technical assistance. This paper has examined the issues under consideration, the state and the scope of the debate, Bangladesh’s interest as an LDC, and her proposed stance in the case of all the aforementioned critical issues.
In chapter ten, Abu Eusuf, Mahbub Alam, Mokammel K. Toufique and Rabeya Khatoon have explored the problems of market access in the seven thrust sectors in Bangladesh. This chapter has presented the export potentials of these sectors, and has analysed different types of market access problems faced by these sectors. This chapter has also proposed Bangladesh’s strategies to overcome those problems.
Finally, in chapter eleven, Selim Raihan and Abdur Razzaque have made a summary of the findings of the research. This chapter has also presented the concluding observations.
CHAPTER TWO
Selim Raihan Methodology of Linking Global CGE Model to a Country CGE Model for Poverty and Welfare Analysis
2.1. Introduction
The purpose of this chapter is to describe in details the methodology of linking the global computable general equilibrium (CGE) model, namely the GTAP model, with a country CGE model for Bangladesh. The CGE approach is the dominant methodology for the ex ante analysis of economic consequences of comprehensive trade agreements whether multilateral or bilateral in nature (Francois and Shiells, 1994). This is the dominant methodology because no other approach offers the same flexibility for looking at prospective changes in trade policy while respecting the fundamental economy-wide consistency requirements, such as balance of payments equilibrium and labour and capital market constraints, that are so important in determining the consequences of comprehensive trade reforms.
The technique of integrating the global and the country CGE model has been used in chapters three, four and five of this volume. The most important advantage of this technique is that it allows the examination of
W T O A N D R E G I O N A L T R A D E N E G O T I A T I O N O U T C O M E S : Q U A N T I T A T I V E
A S S E S S M E N T S O F P O T E N T I A L I M P L I C A T I O N S O N B A N G L A D E S H
32 the impact of different multilateral trade negotiations on poverty and welfare at the household levels in an economy.
The structure of this chapter is as follows: Section 2.2 presents the basic features of the GTAP model; Section 2.3 describes the structure of the Bangladesh dynamic CGE model; and finally Section 2.4 analyses the methods of linking these two types of models.
2.2. The GTAP Model
The global computable general equilibrium (CGE) modelling framework of the Global Trade Analysis Project (GTAP) (Hertel, 1997), is the best possible way for the ex ante analysis of the economic and trade consequences of multilateral or bilateral trade agreements. The GTAP model is a comparative static model, and is based on neoclassical theories.11 The GTAP model is a linearised model, and it uses a common global database for the CGE analysis. The model assumes perfect competition in all markets, constant returns to scale in all production and trade activities, and profit and utility maximising behaviour of firms and households respectively. The model is solved using the software GEMPACK (Harrison and Pearson, 1996). 2.2.1. Household Income and Expenditure In the GTAP model each region has a single representative household, termed as the regional household. The income of the regional household is generated through factor payments and tax revenues (including export and import taxes) net of subsidies. The regional household allocates expenditure over private household expenditure, government expenditure and savings according to a Cobb Douglas per capita utility function.2 Thus each component of final demand maintains a constant share of total regional income.2
1 Full documentation of the GTAP model and the database can be found in Hertel
(1997) and also in Dimaranan and McDougall (2002). 2 Savings enter in the static utility function as a proxy for future consumption.
M E T H O D O L O G Y O F L I N K I N G G L O B A L C G E M O D E L T O A C O U N T R Y C G E
M O D E L F O R P O V E R T Y A N D W E L F A R E A N A L Y S I S
33The private household buys commodity bundles to maximise utility
subject to its expenditure constraint. The constrained optimising behaviour of the private household is represented in the GTAP model by a Constant Difference of Elasticity (CDE) expenditure function. The private household spends its income on consumption of both domestic and imported commodities and pays taxes. The consumption bundles are Constant Elasticity of Substitution (CES) aggregates of domestic and imported goods, where the imported goods are also CES aggregates of imports from different regions. Taxes paid by the private household cover commodity taxes for domestically produced and imported goods and the income tax net of subsidies. 2.2.2. The Government Consumption The government also spends its income on domestic and imported commodities and also pays taxes. For the government, taxes consist of commodity taxes for domestically produced and imported commodities. Like the private household, government consumption is a CES composition of domestically produced goods and imports. 2.2.3. Savings and Investment The GTAP model considers the demand for investment in a particular region as savings driven. In the multi country setting the model is closed by assuming that regional savings are homogenous and contribute to a global pool of savings (global savings). This is then allocated among regions for investment in response to the changes in the expected rates of return in different regions. If all other markets in the multi regional model are in equilibrium, if all firms earn zero profits, and if all households are on their budget constraint, such a treatment of savings and investment will lead to a situation where global investment must equal global savings, and Walras' Law will be satisfied.
W T O A N D R E G I O N A L T R A D E N E G O T I A T I O N O U T C O M E S : Q U A N T I T A T I V E
A S S E S S M E N T S O F P O T E N T I A L I M P L I C A T I O N S O N B A N G L A D E S H
34 2.2.4. Producers’ Income In the GTAP model, producers receive payments for selling consumption goods and intermediate inputs both in the domestic market and to the rest of the world. Under the zero profit assumption employed in the model, these revenues must be precisely exhausted by spending on domestic intermediate inputs, imported intermediate inputs, factor income and taxes paid to regional household (taxes on both domestic and imported intermediate inputs and production taxes net of subsidies).
2.2.5 Production Technology
The GTAP model considers a nested production technology with the assumption that every industry produces a single output, and constant returns to scale prevail in all markets. Industries have a Leontief production technology to produce their outputs. Industries maximise profits by choosing two broad categories of inputs namely, a composite of factors (value added) and a composite of intermediate inputs. The factor composite is a CES function of labour, capital, land and natural resources. The intermediate composite is a Leontief function of material inputs, which are in turn a CES composition of domestically produced goods and imports. Imports are sourced from all regions.
2.2.6. International Trade
The GTAP model employs the Armington assumption which provides the possibility to distinguish imports by their origin and explains intra-industry trade of similar products. Following the Armington approach import shares of different regions depend on relative prices and the substitution elasticity between domestically and imported commodities.
2.2.7. Base Data and Base Year Adjustments
In contrast to the version 5 of the GTAP database, version 6 has 2001 as the base year instead of 1997, updated national, economic and trade data,
M E T H O D O L O G Y O F L I N K I N G G L O B A L C G E M O D E L T O A C O U N T R Y C G E
M O D E L F O R P O V E R T Y A N D W E L F A R E A N A L Y S I S
35and more importantly protection data from a new source.3 The new GTAP database has lower tariffs than the earlier versions as a result of the reform efforts between 1997 and 2001 (which includes, for example, China’s progress towards WTO accession and continued implementation of the Uruguay Round Agreement) and the inclusion of bilateral trade preferences. The GTAP database has been further adjusted to incorporate the phasing out of the Multi Fibre Agreement (MFA) in 2005. It was also checked whether China’s accession to WTO posed any impact on the simulation results. Due to the lack of access to any detailed information on China’ commitment to WTO with respect to her tariff cuts, the current study performed this exercise by an ad hoc cut of China’s tariff rates by 50 percent, and updated the database accordingly.
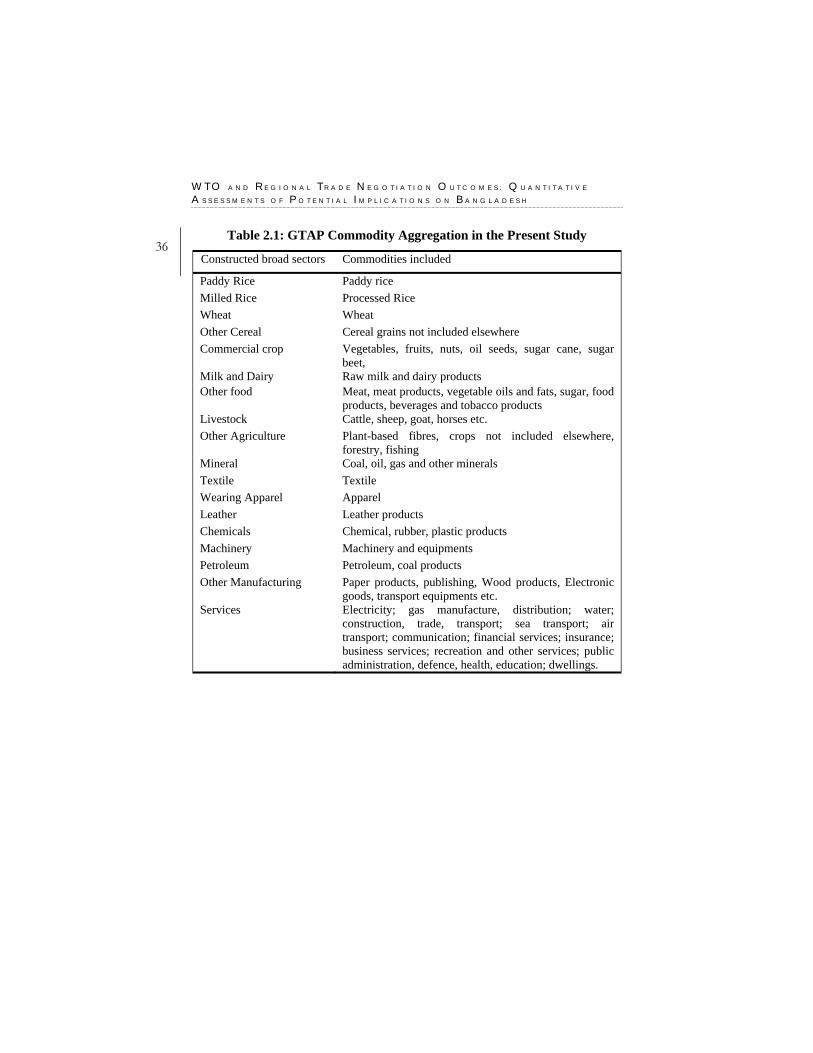
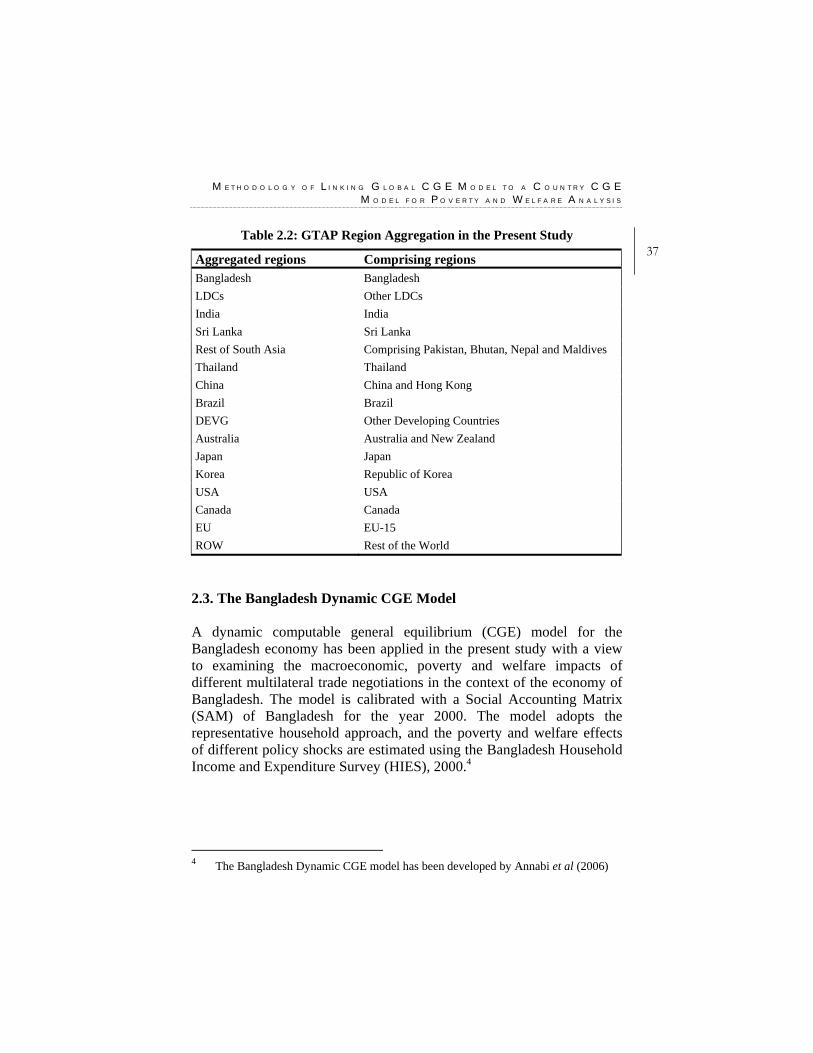
2.2.8. Data, Region and Commodity Aggregation
GTAP Data on regions and commodities are aggregated to meet the objectives of this study. The version 6 of GTAP database covers 57 commodities, 87 regions/countries, and 5 factors of production. The current study has aggregated 57 commodities into 14, and 87 regions into 19 as shown in tables 2.1 and 2.2 respectively.
In the GTAP database, each industry produces one commodity. So there is a one to one relation between industries and commodities. Given the focus of the present study Bangladesh and other LDCs have been considered as different regions. Also, other South Asian countries are kept as separated countries. The GTAP database 6 does not include Pakistan as a single country, rather it is included under the category ‘Rest of South Asia’ where data from all the South Asian countries except Bangladesh, India and Sri Lanka are lumped together. In the present study, except India, Sri Lanka, Brazil, China and Thailand, all other developing countries are grouped as ‘other developing countries’. Furthermore, the leading developed countries are considered as separated regions.
3 The source of the new protection data is the MAcMaps, a product of the joint CEPII
(Paris)/ITC(Geneva) project, which has a detailed database on bilateral tariff protection that integrates trade preferences, specific tariffs and a partial evaluation of non-tariff barriers (NTBs).
W T O A N D R E G I O N A L T R A D E N E G O T I A T I O N O U T C O M E S : Q U A N T I T A T I V E
A S S E S S M E N T S O F P O T E N T I A L I M P L I C A T I O N S O N B A N G L A D E S H
36 Table 2.1: GTAP Commodity Aggregation in the Present Study
Constructed broad sectors Commodities included
Paddy Rice Paddy rice Milled Rice Processed Rice Wheat Wheat Other Cereal Cereal grains not included elsewhere Commercial crop Vegetables, fruits, nuts, oil seeds, sugar cane, sugar
beet, Milk and Dairy Raw milk and dairy products Other food Meat, meat products, vegetable oils and fats, sugar, food
products, beverages and tobacco products Livestock Cattle, sheep, goat, horses etc. Other Agriculture Plant-based fibres, crops not included elsewhere,
forestry, fishing Mineral Coal, oil, gas and other minerals Textile Textile Wearing Apparel Apparel Leather Leather products Chemicals Chemical, rubber, plastic products Machinery Machinery and equipments Petroleum Petroleum, coal products Other Manufacturing Paper products, publishing, Wood products, Electronic
goods, transport equipments etc. Services Electricity; gas manufacture, distribution; water;
construction, trade, transport; sea transport; air transport; communication; financial services; insurance; business services; recreation and other services; public administration, defence, health, education; dwellings.
M E T H O D O L O G Y O F L I N K I N G G L O B A L C G E M O D E L T O A C O U N T R Y C G E
M O D E L F O R P O V E R T Y A N D W E L F A R E A N A L Y S I S
37Table 2.2: GTAP Region Aggregation in the Present Study
Aggregated regions Comprising regions Bangladesh Bangladesh LDCs Other LDCs India India Sri Lanka Sri Lanka Rest of South Asia Comprising Pakistan, Bhutan, Nepal and Maldives Thailand Thailand China China and Hong Kong Brazil Brazil DEVG Other Developing Countries Australia Australia and New Zealand Japan Japan Korea Republic of Korea USA USA Canada Canada EU EU-15 ROW Rest of the World
2.3. The Bangladesh Dynamic CGE Model
A dynamic computable general equilibrium (CGE) model for the Bangladesh economy has been applied in the present study with a view to examining the macroeconomic, poverty and welfare impacts of different multilateral trade negotiations in the context of the economy of Bangladesh. The model is calibrated with a Social Accounting Matrix (SAM) of Bangladesh for the year 2000. The model adopts the representative household approach, and the poverty and welfare effects of different policy shocks are estimated using the Bangladesh Household Income and Expenditure Survey (HIES), 2000.4
4 The Bangladesh Dynamic CGE model has been developed by Annabi et al (2006)
W T O A N D R E G I O N A L T R A D E N E G O T I A T I O N O U T C O M E S : Q U A N T I T A T I V E
A S S E S S M E N T S O F P O T E N T I A L I M P L I C A T I O N S O N B A N G L A D E S H
38 2.3.1. Basic Features of the Model
It has been highlighted by Annabi et al (2006) that majority of the CGE models, used in poverty and inequality analysis, are static in nature. They are, therefore, unable to account for growth effects, which makes them inadequate for the long run analysis of the poverty impacts of economic policies. These static models cannot capture accumulation effects, and fail to examine the transition path of the economy where short-run impacts of any policy reforms are likely to be different from the long-run impacts. To overcome this limitation, a sequential, dynamic CGE model is suggested. In a sequential dynamic CGE model the economic agents do not have any intertemporal optimisation behaviour, rather, these agents are myopic. In this dynamic model a series of static CGE models are linked between periods, while exogenous and endogenous variables are updated with an updating procedure. Below a brief description of the static and dynamic aspects of the model is presented.
2.3.1.1. Static Aspects of the Model
In the case of production, each sector has a representative firm. The production system is characterised by a nested structure, where sectoral output is a Leontief function of value added and total intermediate consumption, and value added, in turn, is represented by a constant elasticity of substitution (CES) function of capital and composite labour.
Turning to consumption, a linear expenditure system (LES), which is derived from the maximisation of a Stone–Geary utility function, is applied to represent household demand function. The minimal consumption levels in the LES function are calibrated using guess-estimates of the income elasticity and the Frisch parameters. The model assumes household saving as a fixed proportion of the total disposal income.
Imperfect substitution between foreign and domestic goods is assumed, which is captured by the standard Armington assumption with a constant elasticity of substitution function (CES) between imports and domestic goods. On the supply side, constant elasticity of transformation (CET) between exports and domestic sales is assumed. The model also assumes a finite elasticity export demand function, which expresses the limited power of the local exporters in the world market.
M E T H O D O L O G Y O F L I N K I N G G L O B A L C G E M O D E L T O A C O U N T R Y C G E
M O D E L F O R P O V E R T Y A N D W E L F A R E A N A L Y S I S
39The source of government income is the direct tax revenue from
households and firms and indirect tax revenue on domestic and imported goods. Government allocates its expenditure between the consumption of goods and services (including public wages) and transfers. The loss in government revenue due to any tariff cut is compensated by indirect or direct tax mechanism, which is inbuilt in the model.
The model is solved for each period, and the general equilibrium in each period is achieved by the equality between supply and demand of goods and factors, and the equality between investment and savings. In each period the nominal exchange rate acts as the numéraire.
2.3.1.2. Dynamic Aspects of the Model
The model considers a capital accumulation equation, which updates capital stock in each period. The model assumes that the stocks are measured at the beginning of the period and flows are measured at the end of the period.
The model introduces an investment demand function which determines the pattern of reallocation of new investment among sectors after any shock. Investment, in this function, is by sector of destination rather than by origin (product). The total investment by destination equals the total investment by origin in the SAM. The investment by destination matrix is used to calibrate the sectoral capital stock in the base run. The capital accumulation rate (ratio of investment to capital stock) increases with respect to the ratio of the rate of return to capital and its user cost.
Total labour supply increases at an exogenous rate, which is equal to the population growth rate and the labour force growth rate. Other nominal variables, such as transfers and the minimal level of consumption in the LES function, and government savings, current account balance also increase at the same rate.
An adjustment variable, which is introduced in the investment demand function, helps in bringing the equality between total savings and total investment in each period. The model allows all variables in the baseline to increase at the same rate in level, and the prices remain constant. This method is useful for the welfare and poverty analysis since all prices remain constant along the business as usual (BAU) path.
W T O A N D R E G I O N A L T R A D E N E G O T I A T I O N O U T C O M E S : Q U A N T I T A T I V E
A S S E S S M E N T S O F P O T E N T I A L I M P L I C A T I O N S O N B A N G L A D E S H
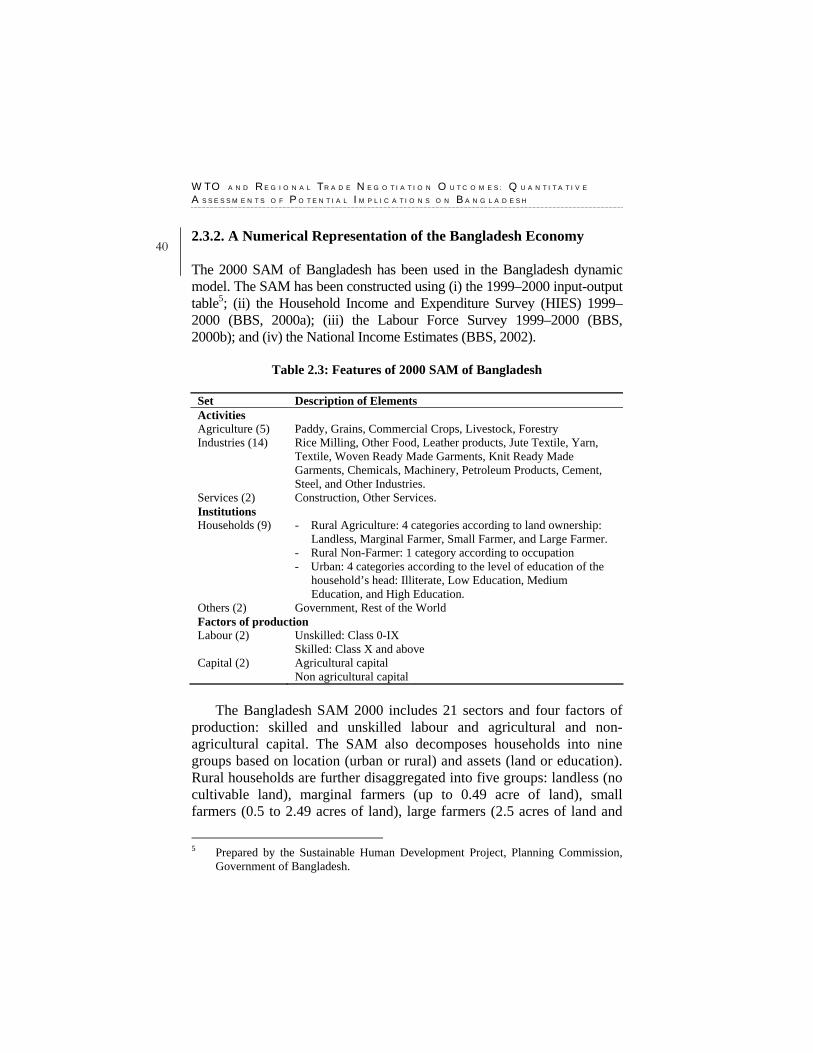
40 2.3.2. A Numerical Representation of the Bangladesh Economy The 2000 SAM of Bangladesh has been used in the Bangladesh dynamic model. The SAM has been constructed using (i) the 1999–2000 input-output table5; (ii) the Household Income and Expenditure Survey (HIES) 1999–2000 (BBS, 2000a); (iii) the Labour Force Survey 1999–2000 (BBS, 2000b); and (iv) the National Income Estimates (BBS, 2002).
Table 2.3: Features of 2000 SAM of Bangladesh
Set Description of Elements Activities Agriculture (5) Paddy, Grains, Commercial Crops, Livestock, Forestry Industries (14) Rice Milling, Other Food, Leather products, Jute Textile, Yarn,
Textile, Woven Ready Made Garments, Knit Ready Made Garments, Chemicals, Machinery, Petroleum Products, Cement, Steel, and Other Industries.
Services (2) Construction, Other Services. Institutions Households (9) - Rural Agriculture: 4 categories according to land ownership:
Landless, Marginal Farmer, Small Farmer, and Large Farmer. - Rural Non-Farmer: 1 category according to occupation - Urban: 4 categories according to the level of education of the
household’s head: Illiterate, Low Education, Medium Education, and High Education.
Others (2) Government, Rest of the World Factors of production Labour (2) Unskilled: Class 0-IX
Skilled: Class X and above Capital (2) Agricultural capital
Non agricultural capital The Bangladesh SAM 2000 includes 21 sectors and four factors of
production: skilled and unskilled labour and agricultural and non-agricultural capital. The SAM also decomposes households into nine groups based on location (urban or rural) and assets (land or education). Rural households are further disaggregated into five groups: landless (no cultivable land), marginal farmers (up to 0.49 acre of land), small farmers (0.5 to 2.49 acres of land), large farmers (2.5 acres of land and
5 Prepared by the Sustainable Human Development Project, Planning Commission,
Government of Bangladesh.
M E T H O D O L O G Y O F L I N K I N G G L O B A L C G E M O D E L T O A C O U N T R Y C G E
M O D E L F O R P O V E R T Y A N D W E L F A R E A N A L Y S I S
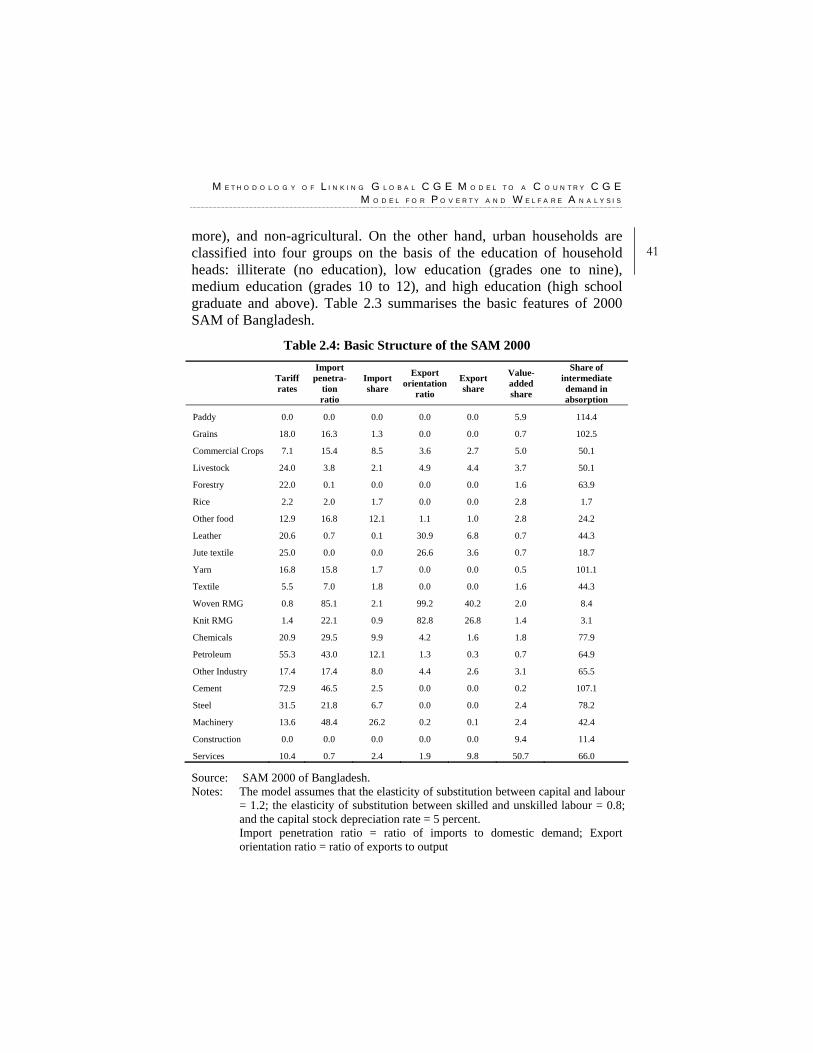
41more), and non-agricultural. On the other hand, urban households are classified into four groups on the basis of the education of household heads: illiterate (no education), low education (grades one to nine), medium education (grades 10 to 12), and high education (high school graduate and above). Table 2.3 summarises the basic features of 2000 SAM of Bangladesh.
Table 2.4: Basic Structure of the SAM 2000
Tariff rates
Import penetra-
tion ratio
Import share
Export orientation
ratio
Export share
Value-added share
Share of intermediate demand in absorption
Paddy 0.0 0.0 0.0 0.0 0.0 5.9 114.4
Grains 18.0 16.3 1.3 0.0 0.0 0.7 102.5
Commercial Crops 7.1 15.4 8.5 3.6 2.7 5.0 50.1
Livestock 24.0 3.8 2.1 4.9 4.4 3.7 50.1
Forestry 22.0 0.1 0.0 0.0 0.0 1.6 63.9
Rice 2.2 2.0 1.7 0.0 0.0 2.8 1.7
Other food 12.9 16.8 12.1 1.1 1.0 2.8 24.2
Leather 20.6 0.7 0.1 30.9 6.8 0.7 44.3
Jute textile 25.0 0.0 0.0 26.6 3.6 0.7 18.7
Yarn 16.8 15.8 1.7 0.0 0.0 0.5 101.1
Textile 5.5 7.0 1.8 0.0 0.0 1.6 44.3
Woven RMG 0.8 85.1 2.1 99.2 40.2 2.0 8.4
Knit RMG 1.4 22.1 0.9 82.8 26.8 1.4 3.1
Chemicals 20.9 29.5 9.9 4.2 1.6 1.8 77.9
Petroleum 55.3 43.0 12.1 1.3 0.3 0.7 64.9
Other Industry 17.4 17.4 8.0 4.4 2.6 3.1 65.5
Cement 72.9 46.5 2.5 0.0 0.0 0.2 107.1
Steel 31.5 21.8 6.7 0.0 0.0 2.4 78.2
Machinery 13.6 48.4 26.2 0.2 0.1 2.4 42.4
Construction 0.0 0.0 0.0 0.0 0.0 9.4 11.4
Services 10.4 0.7 2.4 1.9 9.8 50.7 66.0
Source: SAM 2000 of Bangladesh. Notes: The model assumes that the elasticity of substitution between capital and labour
= 1.2; the elasticity of substitution between skilled and unskilled labour = 0.8; and the capital stock depreciation rate = 5 percent. Import penetration ratio = ratio of imports to domestic demand; Export orientation ratio = ratio of exports to output
W T O A N D R E G I O N A L T R A D E N E G O T I A T I O N O U T C O M E S : Q U A N T I T A T I V E
A S S E S S M E N T S O F P O T E N T I A L I M P L I C A T I O N S O N B A N G L A D E S H
42 The basic structure of the 2000 Bangladesh SAM is summarised in
table 2.4. Tariff rates vary across the sectors and range from as low as 0 percent (paddy sector) to as high as 72.9 percent (cement). Woven ready-made-garment (RMG) has the highest sectoral import penetration ratio (85 percent), followed by machinery (48 percent). The highest share in total imports is for machinery (26 percent), followed by petroleum (12 percent). The sectoral export orientation ratio is the highest for woven RMG (99 percent). Together woven and Knit RMG exports account for 67 percent of total exports. In the case of value addition, the service and construction sectors together account for 60 percent of total value added in the economy. The aggregate agricultural and the manufacturing sectors constitute 17 percent and 23 percent of the total value added respectively. The share of intermediate consumption in total demand is the highest for the paddy sector (114 percent). This figure is greater than 100 because of the negative stock variation in this sector. It should, however, be mentioned that paddy is not directly consumed, but it serves only as an input in rice milling.
The income composition of households, which is derived from SAM 2000, is presented in table 2.5. It appears that all the nine household categories receive most of their income from factor remuneration. For the poorer households, such as landless, household with illiterate head, marginal farmers, non-agricultural households, and small farmers, unskilled labour appears to be the primary source of their income. In contrast, households with medium and high-educated heads receive most of their incomes from non-agricultural capital and skilled labour. Households with low-educated heads are heavily dependent on incomes from both unskilled labour and non-agricultural capital. For the large farmers, earnings from agricultural capital is the principal source of their income. These considerable differences in income sources for different households are expected to generate varying income and poverty effects when different policy shocks are introduced in the model.

M E T H O D O L O G Y O F L I N K I N G G L O B A L C G E M O D E L T O A C O U N T R Y C G E
M O D E L F O R P O V E R T Y A N D W E L F A R E A N A L Y S I S
43Table 2.5: Income Composition of the Households
Percentage Contributions to the Household Income from Household Categories
Skilled labour
Unskilled labour
Non- agricul-
tural capital
Agricul-tural
capital*
Divi-dends
Intra-household transfers
Public transfers
Remi-ttances
Total
Rural Landless 3.19 90.63 0.00 0.00 - 5.30 0.37 0.51 100.00 Marginal farmers
4.73 59.16 24.80 2.01 -. 8.38 0.35 0.57 100.00
Small farmers
17.07 37.67 24.57 15.67 - 4.26 0.10 0.66 100.00
Large farmers
9.88 5.28 34.43 49.74 - 0.41 0.01 0.24 100.00
Non-agriculture
23.01 40.45 27.79 4.79 - 2.96 0.38 0.61 100.00
Urban Illiterate 1.69 67.41 28.79 0.00 - 1.66 0.05 0.40 100.00 Low education
7.31 41.07 41.27 6.69 - 2.94 0.26 0.45 100.00
Medium education
30.82 1.20 58.75 7.88 0.06 0.37 0.74 0.18 100.00
High education
20.08 0.26 59.72 14.95 0.20 1.14 3.43 0.21 100.00
All 16.06 35.08 35.00 10.32 0.02 2.52 0.53 0.43 100.00
Source: SAM 2000 of Bangladesh. Note: * Agricultural capital is nothing but ‘land’ here. ‘-’ denotes not applicable to this household category.
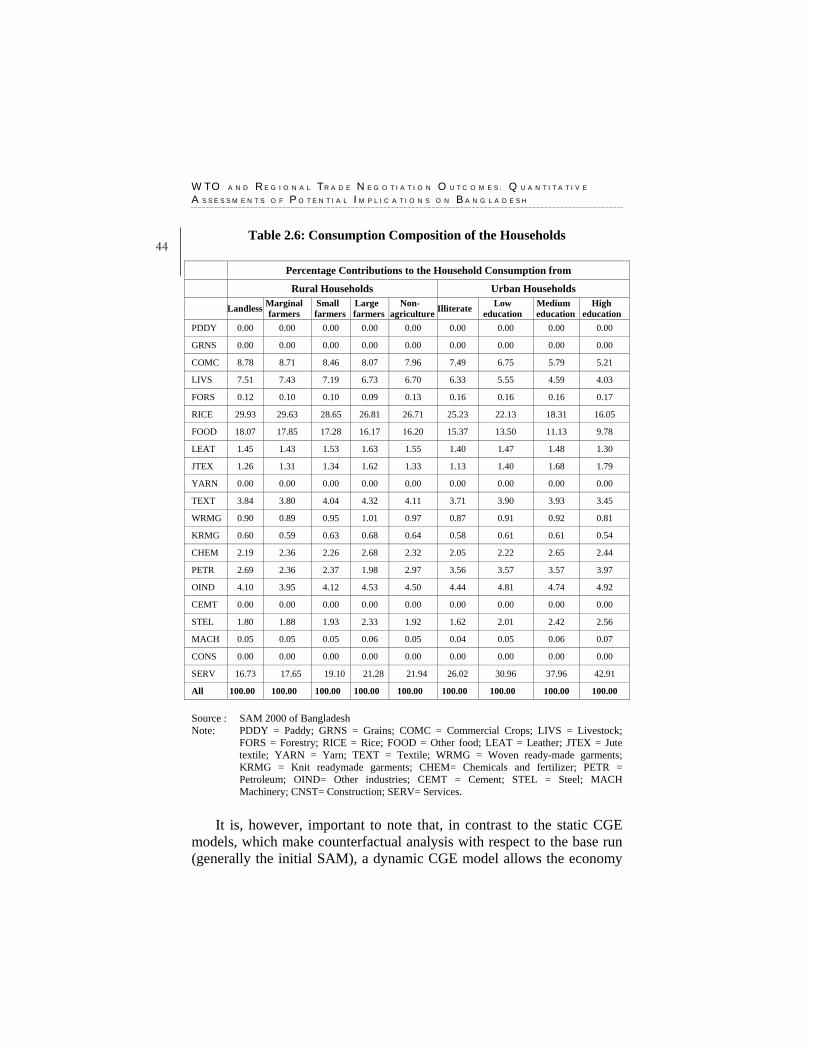
The consumption composition of households, as derived from the SAM 2000, is reported in table 2.6. It appears that agricultural commodities account for, on average, 40 percent of the consumption of the households. However, this share is close to 45 percent among the rural households; whereas, for the urban households the shares are well below the 40 percent marks. On average, rice alone accounts for more than 25 percent of the consumption share for the rural households and poorer households in particular. It is also observed that the shares of non-food items are considerably high among the richer households. These differences in the consumption composition for different households are expected to cause varying consumption effects out of different policy shocks.
W T O A N D R E G I O N A L T R A D E N E G O T I A T I O N O U T C O M E S : Q U A N T I T A T I V E
A S S E S S M E N T S O F P O T E N T I A L I M P L I C A T I O N S O N B A N G L A D E S H
44 Table 2.6: Consumption Composition of the Households
Percentage Contributions to the Household Consumption from
Rural Households Urban Households
Landless Marginal farmers
Small farmers
Large farmers
Non- agriculture Illiterate Low
education Medium
education High
education PDDY 0.00 0.00 0.00 0.00 0.00 0.00 0.00 0.00 0.00
GRNS 0.00 0.00 0.00 0.00 0.00 0.00 0.00 0.00 0.00
COMC 8.78 8.71 8.46 8.07 7.96 7.49 6.75 5.79 5.21
LIVS 7.51 7.43 7.19 6.73 6.70 6.33 5.55 4.59 4.03
FORS 0.12 0.10 0.10 0.09 0.13 0.16 0.16 0.16 0.17
RICE 29.93 29.63 28.65 26.81 26.71 25.23 22.13 18.31 16.05
FOOD 18.07 17.85 17.28 16.17 16.20 15.37 13.50 11.13 9.78
LEAT 1.45 1.43 1.53 1.63 1.55 1.40 1.47 1.48 1.30
JTEX 1.26 1.31 1.34 1.62 1.33 1.13 1.40 1.68 1.79
YARN 0.00 0.00 0.00 0.00 0.00 0.00 0.00 0.00 0.00
TEXT 3.84 3.80 4.04 4.32 4.11 3.71 3.90 3.93 3.45
WRMG 0.90 0.89 0.95 1.01 0.97 0.87 0.91 0.92 0.81
KRMG 0.60 0.59 0.63 0.68 0.64 0.58 0.61 0.61 0.54
CHEM 2.19 2.36 2.26 2.68 2.32 2.05 2.22 2.65 2.44
PETR 2.69 2.36 2.37 1.98 2.97 3.56 3.57 3.57 3.97
OIND 4.10 3.95 4.12 4.53 4.50 4.44 4.81 4.74 4.92
CEMT 0.00 0.00 0.00 0.00 0.00 0.00 0.00 0.00 0.00
STEL 1.80 1.88 1.93 2.33 1.92 1.62 2.01 2.42 2.56
MACH 0.05 0.05 0.05 0.06 0.05 0.04 0.05 0.06 0.07
CONS 0.00 0.00 0.00 0.00 0.00 0.00 0.00 0.00 0.00
SERV 16.73 17.65 19.10 21.28 21.94 26.02 30.96 37.96 42.91
All 100.00 100.00 100.00 100.00 100.00 100.00 100.00 100.00 100.00 Source : SAM 2000 of Bangladesh Note: PDDY = Paddy; GRNS = Grains; COMC = Commercial Crops; LIVS = Livestock;
FORS = Forestry; RICE = Rice; FOOD = Other food; LEAT = Leather; JTEX = Jute textile; YARN = Yarn; TEXT = Textile; WRMG = Woven ready-made garments; KRMG = Knit readymade garments; CHEM= Chemicals and fertilizer; PETR = Petroleum; OIND= Other industries; CEMT = Cement; STEL = Steel; MACH Machinery; CNST= Construction; SERV= Services.
It is, however, important to note that, in contrast to the static CGE
models, which make counterfactual analysis with respect to the base run (generally the initial SAM), a dynamic CGE model allows the economy

M E T H O D O L O G Y O F L I N K I N G G L O B A L C G E M O D E L T O A C O U N T R Y C G E
M O D E L F O R P O V E R T Y A N D W E L F A R E A N A L Y S I S
45to grow even in the absence of a shock. This scenario of the economy (without a shock) is termed as the business-as-usual (BAU) scenario. The counterfactual analysis of any simulation under the dynamic CGE model is, therefore, performed with respect to this growth path. One of the salient features of the dynamic model is that it takes into account not only efficiency effects, as is also present in the static models, but also accumulation effects. The sectoral accumulation effects are linked to the ratio between the rate of return to the capital stock and the cost of investment goods.
2.4. Linking the Global Model with the Country Model As has been shown earlier, the Bangladesh dynamic CGE model is a single country CGE model that has capital and labour factors mobile among sectors, and exports and domestically produced goods are imperfect substitutes. Therefore, the export prices are not identical to prices of domestically produced goods. These two are related via a constant elasticity of transformation (CET) frontier. This gives individual export supply functions a marked upward slope. This type of model is compatible with fixed export prices (the small country assumption), and therefore zero optimal tariffs.
For each good, the export price is related to the export and domestic quantity ratio for that good, this export price can be shocked independently and export quantity will adjust to suit. This type of model also assumes that cost, insurance and freight (CIF) inclusive import prices are fixed, and that consumers substitute between imports and domestic goods via a constant elasticity of substitution (CES) nest, with the ease of substitution governed by an Armington elasticity. Therefore, the changes in world import prices can directly be introduced in the model.
The method of linking the global model with the country CGE model, therefore, can be stated as a way where the price and volume shocks from the GTAP model are introduced in the country CGE model as external shocks. The GTAP simulation results generate changes in world import and export prices and world export demand for the commodities under consideration. It is however, important to note that in the GTAP framework, because of the Armington assumption, there are
W T O A N D R E G I O N A L T R A D E N E G O T I A T I O N O U T C O M E S : Q U A N T I T A T I V E
A S S E S S M E N T S O F P O T E N T I A L I M P L I C A T I O N S O N B A N G L A D E S H
46 no world prices of imports and exports. Each country or region faces different world prices. In the Bangladesh dynamic model a downward slopping export demand functions for Bangladesh’s export items in assumed. Now, any changes in the world export demand and world export prices for Bangladesh (from the GTAP model) are plugged into the export demand function of the Bangladesh dynamic model. In the same way the changes in the world import prices for Bangladesh are plugged into the import demand function of the Bangladesh dynamic model. The advantage with this approach is that, since there are limitations of a single country CGE model in undertaking simulations for multilateral trade reform scenarios, establishment of such links with the global model can enable the single country model to conduct such simulations. Furthermore it is not possible to conduct welfare and poverty analysis at disaggregate household levels under the GTAP framework, as this model assumes a single regional household for each region. But, the country CGE models are generally composed of fairly disaggregated households. Therefore such links can help understand the impacts of the multilateral trade policy reform (through GTAP model) on poverty and welfare at disaggregated household levels (through the use of single country models).
CHAPTER THREE
Selim Raihan and Abdur Razzaque Global Agricultural Trade Liberalisation: Implications for the Bangladesh Economy
3.1. Introduction
Agriculture has been at the centre stage of multilateral trade negotiations during the past 20 years. Despite having a major progress in improving the rules for trade, the overall achievement, in terms of increasing market access for agricultural goods, was considered to be ‘disappointing’ at the end of the Uruguay Round (Martin and Winters, 1996). Although under the WTO Agreement on Agriculture members committed to carrying on reforms, not much progress has so far been made in further opening-up of the markets. Nevertheless, agriculture continues to be an active area of negotiation. While the modalities for future liberalisation in the sector are being negotiated, the potential implications arising from such liberalisation have drawn a lot of attention. Several studies (e.g., Hertel et al., 2000; Diao et al., 2001; Beghin et al., 2002; Elbehri and Leetmaa, 2002; van Meijl and van Tongeren, 2001; Dimaranan et al., 2003; Francois et al., 2003) predict that, with the elimination of export and production subsidies, prices of agricultural commodities are likely to increase. This will be beneficial to a

W T O A N D R E G I O N A L T R A D E N E G O T I A T I O N O U T C O M E S : Q U A N T I T A T I V E
A S S E S S M E N T S O F P O T E N T I A L I M P L I C A T I O N S O N B A N G L A D E S H
48 number of developing countries that have clear comparative advantage in the sector. Liberalisation will also imply further market access opportunities for these countries as a result of reduced tariff barriers in the developed country markets. However, not all developing countries are net-exporters of agricultural products, and many of them actually depend on the world market for their supplies.6 Consequently, agricultural trade liberalisation could adversely affect these countries.
Agricultural trade liberalisation is likely to affect the current pattern of global production and trade of many agricultural commodities. Rise in prices following liberalisation will be, on the whole, welfare-enhancing for a net exporting country, while for a net-importing country this will be translated into a terms of trade shock with adverse welfare consequences. Foreseeing the price rise as the ultimate outcome, concerns have been expressed about the food security and poverty situation in the food-import dependent countries. Since tariff reduction and removal of subsidies are two inherent components of the global agricultural trade liberalisation, they should be considered simultaneously in assessing the welfare consequences. While tariff reductions under the WTO rule will potentially depress prices, subsidy cuts will tend to exert an opposite effect with the net result depending on the relative strength of these two differing forces.
Against the above backdrop, the main objective of this paper is to examine the impact of global agricultural trade liberalisation on the economy of Bangladesh. In doing so, this paper also explores the impacts of such multilateral liberalisation on a number of key players in international agricultural trade along with the few other South Asian countries/negions, namely India, Sri Lanka and Rest of South Asia. The impact analysis is attempted within a global general equilibrium model – popularly known as the GTAP model – that provides the relevant trade-flow, trade-barriers, and macroeconomic data for a large number of world economies and allows for undertaking simulation exercises reflecting various trade liberalisation scenarios. GTAP simulations results are transmitted to the Bangladesh Dynamic CGE Model in order to assess the sectoral, macro, welfare and poverty implications. The detailed methodology has been depicted in chapter 2 of this volume.
6 Particularly for the least developed countries (LDCs), the ratio of food exports to food
imports is around 30 per cent.
G L O B A L A G R I C U L T U R A L T R A D E L I B E R A L I S A T I O N : I M P L I C A T I O N S F O R T H E
B A N G L A D E S H E C O N O M Y
49The present chapter considers both the withdrawal of domestic support
measures (including subsidies) and tariff reductions in assessing the implications of global agricultural trade liberalisation for the selected countries in general and Bangladesh in particular. In addition, the general equilibrium nature of the model also allows reallocation of resources following trade liberalisation, thereby giving the insights about the efficiency gains. This chapter is organised as follows: after this introduction in Section 3.1, some stylised facts associated with the international agricultural market are reported in Section 3.2; Section 3.3 describes the current state of the negotiations and the achievements so far; Section 3.4 presents the simulation design followed by the results from the GTAP model; in Section 3.5 the impacts on the Bangladesh economy are explored using the dynamic CGE model; and finally, Section 3.6 concludes. 3.2. World Agricultural Trade: Some Stylized Facts Figure 3.1 suggests that there have been fluctuations in the world trade in agricultural products over the last two decades. However, in recent time there has been an increasing trend in the world trade in agricultural products. It also appears that agricultural products constitute a sizeable share in world merchandise export (table 3.1). In 2003, agricultural products registered 41 percent share in the world exports of primary products.
Table 3.2 suggests that the EU member countries are the largest traders of the agricultural products. They, among themselves, perform more than 42 percent of the world trade in agriculture, and do another 10-14 percent of world trade with the rest of the world. The USA is another important player in world agricultural trade. Among the developing countries Brazil and China are also important exporters of agricultural products. On the other hand, apart from the EU and the USA, the major importers of agricultural products are Japan and China.
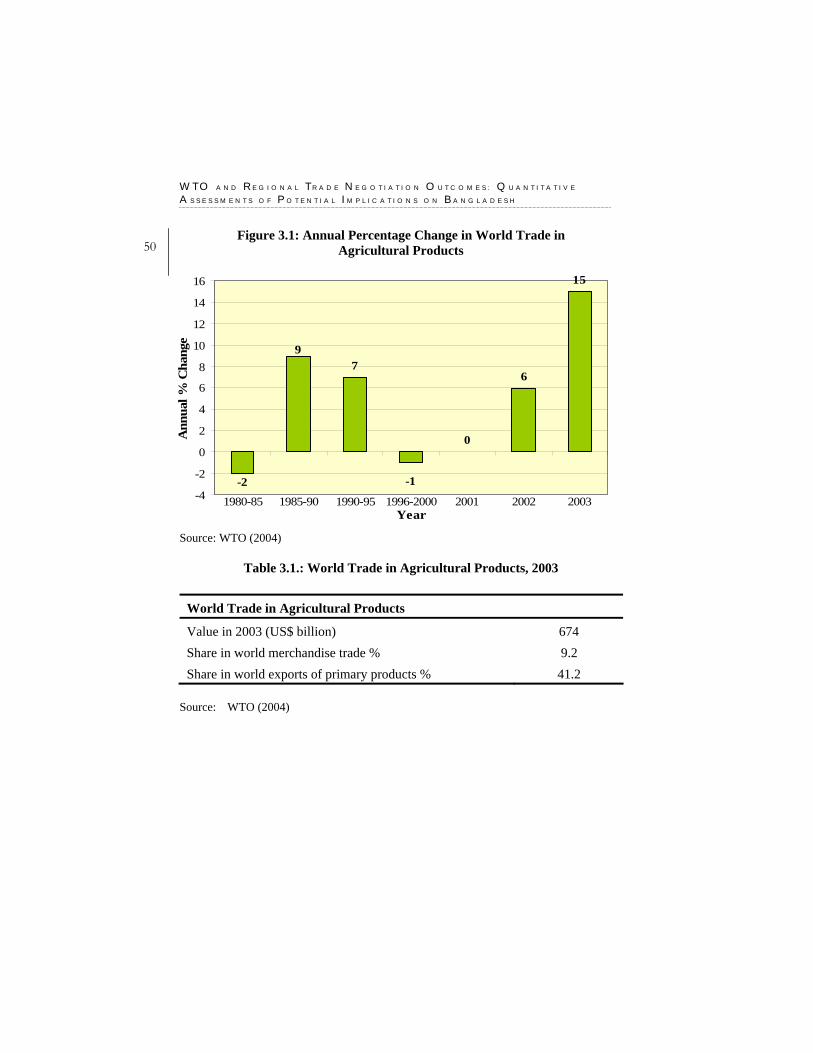
W T O A N D R E G I O N A L T R A D E N E G O T I A T I O N O U T C O M E S : Q U A N T I T A T I V E
A S S E S S M E N T S O F P O T E N T I A L I M P L I C A T I O N S O N B A N G L A D E S H
50 Figure 3.1: Annual Percentage Change in World Trade in
Agricultural Products
7
0
6
15
9
-2 -1-4
-2
0
2
4
6
8
10
12
14
16
1980-85 1985-90 1990-95 1996-2000 2001 2002 2003Year
Ann
ual %
Cha
nge
Source: WTO (2004)
Table 3.1.: World Trade in Agricultural Products, 2003
World Trade in Agricultural Products
Value in 2003 (US$ billion) 674 Share in world merchandise trade % 9.2 Share in world exports of primary products % 41.2
Source: WTO (2004)
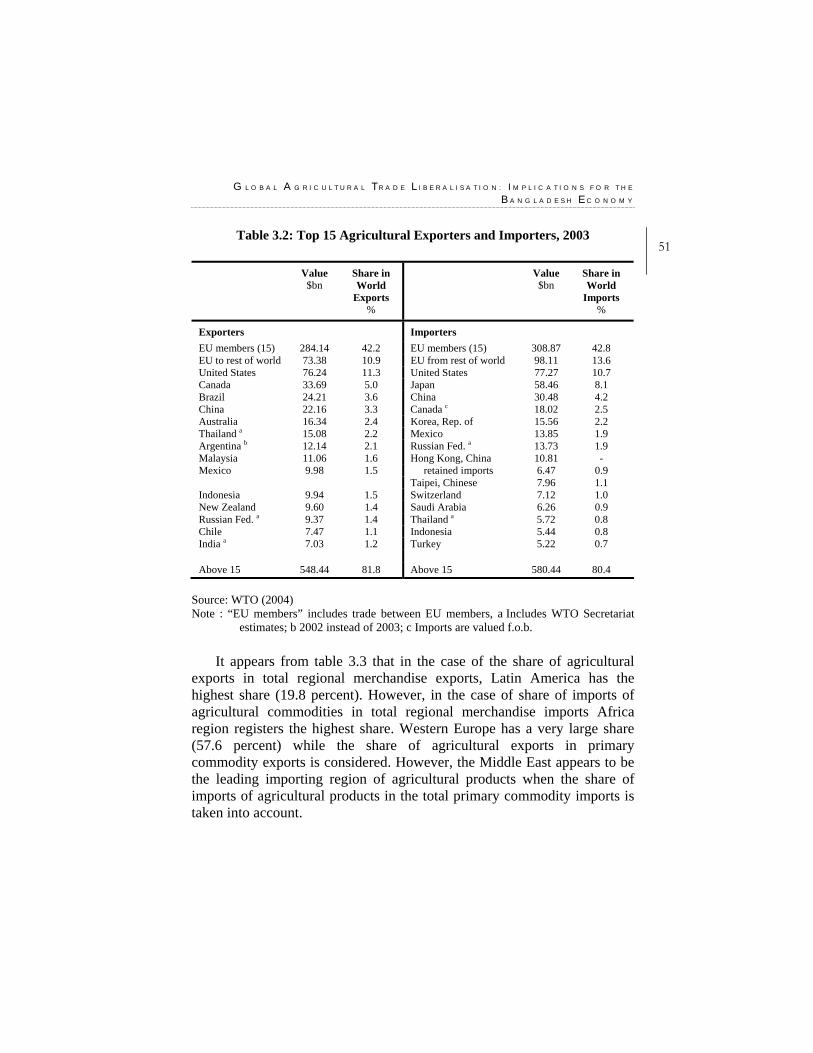
G L O B A L A G R I C U L T U R A L T R A D E L I B E R A L I S A T I O N : I M P L I C A T I O N S F O R T H E
B A N G L A D E S H E C O N O M Y
51Table 3.2: Top 15 Agricultural Exporters and Importers, 2003
Value
$bn Share in World
Exports %
Value$bn
Share in World
Imports %
Exporters Importers
EU members (15) 284.14 42.2 EU members (15) 308.87 42.8 EU to rest of world 73.38 10.9 EU from rest of world 98.11 13.6 United States 76.24 11.3 United States 77.27 10.7 Canada 33.69 5.0 Japan 58.46 8.1 Brazil 24.21 3.6 China 30.48 4.2 China 22.16 3.3 Canada c 18.02 2.5 Australia 16.34 2.4 Korea, Rep. of 15.56 2.2 Thailand a 15.08 2.2 Mexico 13.85 1.9 Argentina b 12.14 2.1 Russian Fed. a 13.73 1.9 Malaysia 11.06 1.6 Hong Kong, China 10.81 - Mexico 9.98 1.5 retained imports 6.47 0.9 Taipei, Chinese 7.96 1.1 Indonesia 9.94 1.5 Switzerland 7.12 1.0 New Zealand 9.60 1.4 Saudi Arabia 6.26 0.9 Russian Fed. a 9.37 1.4 Thailand a 5.72 0.8 Chile 7.47 1.1 Indonesia 5.44 0.8 India a 7.03 1.2 Turkey 5.22 0.7 Above 15 548.44 81.8 Above 15 580.44 80.4
Source: WTO (2004) Note : “EU members” includes trade between EU members, a Includes WTO Secretariat
estimates; b 2002 instead of 2003; c Imports are valued f.o.b.
It appears from table 3.3 that in the case of the share of agricultural exports in total regional merchandise exports, Latin America has the highest share (19.8 percent). However, in the case of share of imports of agricultural commodities in total regional merchandise imports Africa region registers the highest share. Western Europe has a very large share (57.6 percent) while the share of agricultural exports in primary commodity exports is considered. However, the Middle East appears to be the leading importing region of agricultural products when the share of imports of agricultural products in the total primary commodity imports is taken into account.
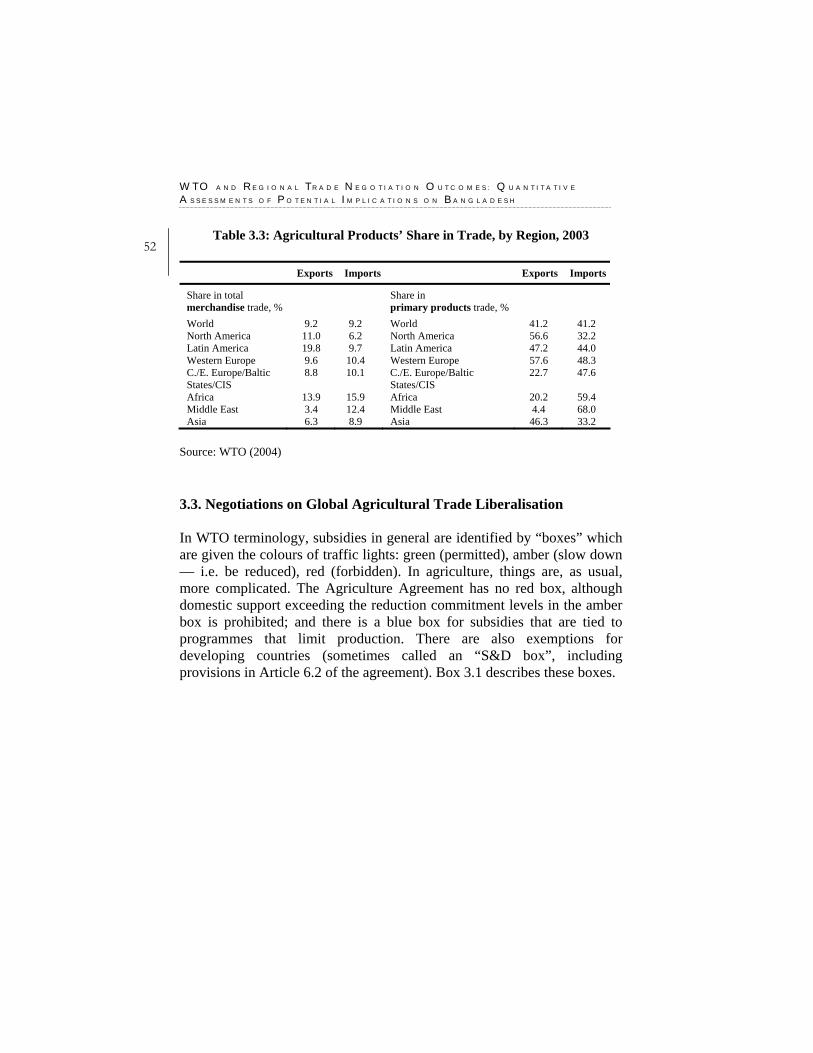
W T O A N D R E G I O N A L T R A D E N E G O T I A T I O N O U T C O M E S : Q U A N T I T A T I V E
A S S E S S M E N T S O F P O T E N T I A L I M P L I C A T I O N S O N B A N G L A D E S H
52 Table 3.3: Agricultural Products’ Share in Trade, by Region, 2003
Exports Imports Exports Imports
Share in total merchandise trade, %
Share in primary products trade, %
World 9.2 9.2 World 41.2 41.2 North America 11.0 6.2 North America 56.6 32.2 Latin America 19.8 9.7 Latin America 47.2 44.0 Western Europe 9.6 10.4 Western Europe 57.6 48.3 C./E. Europe/Baltic States/CIS
8.8 10.1 C./E. Europe/Baltic States/CIS
22.7 47.6
Africa 13.9 15.9 Africa 20.2 59.4 Middle East 3.4 12.4 Middle East 4.4 68.0 Asia 6.3 8.9 Asia 46.3 33.2
Source: WTO (2004) 3.3. Negotiations on Global Agricultural Trade Liberalisation In WTO terminology, subsidies in general are identified by “boxes” which are given the colours of traffic lights: green (permitted), amber (slow down — i.e. be reduced), red (forbidden). In agriculture, things are, as usual, more complicated. The Agriculture Agreement has no red box, although domestic support exceeding the reduction commitment levels in the amber box is prohibited; and there is a blue box for subsidies that are tied to programmes that limit production. There are also exemptions for developing countries (sometimes called an “S&D box”, including provisions in Article 6.2 of the agreement). Box 3.1 describes these boxes.
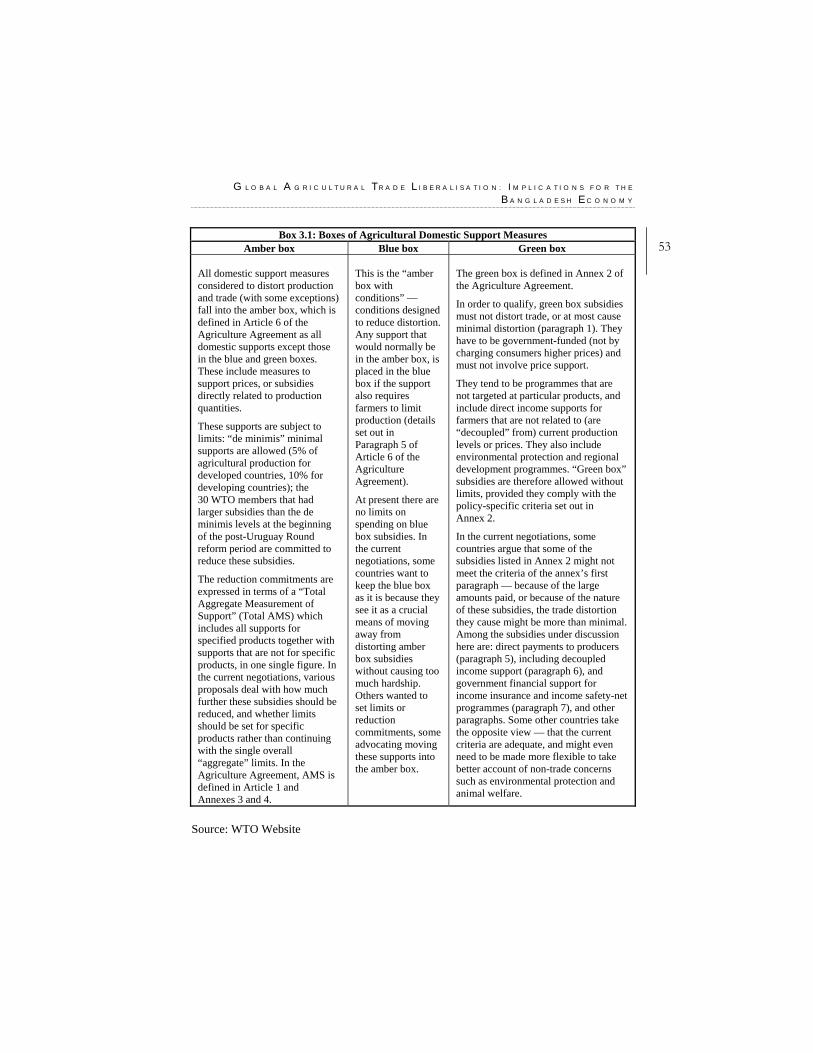
G L O B A L A G R I C U L T U R A L T R A D E L I B E R A L I S A T I O N : I M P L I C A T I O N S F O R T H E
B A N G L A D E S H E C O N O M Y
53Box 3.1: Boxes of Agricultural Domestic Support Measures
Amber box Blue box Green box All domestic support measures considered to distort production and trade (with some exceptions) fall into the amber box, which is defined in Article 6 of the Agriculture Agreement as all domestic supports except those in the blue and green boxes. These include measures to support prices, or subsidies directly related to production quantities.
These supports are subject to limits: “de minimis” minimal supports are allowed (5% of agricultural production for developed countries, 10% for developing countries); the 30 WTO members that had larger subsidies than the de minimis levels at the beginning of the post-Uruguay Round reform period are committed to reduce these subsidies.
The reduction commitments are expressed in terms of a “Total Aggregate Measurement of Support” (Total AMS) which includes all supports for specified products together with supports that are not for specific products, in one single figure. In the current negotiations, various proposals deal with how much further these subsidies should be reduced, and whether limits should be set for specific products rather than continuing with the single overall “aggregate” limits. In the Agriculture Agreement, AMS is defined in Article 1 and Annexes 3 and 4.
This is the “amber box with conditions” — conditions designed to reduce distortion. Any support that would normally be in the amber box, is placed in the blue box if the support also requires farmers to limit production (details set out in Paragraph 5 of Article 6 of the Agriculture Agreement).
At present there are no limits on spending on blue box subsidies. In the current negotiations, some countries want to keep the blue box as it is because they see it as a crucial means of moving away from distorting amber box subsidies without causing too much hardship. Others wanted to set limits or reduction commitments, some advocating moving these supports into the amber box.
The green box is defined in Annex 2 of the Agriculture Agreement.
In order to qualify, green box subsidies must not distort trade, or at most cause minimal distortion (paragraph 1). They have to be government-funded (not by charging consumers higher prices) and must not involve price support.
They tend to be programmes that are not targeted at particular products, and include direct income supports for farmers that are not related to (are “decoupled” from) current production levels or prices. They also include environmental protection and regional development programmes. “Green box” subsidies are therefore allowed without limits, provided they comply with the policy-specific criteria set out in Annex 2.
In the current negotiations, some countries argue that some of the subsidies listed in Annex 2 might not meet the criteria of the annex’s first paragraph — because of the large amounts paid, or because of the nature of these subsidies, the trade distortion they cause might be more than minimal. Among the subsidies under discussion here are: direct payments to producers (paragraph 5), including decoupled income support (paragraph 6), and government financial support for income insurance and income safety-net programmes (paragraph 7), and other paragraphs. Some other countries take the opposite view — that the current criteria are adequate, and might even need to be made more flexible to take better account of non-trade concerns such as environmental protection and animal welfare.
Source: WTO Website
W T O A N D R E G I O N A L T R A D E N E G O T I A T I O N O U T C O M E S : Q U A N T I T A T I V E
A S S E S S M E N T S O F P O T E N T I A L I M P L I C A T I O N S O N B A N G L A D E S H
54 While the Uruguay Round Agreement on Agriculture made some
significant progress on rules of trade in agriculture by replacing the QRs with tariffs and for specifying initial commitments on reduction of tariffs and subsidies, the momentum could not be maintained under the WTO-sponsored negotiations. The domestic support, given to agriculture in the developed countries, has not come down since the implementation of the commitments of the Uruguay Round began in 1995 (Naik, 2005). Although in the Doha Ministerial Declaration member countries, vowed to achieve substantial improvements in market access through phasing out of all forms of export subsidies and substantial reductions in trade-distorting domestic support (WTO 2001, para. 13), no major breakthrough has been made after the conclusion of the Hong Kong Ministerial conference, held in December 2005. While members are still negotiating modalities for further liberalisation, consensus has been reached on abolishing all export subsidies only by 2013 (WTO 2005, para 6).7 Figure 3.2 shows that export subsidies constitute very insignificant portion of the total domestic support measures given to agriculture in the developed countries.
Despite the lack of progress related to agricultural liberalisation in the post Uruguay Round period, there is no denying that, since most of the agricultural commodities have long been the most protected commodities in world trade, any significant liberalisation measure in this sector will likely to have huge welfare implications. It has, therefore, become a big concern to what extent future liberalisation in this sector will affect the livelihood and food security in the poor food-import dependent developing countries.
7 In the case of cotton, export subsidies by the developed countries were supposed to be
abolished in 2006.
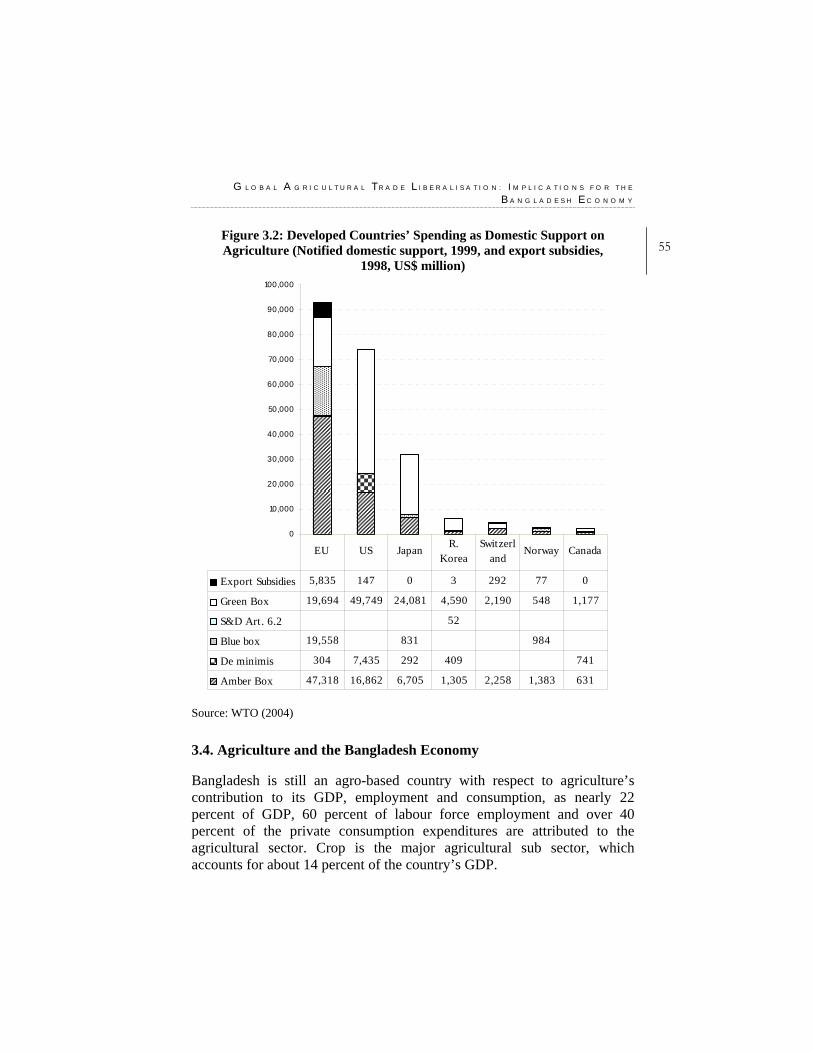
G L O B A L A G R I C U L T U R A L T R A D E L I B E R A L I S A T I O N : I M P L I C A T I O N S F O R T H E
B A N G L A D E S H E C O N O M Y
55Figure 3.2: Developed Countries’ Spending as Domestic Support on Agriculture (Notified domestic support, 1999, and export subsidies,
1998, US$ million)
0
10,000
20,000
30,000
40,000
50,000
60,000
70,000
80,000
90,000
100,000
Export Subsidies 5,835 147 0 3 292 77 0
Green Box 19,694 49,749 24,081 4,590 2,190 548 1,177
S&D Art. 6.2 52
Blue box 19,558 831 984
De minimis 304 7,435 292 409 741
Amber Box 47,318 16,862 6,705 1,305 2,258 1,383 631
EU US Japan R. Korea
Switzerland
Norway Canada
Source: WTO (2004)
3.4. Agriculture and the Bangladesh Economy Bangladesh is still an agro-based country with respect to agriculture’s contribution to its GDP, employment and consumption, as nearly 22 percent of GDP, 60 percent of labour force employment and over 40 percent of the private consumption expenditures are attributed to the agricultural sector. Crop is the major agricultural sub sector, which accounts for about 14 percent of the country’s GDP.
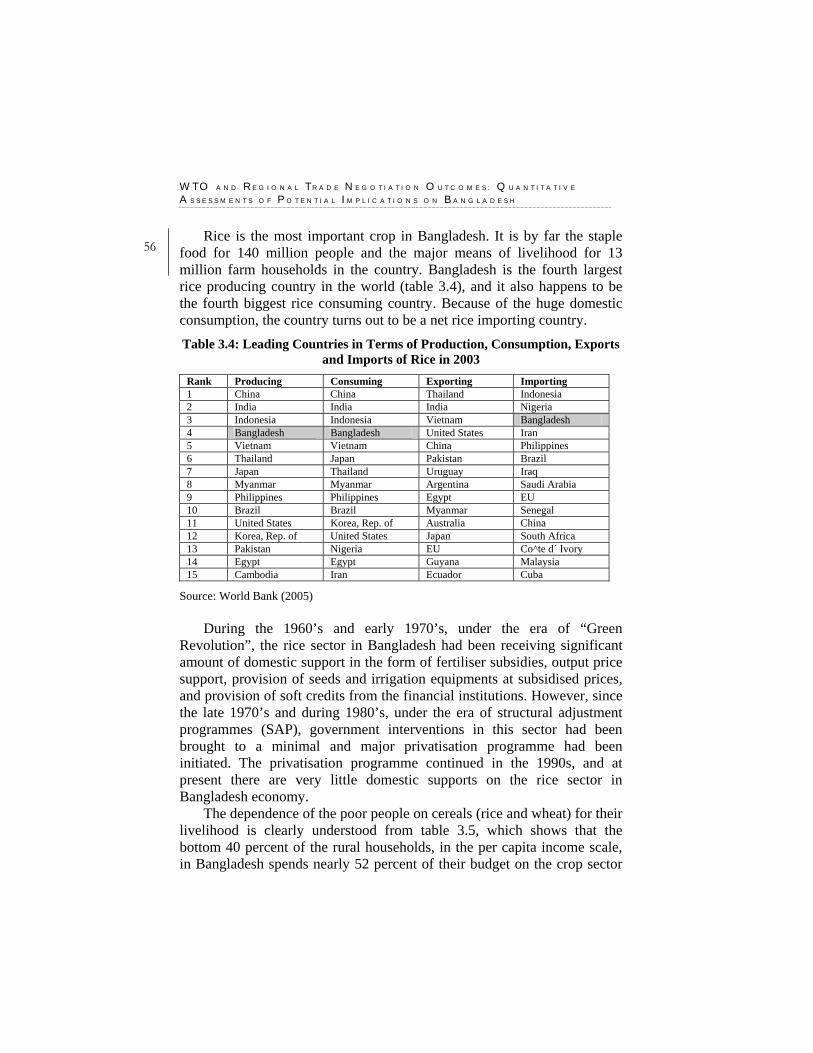
W T O A N D R E G I O N A L T R A D E N E G O T I A T I O N O U T C O M E S : Q U A N T I T A T I V E
A S S E S S M E N T S O F P O T E N T I A L I M P L I C A T I O N S O N B A N G L A D E S H
56 Rice is the most important crop in Bangladesh. It is by far the staple
food for 140 million people and the major means of livelihood for 13 million farm households in the country. Bangladesh is the fourth largest rice producing country in the world (table 3.4), and it also happens to be the fourth biggest rice consuming country. Because of the huge domestic consumption, the country turns out to be a net rice importing country. Table 3.4: Leading Countries in Terms of Production, Consumption, Exports
and Imports of Rice in 2003
Rank Producing Consuming Exporting Importing 1 China China Thailand Indonesia 2 India India India Nigeria 3 Indonesia Indonesia Vietnam Bangladesh 4 Bangladesh Bangladesh United States Iran 5 Vietnam Vietnam China Philippines 6 Thailand Japan Pakistan Brazil 7 Japan Thailand Uruguay Iraq 8 Myanmar Myanmar Argentina Saudi Arabia 9 Philippines Philippines Egypt EU 10 Brazil Brazil Myanmar Senegal 11 United States Korea, Rep. of Australia China 12 Korea, Rep. of United States Japan South Africa 13 Pakistan Nigeria EU Co^te d´ Ivory 14 Egypt Egypt Guyana Malaysia 15 Cambodia Iran Ecuador Cuba
Source: World Bank (2005)
During the 1960’s and early 1970’s, under the era of “Green Revolution”, the rice sector in Bangladesh had been receiving significant amount of domestic support in the form of fertiliser subsidies, output price support, provision of seeds and irrigation equipments at subsidised prices, and provision of soft credits from the financial institutions. However, since the late 1970’s and during 1980’s, under the era of structural adjustment programmes (SAP), government interventions in this sector had been brought to a minimal and major privatisation programme had been initiated. The privatisation programme continued in the 1990s, and at present there are very little domestic supports on the rice sector in Bangladesh economy.
The dependence of the poor people on cereals (rice and wheat) for their livelihood is clearly understood from table 3.5, which shows that the bottom 40 percent of the rural households, in the per capita income scale, in Bangladesh spends nearly 52 percent of their budget on the crop sector
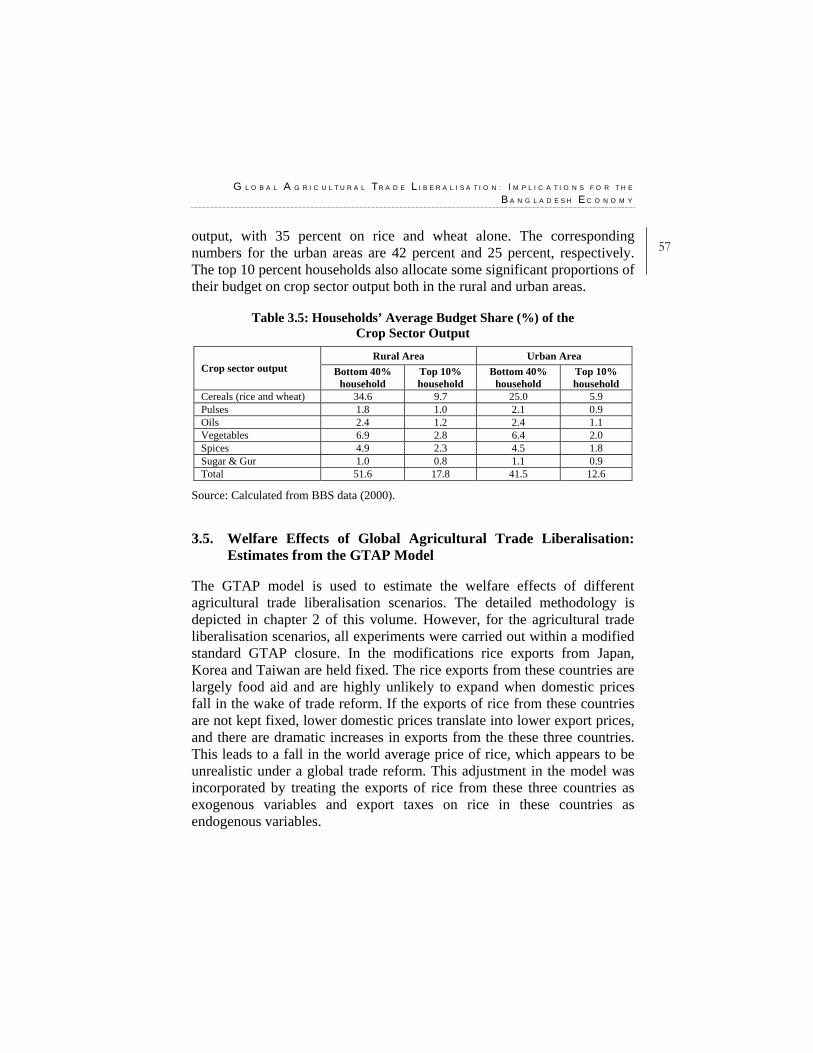
G L O B A L A G R I C U L T U R A L T R A D E L I B E R A L I S A T I O N : I M P L I C A T I O N S F O R T H E
B A N G L A D E S H E C O N O M Y
57output, with 35 percent on rice and wheat alone. The corresponding numbers for the urban areas are 42 percent and 25 percent, respectively. The top 10 percent households also allocate some significant proportions of their budget on crop sector output both in the rural and urban areas.
Table 3.5: Households’ Average Budget Share (%) of the Crop Sector Output
Rural Area Urban Area Crop sector output Bottom 40%
household Top 10% household
Bottom 40% household
Top 10% household
Cereals (rice and wheat) 34.6 9.7 25.0 5.9 Pulses 1.8 1.0 2.1 0.9 Oils 2.4 1.2 2.4 1.1 Vegetables 6.9 2.8 6.4 2.0 Spices 4.9 2.3 4.5 1.8 Sugar & Gur 1.0 0.8 1.1 0.9 Total 51.6 17.8 41.5 12.6
Source: Calculated from BBS data (2000). 3.5. Welfare Effects of Global Agricultural Trade Liberalisation:
Estimates from the GTAP Model The GTAP model is used to estimate the welfare effects of different agricultural trade liberalisation scenarios. The detailed methodology is depicted in chapter 2 of this volume. However, for the agricultural trade liberalisation scenarios, all experiments were carried out within a modified standard GTAP closure. In the modifications rice exports from Japan, Korea and Taiwan are held fixed. The rice exports from these countries are largely food aid and are highly unlikely to expand when domestic prices fall in the wake of trade reform. If the exports of rice from these countries are not kept fixed, lower domestic prices translate into lower export prices, and there are dramatic increases in exports from the these three countries. This leads to a fall in the world average price of rice, which appears to be unrealistic under a global trade reform. This adjustment in the model was incorporated by treating the exports of rice from these three countries as exogenous variables and export taxes on rice in these countries as endogenous variables.
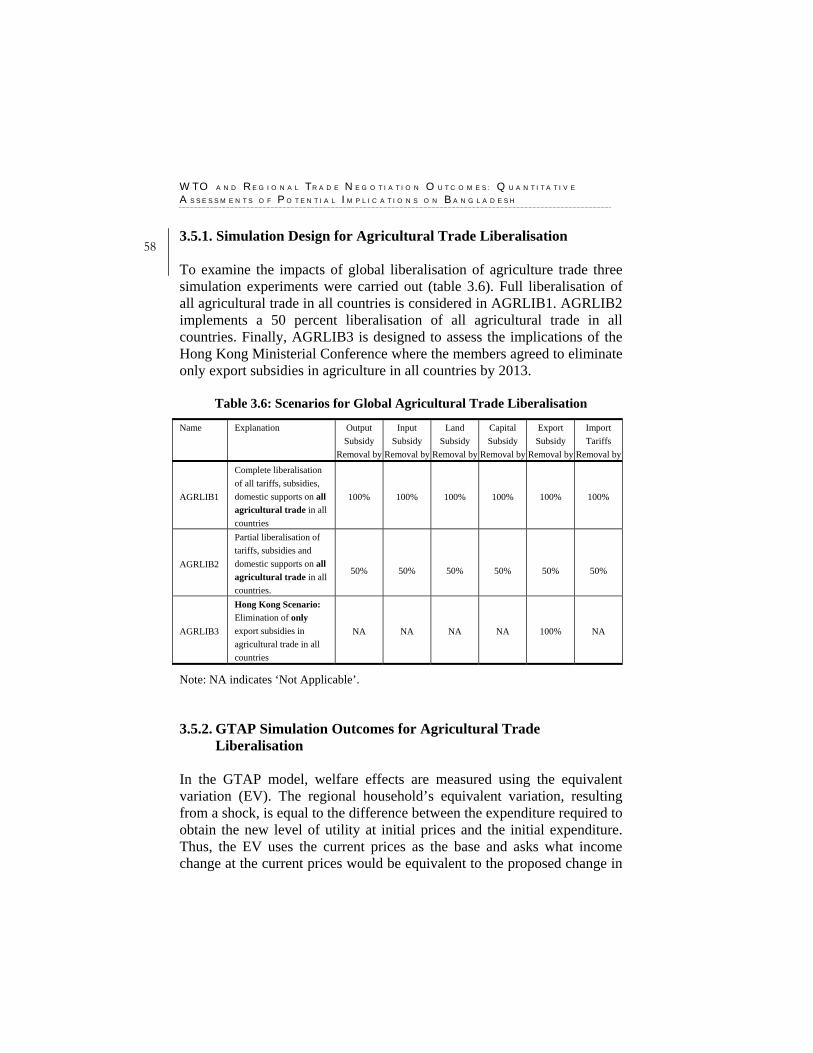
W T O A N D R E G I O N A L T R A D E N E G O T I A T I O N O U T C O M E S : Q U A N T I T A T I V E
A S S E S S M E N T S O F P O T E N T I A L I M P L I C A T I O N S O N B A N G L A D E S H
58 3.5.1. Simulation Design for Agricultural Trade Liberalisation To examine the impacts of global liberalisation of agriculture trade three simulation experiments were carried out (table 3.6). Full liberalisation of all agricultural trade in all countries is considered in AGRLIB1. AGRLIB2 implements a 50 percent liberalisation of all agricultural trade in all countries. Finally, AGRLIB3 is designed to assess the implications of the Hong Kong Ministerial Conference where the members agreed to eliminate only export subsidies in agriculture in all countries by 2013.
Table 3.6: Scenarios for Global Agricultural Trade Liberalisation
Name Explanation Output Subsidy
Removal by
Input Subsidy
Removal by
Land Subsidy
Removal by
Capital Subsidy
Removal by
Export Subsidy
Removal by
Import Tariffs
Removal by
AGRLIB1
Complete liberalisation of all tariffs, subsidies, domestic supports on all agricultural trade in all countries
100% 100% 100% 100% 100% 100%
AGRLIB2
Partial liberalisation of tariffs, subsidies and domestic supports on all agricultural trade in all countries.
50%
50%
50%
50%
50%
50%
AGRLIB3
Hong Kong Scenario: Elimination of only export subsidies in agricultural trade in all countries
NA NA NA NA 100% NA
Note: NA indicates ‘Not Applicable’. 3.5.2. GTAP Simulation Outcomes for Agricultural Trade
Liberalisation In the GTAP model, welfare effects are measured using the equivalent variation (EV). The regional household’s equivalent variation, resulting from a shock, is equal to the difference between the expenditure required to obtain the new level of utility at initial prices and the initial expenditure. Thus, the EV uses the current prices as the base and asks what income change at the current prices would be equivalent to the proposed change in
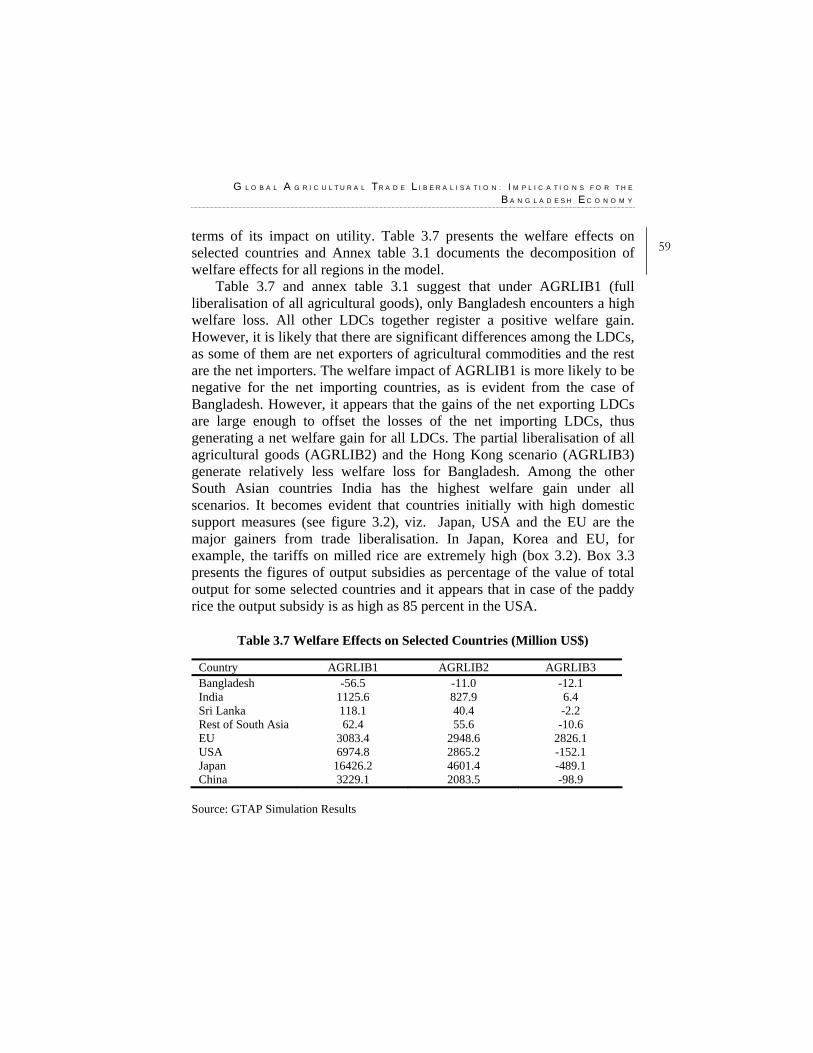
G L O B A L A G R I C U L T U R A L T R A D E L I B E R A L I S A T I O N : I M P L I C A T I O N S F O R T H E
B A N G L A D E S H E C O N O M Y
59terms of its impact on utility. Table 3.7 presents the welfare effects on selected countries and Annex table 3.1 documents the decomposition of welfare effects for all regions in the model.
Table 3.7 and annex table 3.1 suggest that under AGRLIB1 (full liberalisation of all agricultural goods), only Bangladesh encounters a high welfare loss. All other LDCs together register a positive welfare gain. However, it is likely that there are significant differences among the LDCs, as some of them are net exporters of agricultural commodities and the rest are the net importers. The welfare impact of AGRLIB1 is more likely to be negative for the net importing countries, as is evident from the case of Bangladesh. However, it appears that the gains of the net exporting LDCs are large enough to offset the losses of the net importing LDCs, thus generating a net welfare gain for all LDCs. The partial liberalisation of all agricultural goods (AGRLIB2) and the Hong Kong scenario (AGRLIB3) generate relatively less welfare loss for Bangladesh. Among the other South Asian countries India has the highest welfare gain under all scenarios. It becomes evident that countries initially with high domestic support measures (see figure 3.2), viz. Japan, USA and the EU are the major gainers from trade liberalisation. In Japan, Korea and EU, for example, the tariffs on milled rice are extremely high (box 3.2). Box 3.3 presents the figures of output subsidies as percentage of the value of total output for some selected countries and it appears that in case of the paddy rice the output subsidy is as high as 85 percent in the USA.
Table 3.7 Welfare Effects on Selected Countries (Million US$)
Country AGRLIB1 AGRLIB2 AGRLIB3 Bangladesh -56.5 -11.0 -12.1 India 1125.6 827.9 6.4 Sri Lanka 118.1 40.4 -2.2 Rest of South Asia 62.4 55.6 -10.6 EU 3083.4 2948.6 2826.1 USA 6974.8 2865.2 -152.1 Japan 16426.2 4601.4 -489.1 China 3229.1 2083.5 -98.9
Source: GTAP Simulation Results
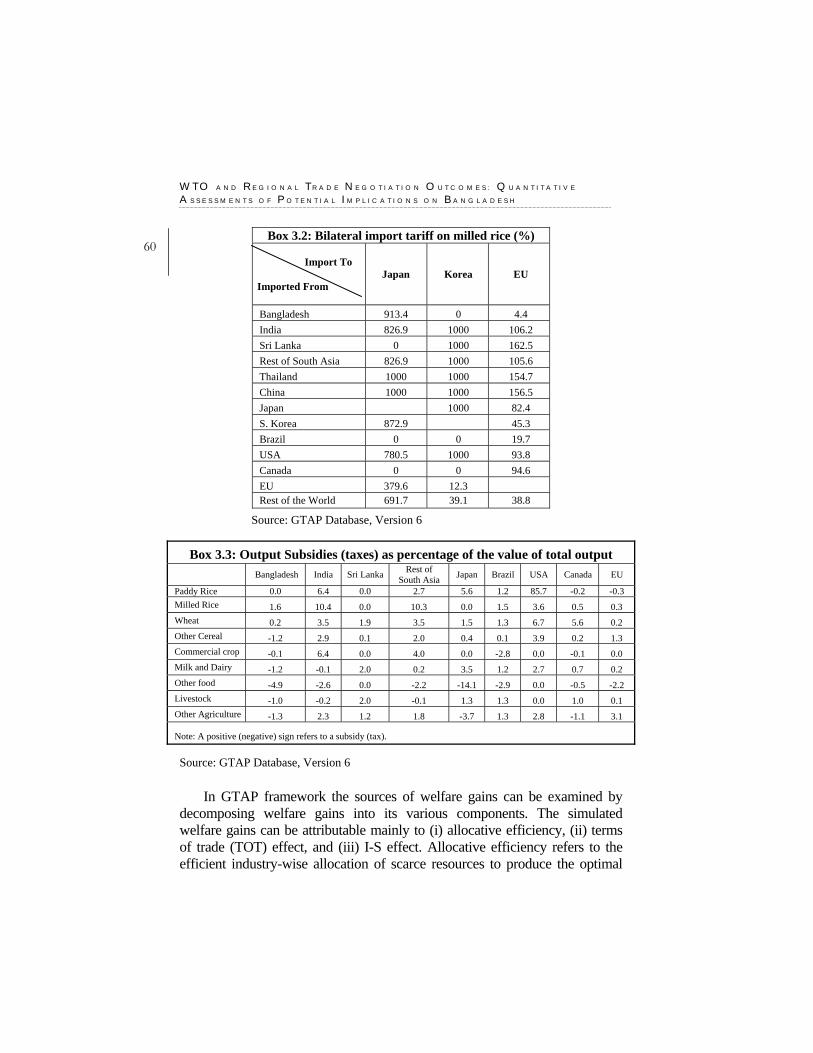
W T O A N D R E G I O N A L T R A D E N E G O T I A T I O N O U T C O M E S : Q U A N T I T A T I V E
A S S E S S M E N T S O F P O T E N T I A L I M P L I C A T I O N S O N B A N G L A D E S H
60 Box 3.2: Bilateral import tariff on milled rice (%)
Import To
Imported From Japan Korea EU
Bangladesh 913.4 0 4.4 India 826.9 1000 106.2 Sri Lanka 0 1000 162.5 Rest of South Asia 826.9 1000 105.6 Thailand 1000 1000 154.7 China 1000 1000 156.5 Japan 1000 82.4 S. Korea 872.9 45.3 Brazil 0 0 19.7 USA 780.5 1000 93.8 Canada 0 0 94.6 EU 379.6 12.3 Rest of the World 691.7 39.1 38.8
Source: GTAP Database, Version 6
Box 3.3: Output Subsidies (taxes) as percentage of the value of total output Bangladesh India Sri Lanka Rest of
South Asia Japan Brazil USA Canada EU
Paddy Rice 0.0 6.4 0.0 2.7 5.6 1.2 85.7 -0.2 -0.3 Milled Rice 1.6 10.4 0.0 10.3 0.0 1.5 3.6 0.5 0.3 Wheat 0.2 3.5 1.9 3.5 1.5 1.3 6.7 5.6 0.2 Other Cereal -1.2 2.9 0.1 2.0 0.4 0.1 3.9 0.2 1.3 Commercial crop -0.1 6.4 0.0 4.0 0.0 -2.8 0.0 -0.1 0.0 Milk and Dairy -1.2 -0.1 2.0 0.2 3.5 1.2 2.7 0.7 0.2 Other food -4.9 -2.6 0.0 -2.2 -14.1 -2.9 0.0 -0.5 -2.2 Livestock -1.0 -0.2 2.0 -0.1 1.3 1.3 0.0 1.0 0.1 Other Agriculture -1.3 2.3 1.2 1.8 -3.7 1.3 2.8 -1.1 3.1
Note: A positive (negative) sign refers to a subsidy (tax). Source: GTAP Database, Version 6
In GTAP framework the sources of welfare gains can be examined by decomposing welfare gains into its various components. The simulated welfare gains can be attributable mainly to (i) allocative efficiency, (ii) terms of trade (TOT) effect, and (iii) I-S effect. Allocative efficiency refers to the efficient industry-wise allocation of scarce resources to produce the optimal
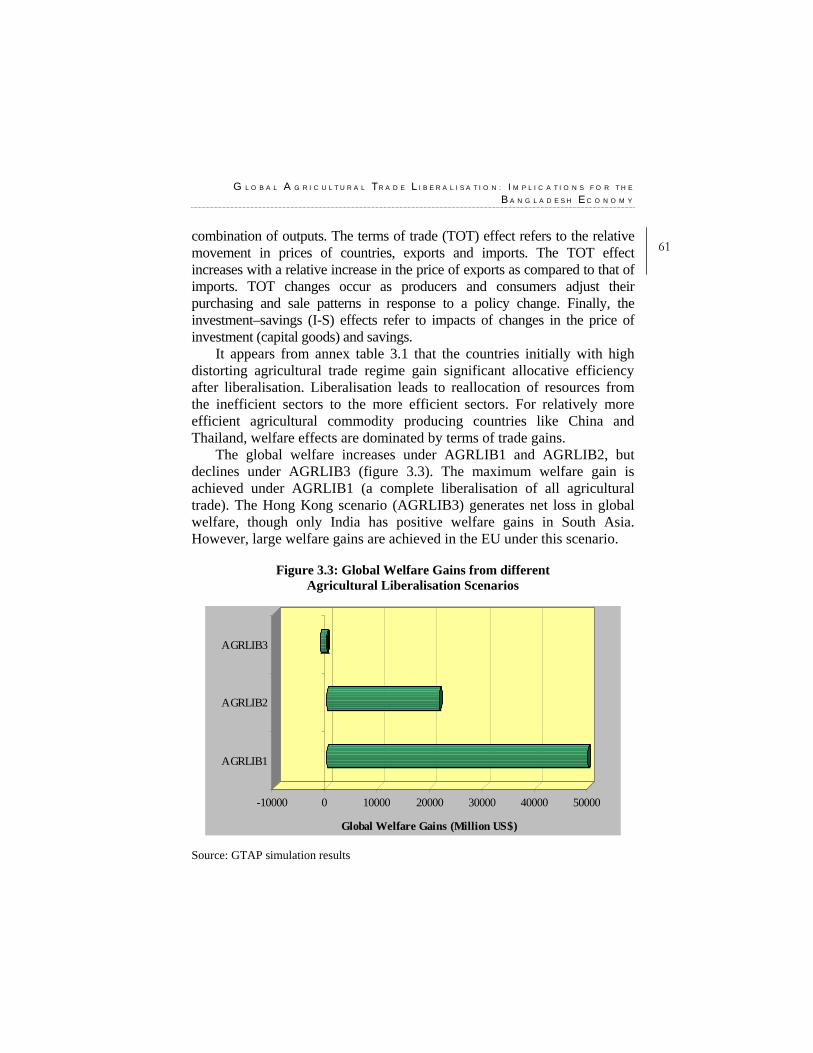
G L O B A L A G R I C U L T U R A L T R A D E L I B E R A L I S A T I O N : I M P L I C A T I O N S F O R T H E
B A N G L A D E S H E C O N O M Y
61combination of outputs. The terms of trade (TOT) effect refers to the relative movement in prices of countries, exports and imports. The TOT effect increases with a relative increase in the price of exports as compared to that of imports. TOT changes occur as producers and consumers adjust their purchasing and sale patterns in response to a policy change. Finally, the investment–savings (I-S) effects refer to impacts of changes in the price of investment (capital goods) and savings.
It appears from annex table 3.1 that the countries initially with high distorting agricultural trade regime gain significant allocative efficiency after liberalisation. Liberalisation leads to reallocation of resources from the inefficient sectors to the more efficient sectors. For relatively more efficient agricultural commodity producing countries like China and Thailand, welfare effects are dominated by terms of trade gains.
The global welfare increases under AGRLIB1 and AGRLIB2, but declines under AGRLIB3 (figure 3.3). The maximum welfare gain is achieved under AGRLIB1 (a complete liberalisation of all agricultural trade). The Hong Kong scenario (AGRLIB3) generates net loss in global welfare, though only India has positive welfare gains in South Asia. However, large welfare gains are achieved in the EU under this scenario.
Figure 3.3: Global Welfare Gains from different Agricultural Liberalisation Scenarios
-10000 0 10000 20000 30000 40000 50000
Global Welfare Gains (Million US$)
AGRLIB1
AGRLIB2
AGRLIB3
Source: GTAP simulation results
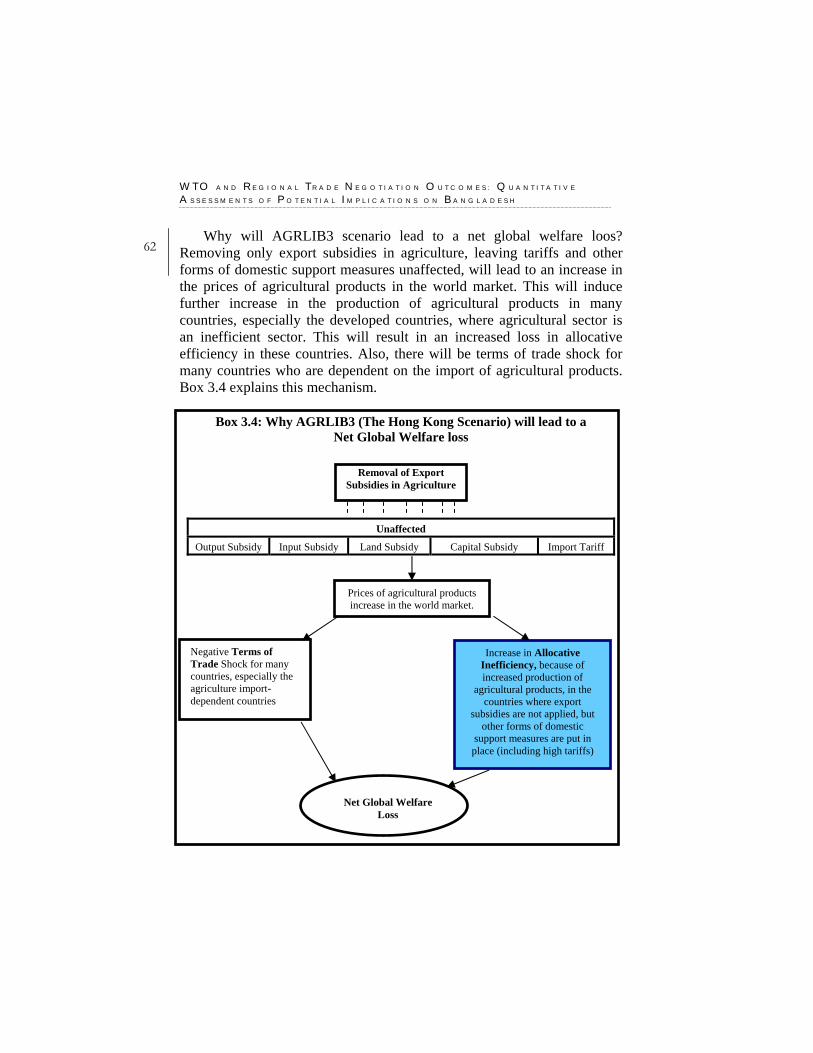
W T O A N D R E G I O N A L T R A D E N E G O T I A T I O N O U T C O M E S : Q U A N T I T A T I V E
A S S E S S M E N T S O F P O T E N T I A L I M P L I C A T I O N S O N B A N G L A D E S H
62 Why will AGRLIB3 scenario lead to a net global welfare loos?
Removing only export subsidies in agriculture, leaving tariffs and other forms of domestic support measures unaffected, will lead to an increase in the prices of agricultural products in the world market. This will induce further increase in the production of agricultural products in many countries, especially the developed countries, where agricultural sector is an inefficient sector. This will result in an increased loss in allocative efficiency in these countries. Also, there will be terms of trade shock for many countries who are dependent on the import of agricultural products. Box 3.4 explains this mechanism.
Box 3.4: Why AGRLIB3 (The Hong Kong Scenario) will lead to a Net Global Welfare loss
Unaffected
Output Subsidy Input Subsidy Land Subsidy Capital Subsidy Import Tariff
Removal of Export Subsidies in Agriculture
Prices of agricultural products increase in the world market.
Increase in Allocative Inefficiency, because of increased production of
agricultural products, in the countries where export
subsidies are not applied, but other forms of domestic
support measures are put in place (including high tariffs)
Negative Terms of Trade Shock for many countries, especially the agriculture import-dependent countries
Net Global Welfare Loss
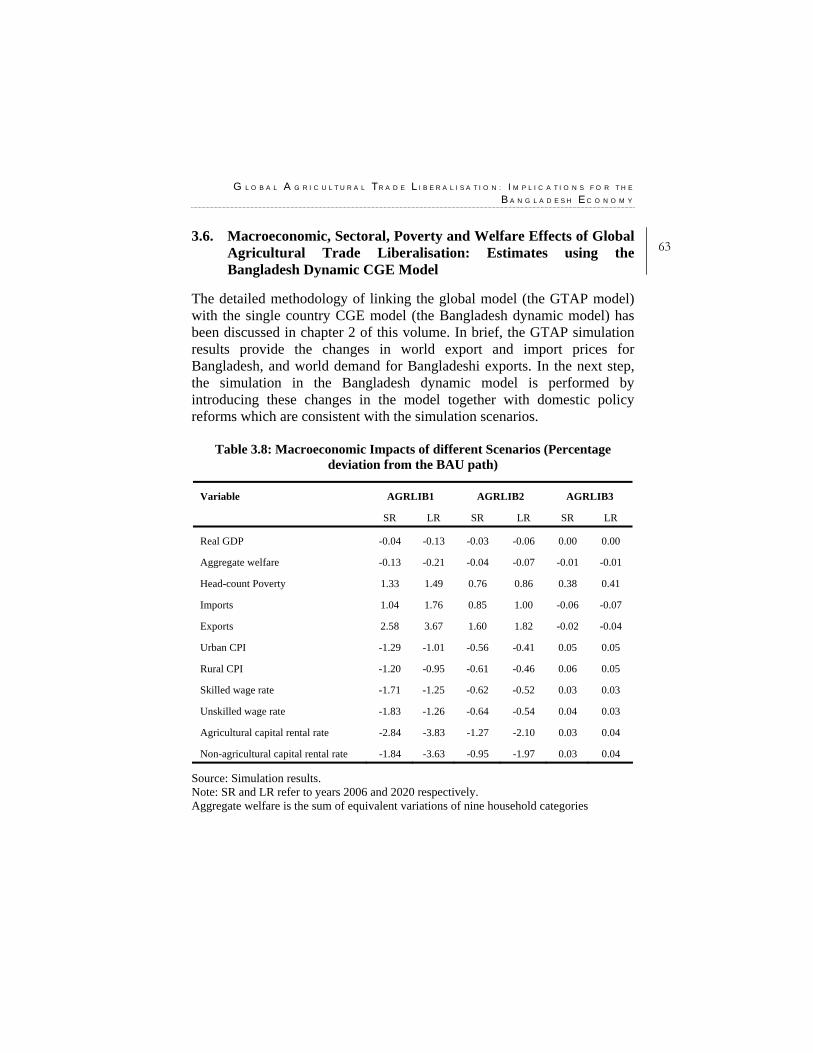
G L O B A L A G R I C U L T U R A L T R A D E L I B E R A L I S A T I O N : I M P L I C A T I O N S F O R T H E
B A N G L A D E S H E C O N O M Y
633.6. Macroeconomic, Sectoral, Poverty and Welfare Effects of Global
Agricultural Trade Liberalisation: Estimates using the Bangladesh Dynamic CGE Model
The detailed methodology of linking the global model (the GTAP model) with the single country CGE model (the Bangladesh dynamic model) has been discussed in chapter 2 of this volume. In brief, the GTAP simulation results provide the changes in world export and import prices for Bangladesh, and world demand for Bangladeshi exports. In the next step, the simulation in the Bangladesh dynamic model is performed by introducing these changes in the model together with domestic policy reforms which are consistent with the simulation scenarios.
Table 3.8: Macroeconomic Impacts of different Scenarios (Percentage deviation from the BAU path)
Variable AGRLIB1 AGRLIB2 AGRLIB3
SR LR SR LR SR LR
Real GDP -0.04 -0.13 -0.03 -0.06 0.00 0.00
Aggregate welfare -0.13 -0.21 -0.04 -0.07 -0.01 -0.01
Head-count Poverty 1.33 1.49 0.76 0.86 0.38 0.41
Imports 1.04 1.76 0.85 1.00 -0.06 -0.07
Exports 2.58 3.67 1.60 1.82 -0.02 -0.04
Urban CPI -1.29 -1.01 -0.56 -0.41 0.05 0.05
Rural CPI -1.20 -0.95 -0.61 -0.46 0.06 0.05
Skilled wage rate -1.71 -1.25 -0.62 -0.52 0.03 0.03
Unskilled wage rate -1.83 -1.26 -0.64 -0.54 0.04 0.03
Agricultural capital rental rate -2.84 -3.83 -1.27 -2.10 0.03 0.04
Non-agricultural capital rental rate -1.84 -3.63 -0.95 -1.97 0.03 0.04
Source: Simulation results. Note: SR and LR refer to years 2006 and 2020 respectively. Aggregate welfare is the sum of equivalent variations of nine household categories
W T O A N D R E G I O N A L T R A D E N E G O T I A T I O N O U T C O M E S : Q U A N T I T A T I V E
A S S E S S M E N T S O F P O T E N T I A L I M P L I C A T I O N S O N B A N G L A D E S H
64 3.6.1. Results of the Bangladesh Dynamic Model for AGRLIB1 Under AGRLIB1, together with the GTAP shocks domestic tariffs on all agricultural products in Bangladesh are abolished. Annex table 3.2 presents the impact of AGRLIB1 scenario on sectoral prices in the Bangladesh economy. It appears that, even though global agricultural liberalisation leads to increase in the prices Bangladeshi imports of agricultural goods, domestic full tariff liberalisation in the agricultural sector offsets the rise in the import prices, and the net effect is the fall in import prices in most of the agricultural sectors, except rice. The manufacturing and service sectors in the economy, however, experience rise in import prices. Global liberalisation of agricultural sector also leads to a rise in the prices and demands for the major Bangladeshi export items like woven and knit ready-made garments. Also, there is a high rise in the world export demand for Bangladeshi commercial crops, as export demand in this sector rises by around 20 percent.
Under this scenario GDP and welfare decline both in the short and long run, though the long run effects are more intense (table 3.8). The effect on aggregate welfare is negative in this scenario. Also, there are strong negative impacts on the head-count poverty both in the short and long run. Both imports and exports register positive growth in the short run, and growth effects are stronger in the long run. Consumer prices for both rural and urban households fall because of the fall in domestic import prices of most of the commodities. Both skilled and unskilled wage rates fall, but unskilled wage rate falls more than the skilled wage rate. However, wage rates decline at smaller magnitudes in the long run when capital is reallocated toward the expanding sectors. Also, both the agricultural and non-agricultural capital rental rates decline, though the decline is more prominent among the agricultural scale sectors.
The impacts of the simulation on sectoral volumes are reported in annex table 3.3. In the short run, increase in the import price of rice translates into a fall in the imports of rice (annex tables 3.2 and 3.3). However, fall in import prices in other agricultural sectors lead to increase in imports in these sectors. In the dynamic CGE model framework, the efficiency effects (reallocation of resources) together with the long-run accumulation effects determine the impacts on production and factor reallocation. In agriculture, only the commercial crop sector expands, because of the large increase in export demand, whereas the paddy sector
G L O B A L A G R I C U L T U R A L T R A D E L I B E R A L I S A T I O N : I M P L I C A T I O N S F O R T H E
B A N G L A D E S H E C O N O M Y
65contracts. On the other hand, most of the manufacturing sectors expand. Specifically, there has been some expansion in the export-oriented manufacturing sectors, because of the increase in world export demand and export prices. The long run effects are quite similar to the short run effects. However, the expansion in the export-oriented manufacturing sectors is much stronger in the long run.
The impacts of the current simulation on factor remunerations are influenced by the model assumption that labour is mobile across sectors in both the short and long run, whereas capital is mobile only after the first year and through new investments. As a result, the short-term variations in the returns to capital are more visible. Under the current simulation, it clearly appears that given the expansion of the industrial sectors, capital and both skilled and unskilled labour are reallocated from most of the agricultural sectors to the industrial sectors. The long run resource allocation effects are much similar to the short run effects. Short run increases in capital rental rates in the expanding sectors lead to a long-term reallocation of investment from the agricultural sectors to the industrial sectors.
The welfare impacts of the current simulation are measured by the Equivalent Variations (EVs), the effects on household nominal incomes and the CPI (annex table 3.4) of the rural and urban households. The HIES 2000 includes 7,439 households, of which almost 80 percent live in the rural areas. Recall from table 2.5 of chapter 2 of this volume that factor remunerations constitute the largest share of household income in Bangladesh. In the short run, all households experience fall in income because of the fall in both wage rates and capital rental rates (table 3.6). Annex table 3.4 suggests that consumer price indices for all households also fall as a result of the fall in import prices of most of the agricultural commodities. However, the fall in income is higher than the fall in consumer prices for all households. Therefore, real income growth for all households is negative. Again, all households also suffer from welfare loss. The negative changes in real income and welfare in the long run are much stronger than those under the short run. In the rural area, large and small farm households are hurt most as a result of their high reliance on the agricultural capital income, and because of the fact that agricultural capital rental rate decline by high margin under the current scenario. In the urban area, welfare losses are more acute for the households with medium- and
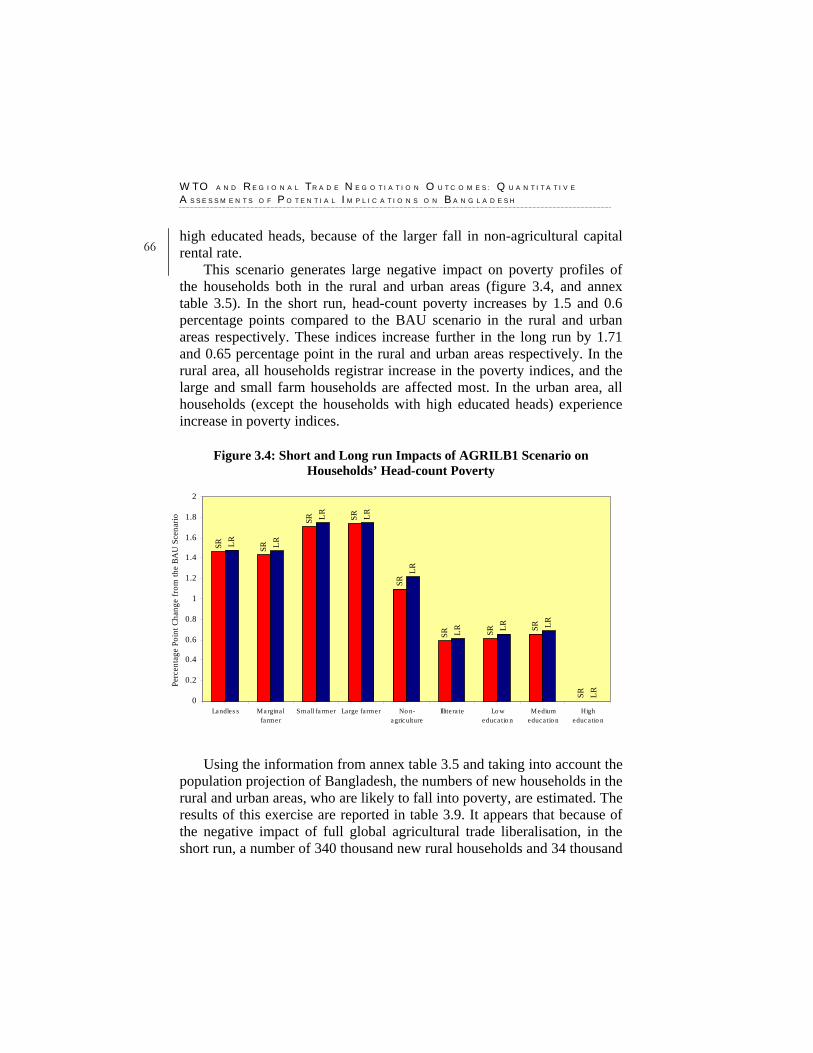
W T O A N D R E G I O N A L T R A D E N E G O T I A T I O N O U T C O M E S : Q U A N T I T A T I V E
A S S E S S M E N T S O F P O T E N T I A L I M P L I C A T I O N S O N B A N G L A D E S H
66 high educated heads, because of the larger fall in non-agricultural capital rental rate.
This scenario generates large negative impact on poverty profiles of the households both in the rural and urban areas (figure 3.4, and annex table 3.5). In the short run, head-count poverty increases by 1.5 and 0.6 percentage points compared to the BAU scenario in the rural and urban areas respectively. These indices increase further in the long run by 1.71 and 0.65 percentage point in the rural and urban areas respectively. In the rural area, all households registrar increase in the poverty indices, and the large and small farm households are affected most. In the urban area, all households (except the households with high educated heads) experience increase in poverty indices.
Figure 3.4: Short and Long run Impacts of AGRILB1 Scenario on Households’ Head-count Poverty
SR SR
SR SR
SR
SR SR SR
SR
LR LR
LR LR
LR
LR LR LR
LR0
0.2
0.4
0.6
0.8
1
1.2
1.4
1.6
1.8
2
Landles s Marginalfarmer
Small fa rmer Large farmer No n-agriculture
Illite ra te Lo weduca tio n
Mediumeduca tio n
Higheduca tio n
Perc
enta
ge P
oint
Cha
nge
from
the
BAU
Sce
nario
Using the information from annex table 3.5 and taking into account the
population projection of Bangladesh, the numbers of new households in the rural and urban areas, who are likely to fall into poverty, are estimated. The results of this exercise are reported in table 3.9. It appears that because of the negative impact of full global agricultural trade liberalisation, in the short run, a number of 340 thousand new rural households and 34 thousand
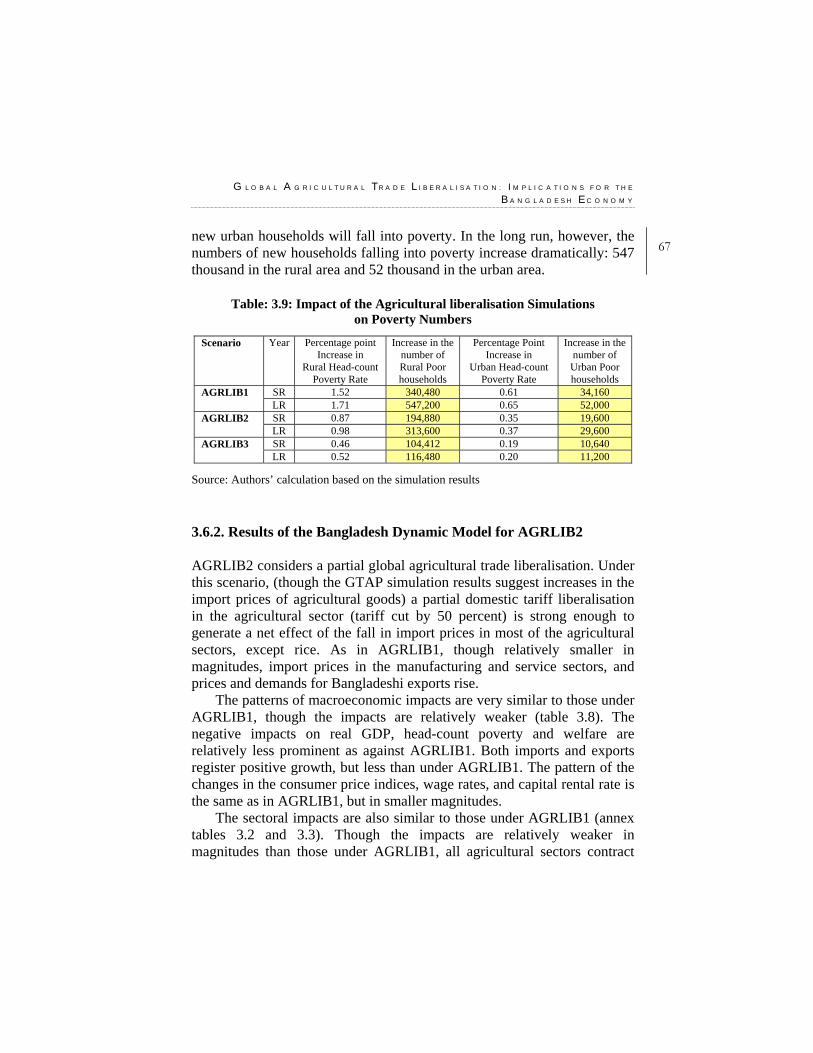
G L O B A L A G R I C U L T U R A L T R A D E L I B E R A L I S A T I O N : I M P L I C A T I O N S F O R T H E
B A N G L A D E S H E C O N O M Y
67new urban households will fall into poverty. In the long run, however, the numbers of new households falling into poverty increase dramatically: 547 thousand in the rural area and 52 thousand in the urban area.
Table: 3.9: Impact of the Agricultural liberalisation Simulations on Poverty Numbers
Scenario Year Percentage point
Increase in Rural Head-count
Poverty Rate
Increase in the number of Rural Poor households
Percentage Point Increase in
Urban Head-count Poverty Rate
Increase in the number of Urban Poor households
SR 1.52 340,480 0.61 34,160 AGRLIB1 LR 1.71 547,200 0.65 52,000
SR 0.87 194,880 0.35 19,600 AGRLIB2 LR 0.98 313,600 0.37 29,600 SR 0.46 104,412 0.19 10,640 AGRLIB3 LR 0.52 116,480 0.20 11,200
Source: Authors’ calculation based on the simulation results 3.6.2. Results of the Bangladesh Dynamic Model for AGRLIB2 AGRLIB2 considers a partial global agricultural trade liberalisation. Under this scenario, (though the GTAP simulation results suggest increases in the import prices of agricultural goods) a partial domestic tariff liberalisation in the agricultural sector (tariff cut by 50 percent) is strong enough to generate a net effect of the fall in import prices in most of the agricultural sectors, except rice. As in AGRLIB1, though relatively smaller in magnitudes, import prices in the manufacturing and service sectors, and prices and demands for Bangladeshi exports rise.
The patterns of macroeconomic impacts are very similar to those under AGRLIB1, though the impacts are relatively weaker (table 3.8). The negative impacts on real GDP, head-count poverty and welfare are relatively less prominent as against AGRLIB1. Both imports and exports register positive growth, but less than under AGRLIB1. The pattern of the changes in the consumer price indices, wage rates, and capital rental rate is the same as in AGRLIB1, but in smaller magnitudes.
The sectoral impacts are also similar to those under AGRLIB1 (annex tables 3.2 and 3.3). Though the impacts are relatively weaker in magnitudes than those under AGRLIB1, all agricultural sectors contract
W T O A N D R E G I O N A L T R A D E N E G O T I A T I O N O U T C O M E S : Q U A N T I T A T I V E
A S S E S S M E N T S O F P O T E N T I A L I M P L I C A T I O N S O N B A N G L A D E S H
68 (except commercial crop) and resources are reallocated to the manufacturing and service industries.
Similar to AGRLIB1, all households suffer from the losses in real income and welfare (annex table 3.4). The large and small farm households in the rural area and the medium and high educated households in the urban area turn out to the largest losers.
As in AGRLIB1, poverty indices increase more acutely in the rural area than in the urban area, though in lesser magnitudes compared to AGRLIB1 (annex table 3.5). In the short run, rural and urban poverty increase by 0.87 and 0.35 percentage points respectively as against the BAU scenario, which result in an increase in the number of households falling into poverty by 194 thousand in the rural area and 19 thousand in the urban area (table 3.9). In the long run poverty further deteriorates both in the rural and urban areas. Again, large and small farm households in the rural area, and households with medium educated heads in the urban area experience larger rise in poverty. In the long run, in the rural and urban areas the numbers of poor households increase by 313 thousand and 29 thousand respectively (table 3.9).
3.6.3. Results of the Bangladesh Dynamic Model for AGRLIB 3 As stated before, AGRLIB3 is the Hong Kong scenario which is nothing but the removal of only agricultural export subsidies at the global level. The results from the GTAP model are introduced in the Bangladesh dynamic model. It appears that AGRLIB3 induces increases in the import prices of the agricultural commodities in Bangladesh. There are also some increases in the export prices and export demand for few agricultural commodities of Bangladesh.
At the macro level, AGRLIB3 produces virtually no effect on real GDP of the country (table 3.8). However, there are some negative welfare effects and some increases in the head-count poverty both in the short and long runs. The impacts on imports and exports are also very minimal. The consumer price indices increase both in the rural and urban areas. The increase in the unskilled wage rate is slightly higher than that of the skilled wage rate. The capital rental rates for the agricultural and non-agriculture sectors increase both in the short and long run.
G L O B A L A G R I C U L T U R A L T R A D E L I B E R A L I S A T I O N : I M P L I C A T I O N S F O R T H E
B A N G L A D E S H E C O N O M Y
69At the sectoral level, the impacts are very minimal, though there are
some expansions of the agricultural sub-sectors (annex tables 3.2 and 3.3). On the contrary, there are some contractions of the manufacturing and service sectors. It thus appears that AGRLIB3, though registering low effects, favours the agricultural sector.
With respect to households’ welfare, it appears that poorer households in the rural and urban areas experience higher welfare losses than the richer households (annex table 3.4). Only the large farm households register an increase in the welfare.
AGRLIB3 appears to increase poverty for most of the household categories, and only large farm households experience decline in poverty (annex table 3.5). There are some increases in the rural and urban poverty both in the short and long run. Table 3.9 suggests that in the short run the number of rural poor households increase by 104 thousands, whereas the corresponding number for the urban area is 10 thousand. In the long run, these numbers further increase and 116 thousand and 11 thousand new households fall into poverty in the rural and urban areas respectively. 3.7. Conclusion This chapter has examined the impact of global liberalisation of agricultural trade on the economies of different countries as well as on the economy of Bangladesh. The general equilibrium modelling framework of the Global Trade Analysis Project (GTAP) has been applied to explore regional and global welfare effects of different liberalisation scenarios. The simulation results reveal that full global liberalisation of the trade in agricultural products will generate some significant global welfare gains. However, while partial liberalisation leads to some modest increase in world trade and welfare gains, the impact of complete removal of export subsidies alone, as agreed in the Hong Kong Ministerial Conference, will generate some net global welfare loss. The simulation results clearly demonstrate that the global distribution of welfare gains from agricultural trade liberalisation is going to be highly unequal. Therefore, while Bangladesh stands to suffer from welfare losses in most cases, countries like China, India, and Thailand are set to net welfare gains. This study has also explored the welfare and poverty impacts of different alternative scenarios in relation to global agricultural trade liberalisation in the context
W T O A N D R E G I O N A L T R A D E N E G O T I A T I O N O U T C O M E S : Q U A N T I T A T I V E
A S S E S S M E N T S O F P O T E N T I A L I M P L I C A T I O N S O N B A N G L A D E S H
70 of Bangladesh economy. The paper has applied a sequential dynamic CGE model, which has allowed the examination of both short and long run impacts of different policy scenarios. The model has also taken the price and volume shocks from the GTAP model. It appears that a full global agricultural liberalisation will lead to a high welfare loss and a significant rise in poverty indices. Even a partial liberalisation and the Hong Kong scenario will generate negative impact on the welfare and will result in some increases in poverty. It may thus be argued that the achievements in poverty reduction in Bangladesh during the 1990s could come under threat if significant global liberalisation of agricultural trade takes place.
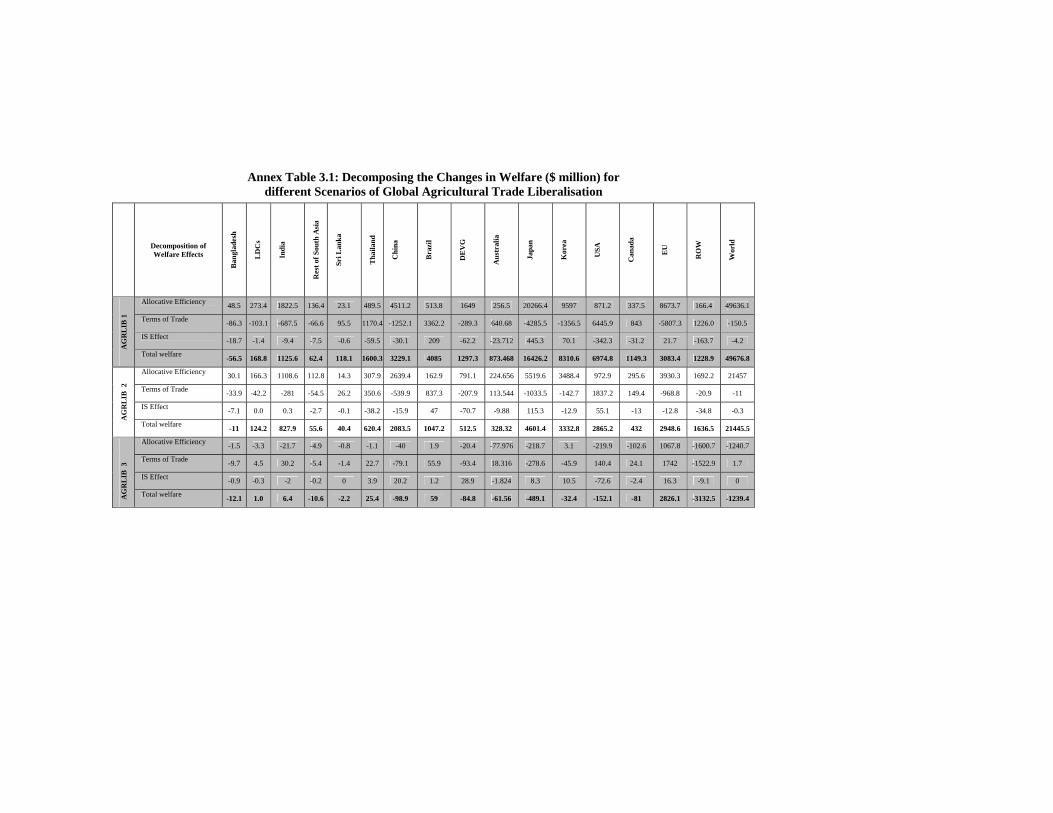
Annex Table 3.1: Decomposing the Changes in Welfare ($ million) for different Scenarios of Global Agricultural Trade Liberalisation
Decomposition of Welfare Effects
Ban
glad
esh
LD
Cs
Indi
a
Res
t of S
outh
Asi
a
Sri L
anka
Tha
iland
Chi
na
Bra
zil
DE
VG
Aus
tral
ia
Japa
n
Kor
ea
USA
Can
ada
EU
RO
W
Wor
ld
Allocative Efficiency 48.5 273.4 1822.5 136.4 23.1 489.5 4511.2 513.8 1649 256.5 20266.4 9597 871.2 337.5 8673.7 166.4 49636.1
Terms of Trade -86.3 -103.1 -687.5 -66.6 95.5 1170.4 -1252.1 3362.2 -289.3 640.68 -4285.5 -1356.5 6445.9 843 -5807.3 1226.0 -150.5
IS Effect -18.7 -1.4 -9.4 -7.5 -0.6 -59.5 -30.1 209 -62.2 -23.712 445.3 70.1 -342.3 -31.2 21.7 -163.7 -4.2
AG
RL
IB 1
Total welfare -56.5 168.8 1125.6 62.4 118.1 1600.3 3229.1 4085 1297.3 873.468 16426.2 8310.6 6974.8 1149.3 3083.4 1228.9 49676.8
Allocative Efficiency 30.1 166.3 1108.6 112.8 14.3 307.9 2639.4 162.9 791.1 224.656 5519.6 3488.4 972.9 295.6 3930.3 1692.2 21457
Terms of Trade -33.9 -42.2 -281 -54.5 26.2 350.6 -539.9 837.3 -207.9 113.544 -1033.5 -142.7 1837.2 149.4 -968.8 -20.9 -11
IS Effect -7.1 0.0 0.3 -2.7 -0.1 -38.2 -15.9 47 -70.7 -9.88 115.3 -12.9 55.1 -13 -12.8 -34.8 -0.3
AG
RL
IB 2
Total welfare -11 124.2 827.9 55.6 40.4 620.4 2083.5 1047.2 512.5 328.32 4601.4 3332.8 2865.2 432 2948.6 1636.5 21445.5
Allocative Efficiency -1.5 -3.3 -21.7 -4.9 -0.8 -1.1 -40 1.9 -20.4 -77.976 -218.7 3.1 -219.9 -102.6 1067.8 -1600.7 -1240.7
Terms of Trade -9.7 4.5 30.2 -5.4 -1.4 22.7 -79.1 55.9 -93.4 18.316 -278.6 -45.9 140.4 24.1 1742 -1522.9 1.7
IS Effect -0.9 -0.3 -2 -0.2 0 3.9 20.2 1.2 28.9 -1.824 8.3 10.5 -72.6 -2.4 16.3 -9.1 0
AG
RL
IB 3
Total welfare -12.1 1.0 6.4 -10.6 -2.2 25.4 -98.9 59 -84.8 -61.56 -489.1 -32.4 -152.1 -81 2826.1 -3132.5 -1239.4
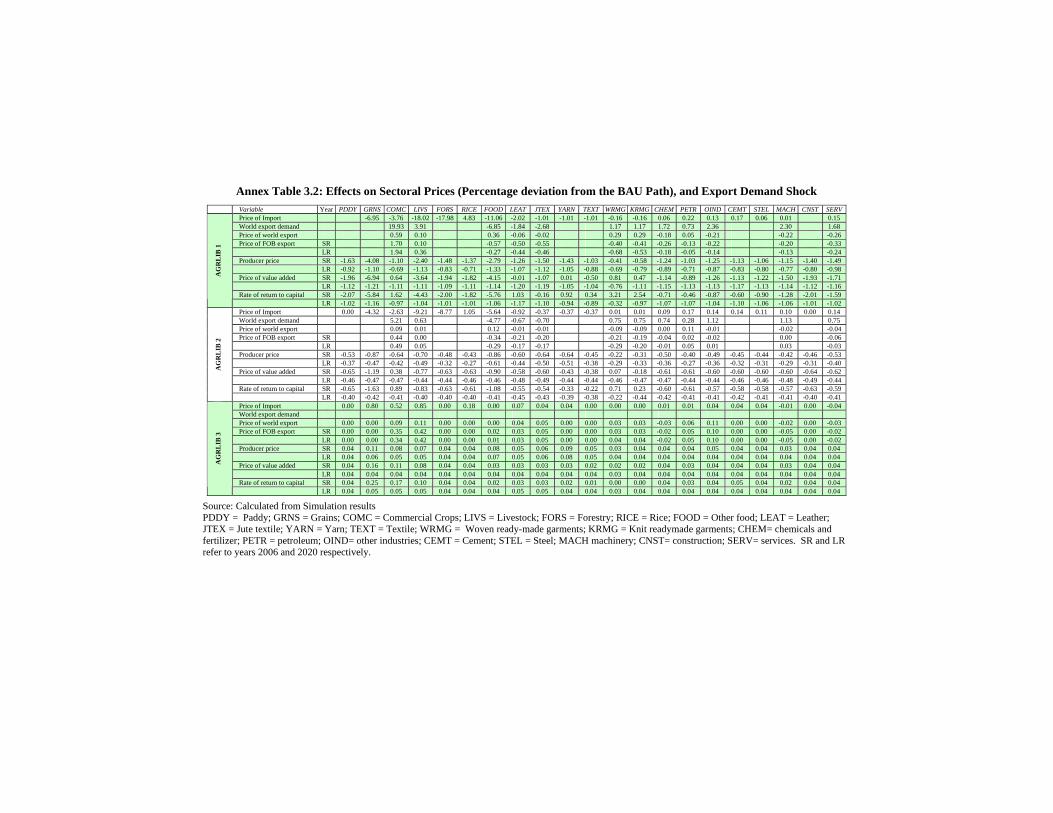
Annex Table 3.2: Effects on Sectoral Prices (Percentage deviation from the BAU Path), and Export Demand Shock
Variable Year PDDY GRNS COMC LIVS FORS RICE FOOD LEAT JTEX YARN TEXT WRMG KRMG CHEM PETR OIND CEMT STEL MACH CNST SERV
Price of Import -6.95 -3.76 -18.02 -17.98 4.83 -11.06 -2.02 -1.01 -1.01 -1.01 -0.16 -0.16 0.06 0.22 0.13 0.17 0.06 0.01 0.15 World export demand 19.93 3.91 -6.85 -1.84 -2.68 1.17 1.17 1.72 0.73 2.36 2.30 1.68 Price of world export 0.59 0.10 0.36 -0.06 -0.02 0.29 0.29 -0.18 0.05 -0.21 -0.22 -0.26 Price of FOB export SR 1.70 0.10 -0.57 -0.50 -0.55 -0.40 -0.41 -0.26 -0.13 -0.22 -0.20 -0.33 LR 1.94 0.36 -0.27 -0.44 -0.46 -0.68 -0.53 -0.18 -0.05 -0.14 -0.13 -0.24 Producer price SR -1.63 -4.08 -1.10 -2.40 -1.48 -1.37 -2.79 -1.26 -1.50 -1.43 -1.03 -0.41 -0.58 -1.24 -1.03 -1.25 -1.13 -1.06 -1.15 -1.40 -1.49 LR -0.92 -1.10 -0.69 -1.13 -0.83 -0.71 -1.33 -1.07 -1.12 -1.05 -0.88 -0.69 -0.79 -0.89 -0.71 -0.87 -0.83 -0.80 -0.77 -0.80 -0.98 Price of value added SR -1.96 -6.94 0.64 -3.64 -1.94 -1.82 -4.15 -0.01 -1.07 0.01 -0.50 0.81 0.47 -1.14 -0.89 -1.26 -1.13 -1.22 -1.50 -1.93 -1.71 LR -1.12 -1.21 -1.11 -1.11 -1.09 -1.11 -1.14 -1.20 -1.19 -1.05 -1.04 -0.76 -1.11 -1.15 -1.13 -1.13 -1.17 -1.13 -1.14 -1.12 -1.16 Rate of return to capital SR -2.07 -5.84 1.62 -4.43 -2.00 -1.82 -5.76 1.03 -0.16 0.92 0.34 3.21 2.54 -0.71 -0.46 -0.87 -0.60 -0.90 -1.28 -2.01 -1.59
AG
RL
IB 1
LR -1.02 -1.16 -0.97 -1.04 -1.01 -1.01 -1.06 -1.17 -1.10 -0.94 -0.89 -0.32 -0.97 -1.07 -1.07 -1.04 -1.10 -1.06 -1.06 -1.01 -1.02 Price of Import 0.00 -4.32 -2.63 -9.21 -8.77 1.05 -5.64 -0.92 -0.37 -0.37 -0.37 0.01 0.01 0.09 0.17 0.14 0.14 0.11 0.10 0.00 0.14 World export demand 5.21 0.63 -4.77 -0.67 -0.70 0.75 0.75 0.74 0.28 1.12 1.13 0.75 Price of world export 0.09 0.01 0.12 -0.01 -0.01 -0.09 -0.09 0.00 0.11 -0.01 -0.02 -0.04 Price of FOB export SR 0.44 0.00 -0.34 -0.21 -0.20 -0.21 -0.19 -0.04 0.02 -0.02 0.00 -0.06 LR 0.49 0.05 -0.29 -0.17 -0.17 -0.29 -0.20 -0.01 0.05 0.01 0.03 -0.03 Producer price SR -0.53 -0.87 -0.64 -0.70 -0.48 -0.43 -0.86 -0.60 -0.64 -0.64 -0.45 -0.22 -0.31 -0.50 -0.40 -0.49 -0.45 -0.44 -0.42 -0.46 -0.53 LR -0.37 -0.47 -0.42 -0.49 -0.32 -0.27 -0.61 -0.44 -0.50 -0.51 -0.38 -0.29 -0.33 -0.36 -0.27 -0.36 -0.32 -0.31 -0.29 -0.31 -0.40 Price of value added SR -0.65 -1.19 0.38 -0.77 -0.63 -0.63 -0.90 -0.58 -0.60 -0.43 -0.38 0.07 -0.18 -0.61 -0.61 -0.60 -0.60 -0.60 -0.60 -0.64 -0.62 LR -0.46 -0.47 -0.47 -0.44 -0.44 -0.46 -0.46 -0.48 -0.49 -0.44 -0.44 -0.46 -0.47 -0.47 -0.44 -0.44 -0.46 -0.46 -0.48 -0.49 -0.44 Rate of return to capital SR -0.65 -1.63 0.89 -0.83 -0.63 -0.61 -1.08 -0.55 -0.54 -0.33 -0.22 0.71 0.23 -0.60 -0.61 -0.57 -0.58 -0.58 -0.57 -0.63 -0.59
AG
RL
IB 2
LR -0.40 -0.42 -0.41 -0.40 -0.40 -0.40 -0.41 -0.45 -0.43 -0.39 -0.38 -0.22 -0.44 -0.42 -0.41 -0.41 -0.42 -0.41 -0.41 -0.40 -0.41 Price of Import 0.00 0.80 0.52 0.85 0.00 0.18 0.00 0.07 0.04 0.04 0.00 0.00 0.00 0.01 0.01 0.04 0.04 0.04 -0.01 0.00 -0.04 World export demand Price of world export 0.00 0.00 0.09 0.11 0.00 0.00 0.00 0.04 0.05 0.00 0.00 0.03 0.03 -0.03 0.06 0.11 0.00 0.00 -0.02 0.00 -0.03 Price of FOB export SR 0.00 0.00 0.35 0.42 0.00 0.00 0.02 0.03 0.05 0.00 0.00 0.03 0.03 -0.02 0.05 0.10 0.00 0.00 -0.05 0.00 -0.02 LR 0.00 0.00 0.34 0.42 0.00 0.00 0.01 0.03 0.05 0.00 0.00 0.04 0.04 -0.02 0.05 0.10 0.00 0.00 -0.05 0.00 -0.02 Producer price SR 0.04 0.11 0.08 0.07 0.04 0.04 0.08 0.05 0.06 0.09 0.05 0.03 0.04 0.04 0.04 0.05 0.04 0.04 0.03 0.04 0.04 LR 0.04 0.06 0.05 0.05 0.04 0.04 0.07 0.05 0.06 0.08 0.05 0.04 0.04 0.04 0.04 0.04 0.04 0.04 0.04 0.04 0.04 Price of value added SR 0.04 0.16 0.11 0.08 0.04 0.04 0.03 0.03 0.03 0.03 0.02 0.02 0.02 0.04 0.03 0.04 0.04 0.04 0.03 0.04 0.04 LR 0.04 0.04 0.04 0.04 0.04 0.04 0.04 0.04 0.04 0.04 0.04 0.03 0.04 0.04 0.04 0.04 0.04 0.04 0.04 0.04 0.04 Rate of return to capital SR 0.04 0.25 0.17 0.10 0.04 0.04 0.02 0.03 0.03 0.02 0.01 0.00 0.00 0.04 0.03 0.04 0.05 0.04 0.02 0.04 0.04
AG
RL
IB 3
LR 0.04 0.05 0.05 0.05 0.04 0.04 0.04 0.05 0.05 0.04 0.04 0.03 0.04 0.04 0.04 0.04 0.04 0.04 0.04 0.04 0.04
Source: Calculated from Simulation results PDDY = Paddy; GRNS = Grains; COMC = Commercial Crops; LIVS = Livestock; FORS = Forestry; RICE = Rice; FOOD = Other food; LEAT = Leather; JTEX = Jute textile; YARN = Yarn; TEXT = Textile; WRMG = Woven ready-made garments; KRMG = Knit readymade garments; CHEM= chemicals and fertilizer; PETR = petroleum; OIND= other industries; CEMT = Cement; STEL = Steel; MACH machinery; CNST= construction; SERV= services. SR and LR refer to years 2006 and 2020 respectively.
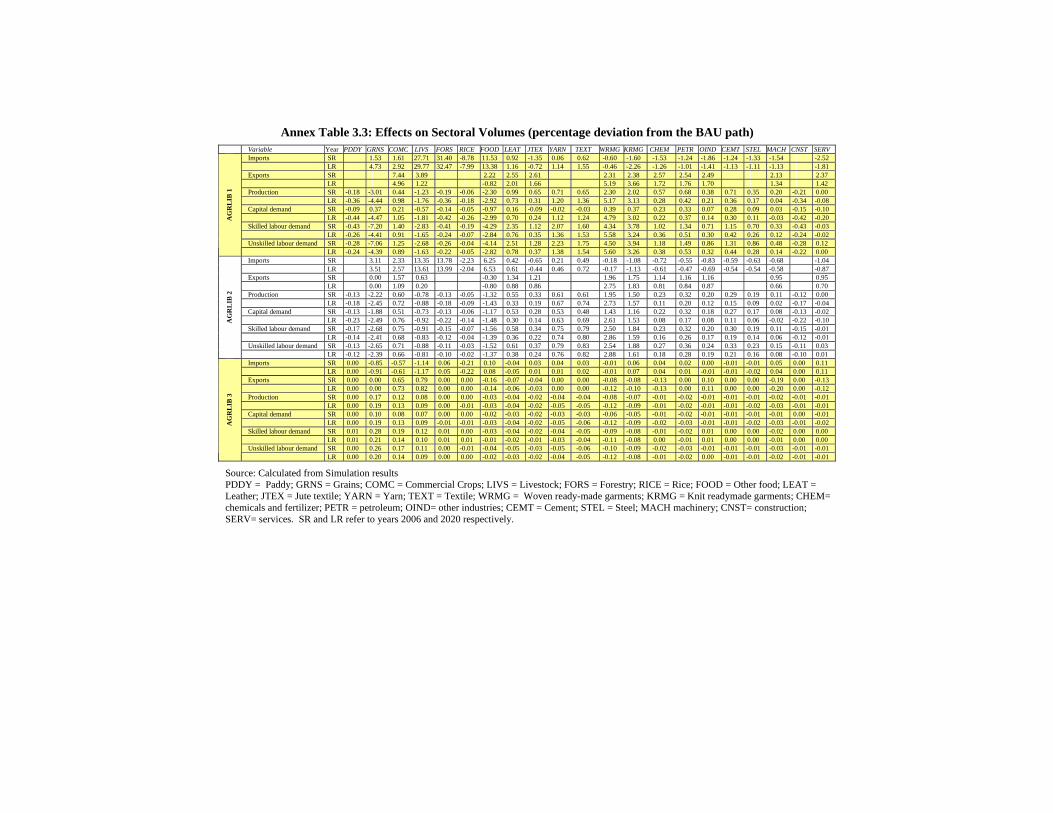
Annex Table 3.3: Effects on Sectoral Volumes (percentage deviation from the BAU path)
Variable Year PDDY GRNS COMC LIVS FORS RICE FOOD LEAT JTEX YARN TEXT WRMG KRMG CHEM PETR OIND CEMT STEL MACH CNST SERV Imports SR 1.53 1.61 27.71 31.40 -8.78 11.53 0.92 -1.35 0.06 0.62 -0.60 -1.60 -1.53 -1.24 -1.86 -1.24 -1.33 -1.54 -2.52 LR 4.73 2.92 29.77 32.47 -7.99 13.38 1.16 -0.72 1.14 1.55 -0.46 -2.26 -1.26 -1.01 -1.41 -1.13 -1.11 -1.13 -1.81 Exports SR 7.44 3.89 2.22 2.55 2.61 2.31 2.38 2.57 2.54 2.49 2.13 2.37 LR 4.96 1.22 -0.82 2.01 1.66 5.19 3.66 1.72 1.76 1.70 1.34 1.42 Production SR -0.18 -3.01 0.44 -1.23 -0.19 -0.06 -2.30 0.99 0.65 0.71 0.65 2.30 2.02 0.57 0.68 0.38 0.71 0.35 0.20 -0.21 0.00 LR -0.36 -4.44 0.98 -1.76 -0.36 -0.18 -2.92 0.73 0.31 1.20 1.36 5.17 3.13 0.28 0.42 0.21 0.36 0.17 0.04 -0.34 -0.08 Capital demand SR -0.09 0.37 0.21 -0.57 -0.14 -0.05 -0.97 0.16 -0.09 -0.02 -0.03 0.39 0.37 0.23 0.33 0.07 0.28 0.09 0.03 -0.15 -0.10 LR -0.44 -4.47 1.05 -1.81 -0.42 -0.26 -2.99 0.70 0.24 1.12 1.24 4.79 3.02 0.22 0.37 0.14 0.30 0.11 -0.03 -0.42 -0.20 Skilled labour demand SR -0.43 -7.20 1.40 -2.83 -0.41 -0.19 -4.29 2.35 1.12 2.07 1.60 4.34 3.78 1.02 1.34 0.71 1.15 0.70 0.33 -0.43 -0.03 LR -0.26 -4.41 0.91 -1.65 -0.24 -0.07 -2.84 0.76 0.35 1.36 1.53 5.58 3.24 0.36 0.51 0.30 0.42 0.26 0.12 -0.24 -0.02 Unskilled labour demand SR -0.28 -7.06 1.25 -2.68 -0.26 -0.04 -4.14 2.51 1.28 2.23 1.75 4.50 3.94 1.18 1.49 0.86 1.31 0.86 0.48 -0.28 0.12
AG
RL
IB 1
LR -0.24 -4.39 0.89 -1.63 -0.22 -0.05 -2.82 0.78 0.37 1.38 1.54 5.60 3.26 0.38 0.53 0.32 0.44 0.28 0.14 -0.22 0.00 Imports SR 3.11 2.33 13.35 13.78 -2.23 6.25 0.42 -0.65 0.21 0.49 -0.18 -1.08 -0.72 -0.55 -0.83 -0.59 -0.63 -0.68 -1.04 LR 3.51 2.57 13.61 13.99 -2.04 6.53 0.61 -0.44 0.46 0.72 -0.17 -1.13 -0.61 -0.47 -0.69 -0.54 -0.54 -0.58 -0.87 Exports SR 0.00 1.57 0.63 -0.30 1.34 1.21 1.96 1.75 1.14 1.16 1.16 0.95 0.95 LR 0.00 1.09 0.20 -0.80 0.88 0.86 2.75 1.83 0.81 0.84 0.87 0.66 0.70 Production SR -0.13 -2.22 0.60 -0.78 -0.13 -0.05 -1.32 0.55 0.33 0.61 0.61 1.95 1.50 0.23 0.32 0.20 0.29 0.19 0.11 -0.12 0.00 LR -0.18 -2.45 0.72 -0.88 -0.18 -0.09 -1.43 0.33 0.19 0.67 0.74 2.73 1.57 0.11 0.20 0.12 0.15 0.09 0.02 -0.17 -0.04 Capital demand SR -0.13 -1.88 0.51 -0.73 -0.13 -0.06 -1.17 0.53 0.28 0.53 0.48 1.43 1.16 0.22 0.32 0.18 0.27 0.17 0.08 -0.13 -0.02 LR -0.23 -2.49 0.76 -0.92 -0.22 -0.14 -1.48 0.30 0.14 0.63 0.69 2.61 1.53 0.08 0.17 0.08 0.11 0.06 -0.02 -0.22 -0.10 Skilled labour demand SR -0.17 -2.68 0.75 -0.91 -0.15 -0.07 -1.56 0.58 0.34 0.75 0.79 2.50 1.84 0.23 0.32 0.20 0.30 0.19 0.11 -0.15 -0.01 LR -0.14 -2.41 0.68 -0.83 -0.12 -0.04 -1.39 0.36 0.22 0.74 0.80 2.86 1.59 0.16 0.26 0.17 0.19 0.14 0.06 -0.12 -0.01 Unskilled labour demand SR -0.13 -2.65 0.71 -0.88 -0.11 -0.03 -1.52 0.61 0.37 0.79 0.83 2.54 1.88 0.27 0.36 0.24 0.33 0.23 0.15 -0.11 0.03
AG
RL
IB 2
LR -0.12 -2.39 0.66 -0.81 -0.10 -0.02 -1.37 0.38 0.24 0.76 0.82 2.88 1.61 0.18 0.28 0.19 0.21 0.16 0.08 -0.10 0.01 Imports SR 0.00 -0.85 -0.57 -1.14 0.06 -0.21 0.10 -0.04 0.03 0.04 0.03 -0.01 0.06 0.04 0.02 0.00 -0.01 -0.01 0.05 0.00 0.11 LR 0.00 -0.91 -0.61 -1.17 0.05 -0.22 0.08 -0.05 0.01 0.01 0.02 -0.01 0.07 0.04 0.01 -0.01 -0.01 -0.02 0.04 0.00 0.11 Exports SR 0.00 0.00 0.65 0.79 0.00 0.00 -0.16 -0.07 -0.04 0.00 0.00 -0.08 -0.08 -0.13 0.00 0.10 0.00 0.00 -0.19 0.00 -0.13 LR 0.00 0.00 0.73 0.82 0.00 0.00 -0.14 -0.06 -0.03 0.00 0.00 -0.12 -0.10 -0.13 0.00 0.11 0.00 0.00 -0.20 0.00 -0.12 Production SR 0.00 0.17 0.12 0.08 0.00 0.00 -0.03 -0.04 -0.02 -0.04 -0.04 -0.08 -0.07 -0.01 -0.02 -0.01 -0.01 -0.01 -0.02 -0.01 -0.01 LR 0.00 0.19 0.13 0.09 0.00 -0.01 -0.03 -0.04 -0.02 -0.05 -0.05 -0.12 -0.09 -0.01 -0.02 -0.01 -0.01 -0.02 -0.03 -0.01 -0.01 Capital demand SR 0.00 0.10 0.08 0.07 0.00 0.00 -0.02 -0.03 -0.02 -0.03 -0.03 -0.06 -0.05 -0.01 -0.02 -0.01 -0.01 -0.01 -0.01 0.00 -0.01 LR 0.00 0.19 0.13 0.09 -0.01 -0.01 -0.03 -0.04 -0.02 -0.05 -0.06 -0.12 -0.09 -0.02 -0.03 -0.01 -0.01 -0.02 -0.03 -0.01 -0.02 Skilled labour demand SR 0.01 0.28 0.19 0.12 0.01 0.00 -0.03 -0.04 -0.02 -0.04 -0.05 -0.09 -0.08 -0.01 -0.02 0.01 0.00 0.00 -0.02 0.00 0.00 LR 0.01 0.21 0.14 0.10 0.01 0.01 -0.01 -0.02 -0.01 -0.03 -0.04 -0.11 -0.08 0.00 -0.01 0.01 0.00 0.00 -0.01 0.00 0.00 Unskilled labour demand SR 0.00 0.26 0.17 0.11 0.00 -0.01 -0.04 -0.05 -0.03 -0.05 -0.06 -0.10 -0.09 -0.02 -0.03 -0.01 -0.01 -0.01 -0.03 -0.01 -0.01
AG
RL
IB 3
LR 0.00 0.20 0.14 0.09 0.00 0.00 -0.02 -0.03 -0.02 -0.04 -0.05 -0.12 -0.08 -0.01 -0.02 0.00 -0.01 -0.01 -0.02 -0.01 -0.01
Source: Calculated from Simulation results PDDY = Paddy; GRNS = Grains; COMC = Commercial Crops; LIVS = Livestock; FORS = Forestry; RICE = Rice; FOOD = Other food; LEAT = Leather; JTEX = Jute textile; YARN = Yarn; TEXT = Textile; WRMG = Woven ready-made garments; KRMG = Knit readymade garments; CHEM= chemicals and fertilizer; PETR = petroleum; OIND= other industries; CEMT = Cement; STEL = Steel; MACH machinery; CNST= construction; SERV= services. SR and LR refer to years 2006 and 2020 respectively.
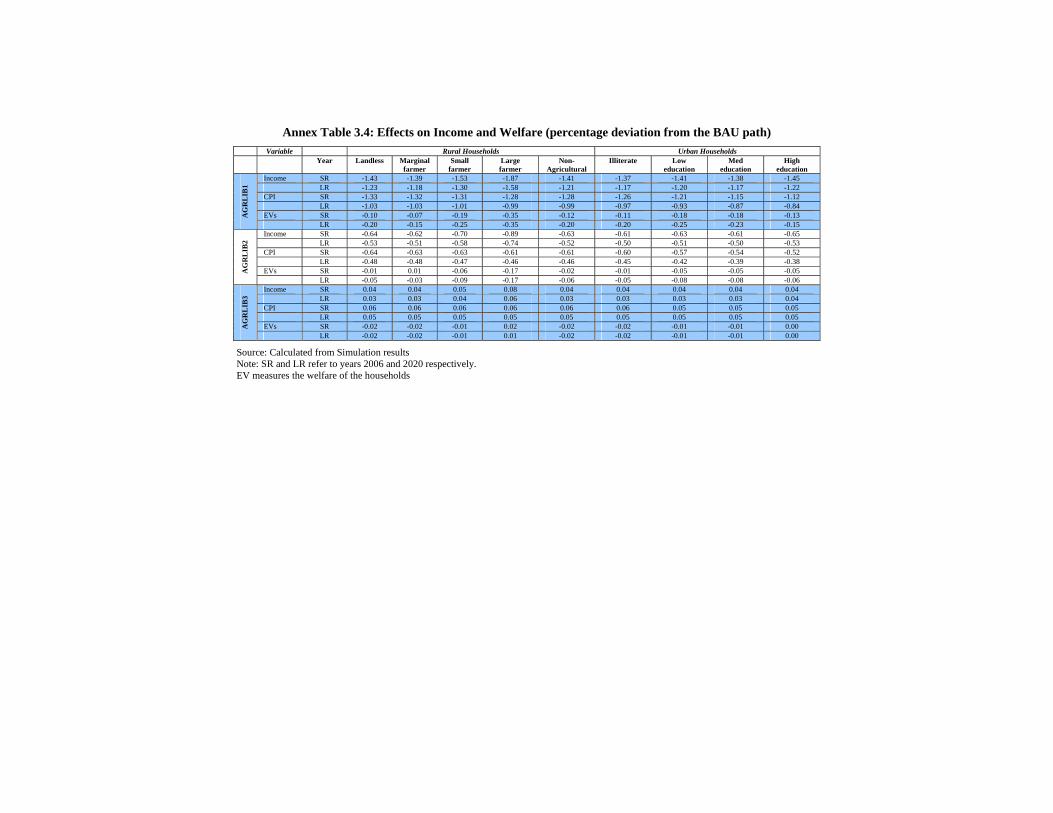
Annex Table 3.4: Effects on Income and Welfare (percentage deviation from the BAU path)
Variable Rural Households Urban Households Year Landless Marginal
farmer Small
farmer Large farmer
Non- Agricultural
Illiterate Low education
Med education
High education
Income SR -1.43 -1.39 -1.53 -1.87 -1.41 -1.37 -1.41 -1.38 -1.45 LR -1.23 -1.18 -1.30 -1.58 -1.21 -1.17 -1.20 -1.17 -1.22 CPI SR -1.33 -1.32 -1.31 -1.28 -1.28 -1.26 -1.21 -1.15 -1.12 LR -1.03 -1.03 -1.01 -0.99 -0.99 -0.97 -0.93 -0.87 -0.84 EVs SR -0.10 -0.07 -0.19 -0.35 -0.12 -0.11 -0.18 -0.18 -0.13 A
GR
LIB
1
LR -0.20 -0.15 -0.25 -0.35 -0.20 -0.20 -0.25 -0.23 -0.15 Income SR -0.64 -0.62 -0.70 -0.89 -0.63 -0.61 -0.63 -0.61 -0.65 LR -0.53 -0.51 -0.58 -0.74 -0.52 -0.50 -0.51 -0.50 -0.53 CPI SR -0.64 -0.63 -0.63 -0.61 -0.61 -0.60 -0.57 -0.54 -0.52 LR -0.48 -0.48 -0.47 -0.46 -0.46 -0.45 -0.42 -0.39 -0.38 EVs SR -0.01 0.01 -0.06 -0.17 -0.02 -0.01 -0.05 -0.05 -0.05 A
GR
LIB
2
LR -0.05 -0.03 -0.09 -0.17 -0.06 -0.05 -0.08 -0.08 -0.06 Income SR 0.04 0.04 0.05 0.08 0.04 0.04 0.04 0.04 0.04 LR 0.03 0.03 0.04 0.06 0.03 0.03 0.03 0.03 0.04 CPI SR 0.06 0.06 0.06 0.06 0.06 0.06 0.05 0.05 0.05 LR 0.05 0.05 0.05 0.05 0.05 0.05 0.05 0.05 0.05 EVs SR -0.02 -0.02 -0.01 0.02 -0.02 -0.02 -0.01 -0.01 0.00 A
GR
LIB
3
LR -0.02 -0.02 -0.01 0.01 -0.02 -0.02 -0.01 -0.01 0.00
Source: Calculated from Simulation results Note: SR and LR refer to years 2006 and 2020 respectively. EV measures the welfare of the households
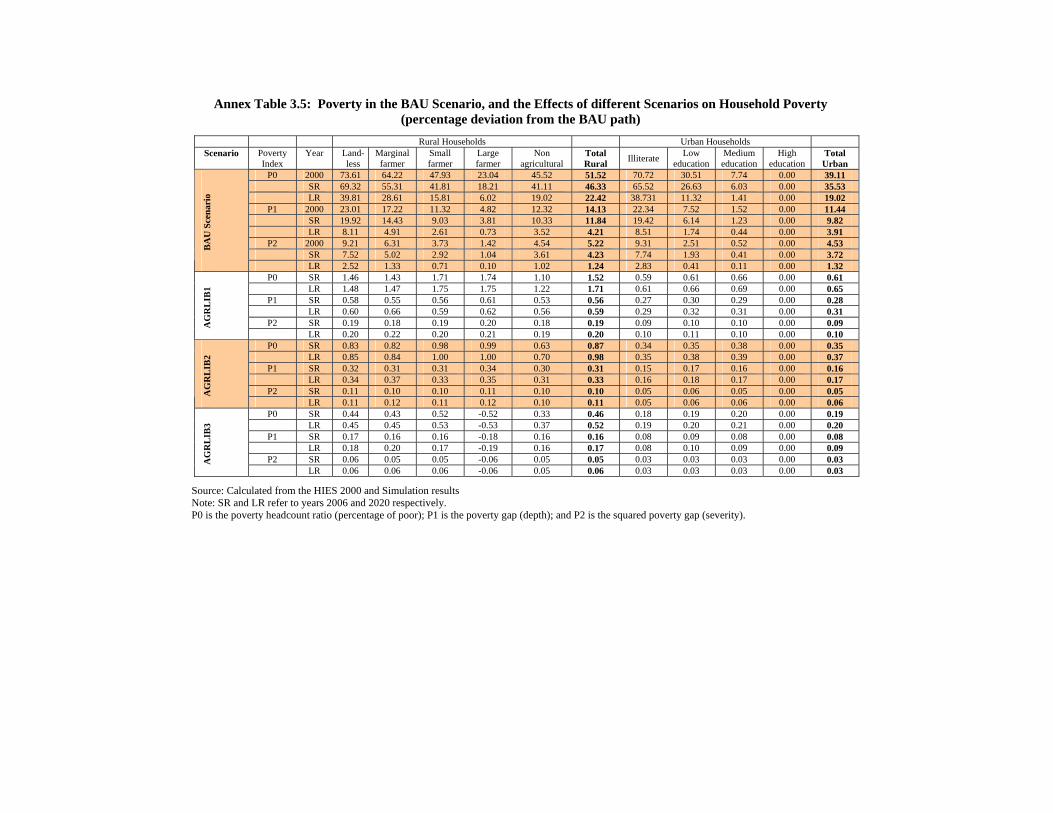
Annex Table 3.5: Poverty in the BAU Scenario, and the Effects of different Scenarios on Household Poverty (percentage deviation from the BAU path)
Rural Households Urban Households
Scenario Poverty Index
Year Land-less
Marginal farmer
Small farmer
Large farmer
Non agricultural
Total Rural Illiterate Low
education Medium education
High education
Total Urban
P0 2000 73.61 64.22 47.93 23.04 45.52 51.52 70.72 30.51 7.74 0.00 39.11 SR 69.32 55.31 41.81 18.21 41.11 46.33 65.52 26.63 6.03 0.00 35.53 LR 39.81 28.61 15.81 6.02 19.02 22.42 38.731 11.32 1.41 0.00 19.02
P1 2000 23.01 17.22 11.32 4.82 12.32 14.13 22.34 7.52 1.52 0.00 11.44 SR 19.92 14.43 9.03 3.81 10.33 11.84 19.42 6.14 1.23 0.00 9.82 LR 8.11 4.91 2.61 0.73 3.52 4.21 8.51 1.74 0.44 0.00 3.91
P2 2000 9.21 6.31 3.73 1.42 4.54 5.22 9.31 2.51 0.52 0.00 4.53 SR 7.52 5.02 2.92 1.04 3.61 4.23 7.74 1.93 0.41 0.00 3.72
BA
U S
cena
rio
LR 2.52 1.33 0.71 0.10 1.02 1.24 2.83 0.41 0.11 0.00 1.32 P0 SR 1.46 1.43 1.71 1.74 1.10 1.52 0.59 0.61 0.66 0.00 0.61
LR 1.48 1.47 1.75 1.75 1.22 1.71 0.61 0.66 0.69 0.00 0.65 P1 SR 0.58 0.55 0.56 0.61 0.53 0.56 0.27 0.30 0.29 0.00 0.28
LR 0.60 0.66 0.59 0.62 0.56 0.59 0.29 0.32 0.31 0.00 0.31 P2 SR 0.19 0.18 0.19 0.20 0.18 0.19 0.09 0.10 0.10 0.00 0.09 A
GR
LIB
1
LR 0.20 0.22 0.20 0.21 0.19 0.20 0.10 0.11 0.10 0.00 0.10 P0 SR 0.83 0.82 0.98 0.99 0.63 0.87 0.34 0.35 0.38 0.00 0.35
LR 0.85 0.84 1.00 1.00 0.70 0.98 0.35 0.38 0.39 0.00 0.37 P1 SR 0.32 0.31 0.31 0.34 0.30 0.31 0.15 0.17 0.16 0.00 0.16
LR 0.34 0.37 0.33 0.35 0.31 0.33 0.16 0.18 0.17 0.00 0.17 P2 SR 0.11 0.10 0.10 0.11 0.10 0.10 0.05 0.06 0.05 0.00 0.05 A
GR
LIB
2
LR 0.11 0.12 0.11 0.12 0.10 0.11 0.05 0.06 0.06 0.00 0.06 P0 SR 0.44 0.43 0.52 -0.52 0.33 0.46 0.18 0.19 0.20 0.00 0.19
LR 0.45 0.45 0.53 -0.53 0.37 0.52 0.19 0.20 0.21 0.00 0.20 P1 SR 0.17 0.16 0.16 -0.18 0.16 0.16 0.08 0.09 0.08 0.00 0.08
LR 0.18 0.20 0.17 -0.19 0.16 0.17 0.08 0.10 0.09 0.00 0.09 P2 SR 0.06 0.05 0.05 -0.06 0.05 0.05 0.03 0.03 0.03 0.00 0.03 A
GR
LIB
3
LR 0.06 0.06 0.06 -0.06 0.05 0.06 0.03 0.03 0.03 0.00 0.03
Source: Calculated from the HIES 2000 and Simulation results Note: SR and LR refer to years 2006 and 2020 respectively. P0 is the poverty headcount ratio (percentage of poor); P1 is the poverty gap (depth); and P2 is the squared poverty gap (severity).
CHAPTER FOUR
Selim Raihan and Abdur Razzaque LDCs’ Duty-free and Quota-free (DFQF) Access to Developed Countries’ Markets: Perspectives from Bangladesh
4.1. Introduction In order to enhance the participation of the developing countries and the LDCs in international trade developed countries offered ‘Generalized System of Preference (GSP)’ (established in 1968 under the auspices of UNCTAD): European Union and Japan in 1971, Canada in 1974 and USA in 1976. The GSP facilities for the developing countries are included formally in the WTO documents with three basic characteristics: generality, non-reciprocity and non-discrimination among the beneficiaries, and therefore, are exceptions to the Most Favoured Nation (MFN) provision of the WTO. The number of GSP donor countries and the types of provisions have increased considerably over time, and there are currently 13 national GSP schemes (UNCTAD, 2006). The countries that grant GSP preferences include: Australia, Belarus, Bulgaria, Canada, Estonia, the European Union, Japan, New
L D C s ’ D U T Y - F R E E A N D Q U O T A - F R E E ( D F Q F ) A C C E S S T O D E V E L O P E D
C O U N T R I E S ’ M A R K E T S : P E R S P E C T I V E S F R O M B A N G L A D E S H
77Zealand, Norway, the Russian Federation, Switzerland, Turkey and the USA. In the US market, the LDCs have DFQF access of their products to 82.7 percent of the tariff lines (BGMEA, 2006). However, this apparently high proportion covers only half of the total LDCs exports to the USA. Similar situation prevails in the markets in Canada and Japan. Though EU granted an almost full DFQF market access for LDCs products under Everything But Arms (EBA) provision, but it has stringent Rules of Origin (RoO) restrictions being the limiting factor.
LDCs, for their deficiencies in trade related infrastructure and production and cost effectiveness, are in a disadvantageous position in the international trade integration process. To be competitive, they are in need of special and differential provisions in terms of quota facilities and/or preferential (lower) tariff rates that ensure market access in the developed and the developing countries for the products of their export interest. At the same time, they require these facilities to be non-reciprocal to protect their industries, secure the government revenue from import duties and to exercise control over the economy during the crisis periods.
Findings from several studies suggest that the enhanced market access for the LDCs in the developed countries, in terms of duty free and quota free market access provisions, will benefit LDCs substantially leading to both improved terms of trade and allocative efficiency (UNCTAD, 2001).
Against the backdrop of the aforementioned discussion the purpose of this chapter is to explore the impact of different DFQF scenarios on the economy of Bangladesh. This chapter uses the global general equilibrium model, namely the GTAP model, to simulate different DFQF scenarios. The welfare and poverty impacts of the DFQF scenarios in the context of the Bangladesh economy are examined using the Bangladesh dynamic CGE model. The structure of this chapter is as follows: Section 4.2 demonstrates some stylized facts about the LDCs; Section 4.3 discusses the current status of the negotiations on DFQF market access and the concerns; Section 4.4 analyses Bangladesh’s strategies and concerns in the negotiations on DFQF market access; Section 4.5 presents the welfare estimates from the GTAP models for different DFQF scenarios; Section 4.6 explores the impacts of different DFQF scenarios on the Bangladesh economy using a dynamic CGE model; and finally Section 4.7 concludes.
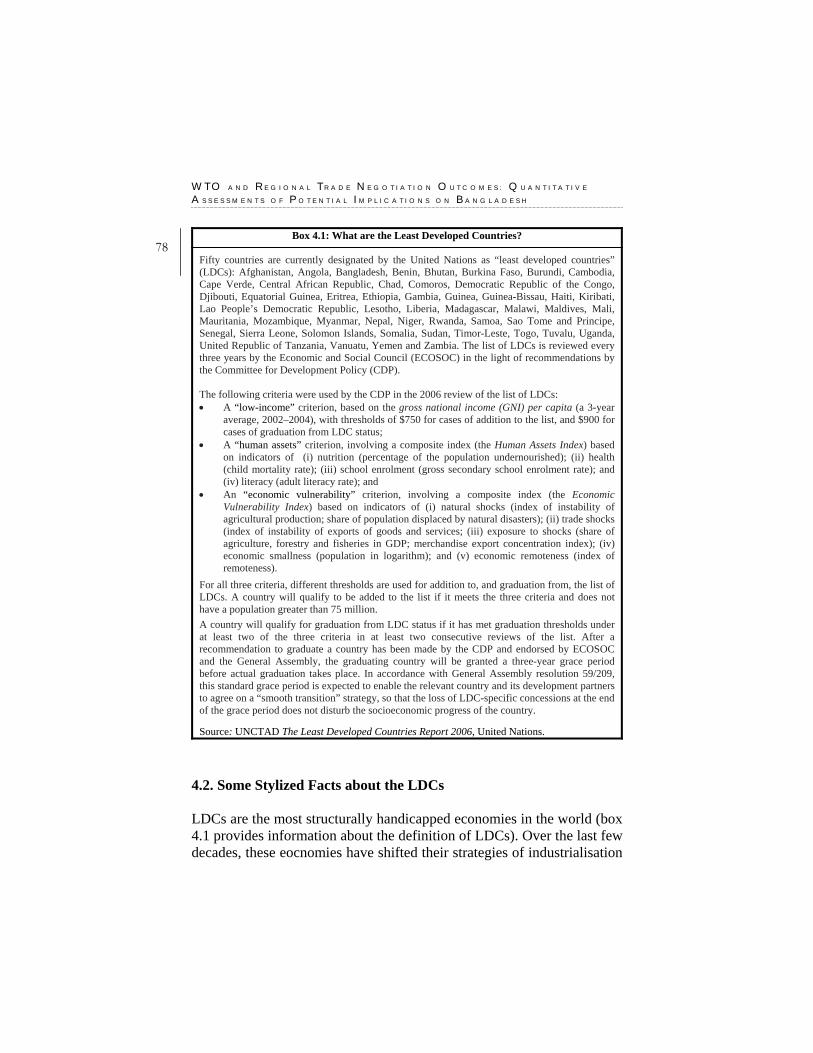
W T O A N D R E G I O N A L T R A D E N E G O T I A T I O N O U T C O M E S : Q U A N T I T A T I V E
A S S E S S M E N T S O F P O T E N T I A L I M P L I C A T I O N S O N B A N G L A D E S H
78 Box 4.1: What are the Least Developed Countries?
Fifty countries are currently designated by the United Nations as “least developed countries” (LDCs): Afghanistan, Angola, Bangladesh, Benin, Bhutan, Burkina Faso, Burundi, Cambodia, Cape Verde, Central African Republic, Chad, Comoros, Democratic Republic of the Congo, Djibouti, Equatorial Guinea, Eritrea, Ethiopia, Gambia, Guinea, Guinea-Bissau, Haiti, Kiribati, Lao People’s Democratic Republic, Lesotho, Liberia, Madagascar, Malawi, Maldives, Mali, Mauritania, Mozambique, Myanmar, Nepal, Niger, Rwanda, Samoa, Sao Tome and Principe, Senegal, Sierra Leone, Solomon Islands, Somalia, Sudan, Timor-Leste, Togo, Tuvalu, Uganda, United Republic of Tanzania, Vanuatu, Yemen and Zambia. The list of LDCs is reviewed every three years by the Economic and Social Council (ECOSOC) in the light of recommendations by the Committee for Development Policy (CDP). The following criteria were used by the CDP in the 2006 review of the list of LDCs: • A “low-income” criterion, based on the gross national income (GNI) per capita (a 3-year
average, 2002–2004), with thresholds of $750 for cases of addition to the list, and $900 for cases of graduation from LDC status;
• A “human assets” criterion, involving a composite index (the Human Assets Index) based on indicators of (i) nutrition (percentage of the population undernourished); (ii) health (child mortality rate); (iii) school enrolment (gross secondary school enrolment rate); and (iv) literacy (adult literacy rate); and
• An “economic vulnerability” criterion, involving a composite index (the Economic Vulnerability Index) based on indicators of (i) natural shocks (index of instability of agricultural production; share of population displaced by natural disasters); (ii) trade shocks (index of instability of exports of goods and services; (iii) exposure to shocks (share of agriculture, forestry and fisheries in GDP; merchandise export concentration index); (iv) economic smallness (population in logarithm); and (v) economic remoteness (index of remoteness).
For all three criteria, different thresholds are used for addition to, and graduation from, the list of LDCs. A country will qualify to be added to the list if it meets the three criteria and does not have a population greater than 75 million.
A country will qualify for graduation from LDC status if it has met graduation thresholds under at least two of the three criteria in at least two consecutive reviews of the list. After a recommendation to graduate a country has been made by the CDP and endorsed by ECOSOC and the General Assembly, the graduating country will be granted a three-year grace period before actual graduation takes place. In accordance with General Assembly resolution 59/209, this standard grace period is expected to enable the relevant country and its development partners to agree on a “smooth transition” strategy, so that the loss of LDC-specific concessions at the end of the grace period does not disturb the socioeconomic progress of the country. Source: UNCTAD The Least Developed Countries Report 2006, United Nations.
4.2. Some Stylized Facts about the LDCs LDCs are the most structurally handicapped economies in the world (box 4.1 provides information about the definition of LDCs). Over the last few decades, these eocnomies have shifted their strategies of industrialisation
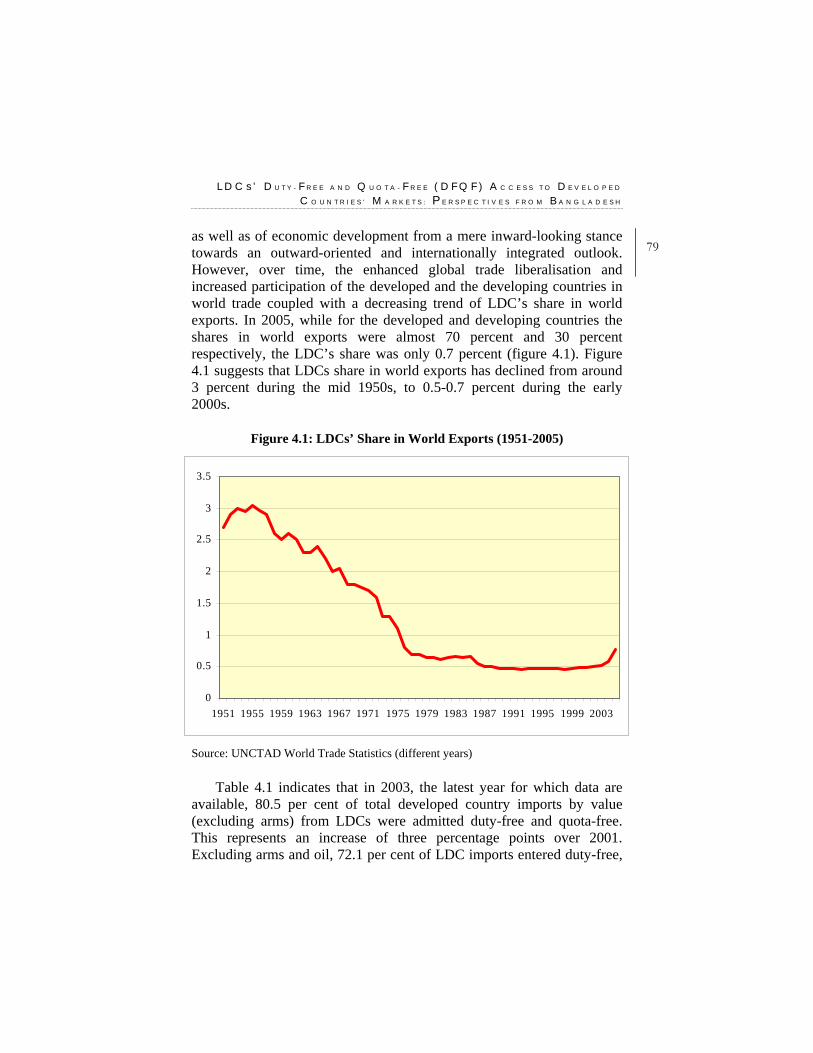
L D C s ’ D U T Y - F R E E A N D Q U O T A - F R E E ( D F Q F ) A C C E S S T O D E V E L O P E D
C O U N T R I E S ’ M A R K E T S : P E R S P E C T I V E S F R O M B A N G L A D E S H
79as well as of economic development from a mere inward-looking stance towards an outward-oriented and internationally integrated outlook. However, over time, the enhanced global trade liberalisation and increased participation of the developed and the developing countries in world trade coupled with a decreasing trend of LDC’s share in world exports. In 2005, while for the developed and developing countries the shares in world exports were almost 70 percent and 30 percent respectively, the LDC’s share was only 0.7 percent (figure 4.1). Figure 4.1 suggests that LDCs share in world exports has declined from around 3 percent during the mid 1950s, to 0.5-0.7 percent during the early 2000s.
Figure 4.1: LDCs’ Share in World Exports (1951-2005)
0
0.5
1
1.5
2
2.5
3
3.5
1951 1955 1959 1963 1967 1971 1975 1979 1983 1987 1991 1995 1999 2003
Source: UNCTAD World Trade Statistics (different years)
Table 4.1 indicates that in 2003, the latest year for which data are available, 80.5 per cent of total developed country imports by value (excluding arms) from LDCs were admitted duty-free and quota-free. This represents an increase of three percentage points over 2001. Excluding arms and oil, 72.1 per cent of LDC imports entered duty-free,
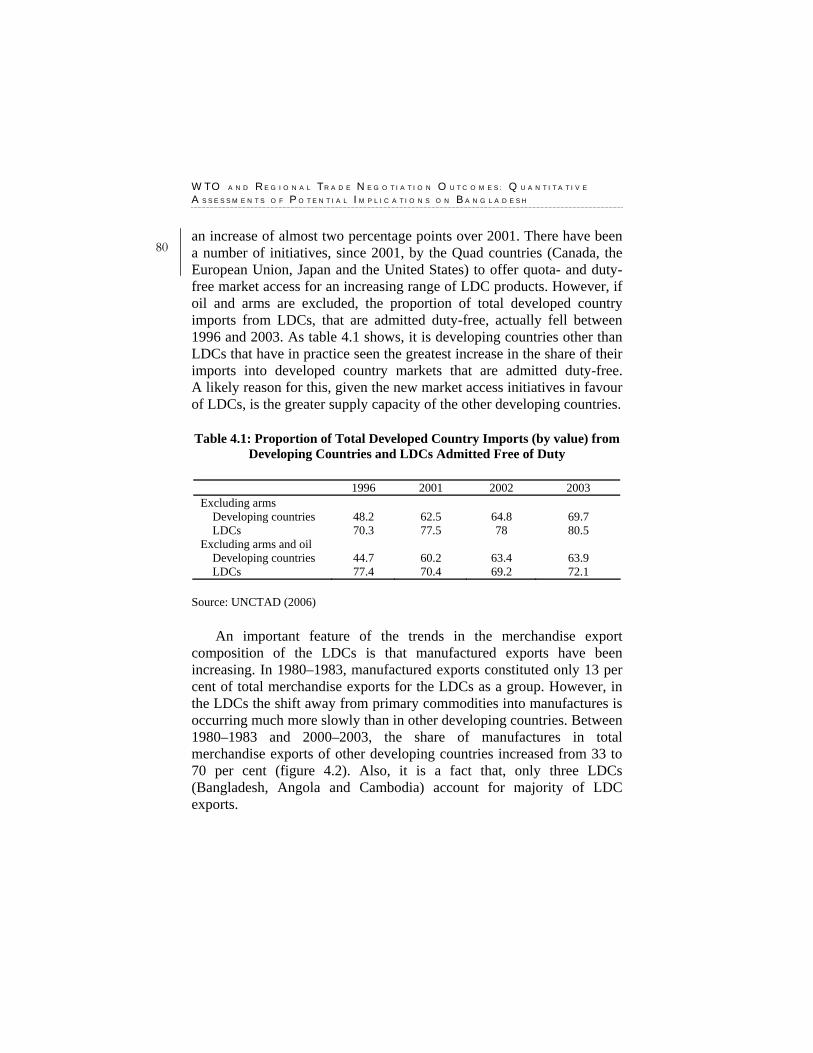
W T O A N D R E G I O N A L T R A D E N E G O T I A T I O N O U T C O M E S : Q U A N T I T A T I V E
A S S E S S M E N T S O F P O T E N T I A L I M P L I C A T I O N S O N B A N G L A D E S H
80 an increase of almost two percentage points over 2001. There have been a number of initiatives, since 2001, by the Quad countries (Canada, the European Union, Japan and the United States) to offer quota- and duty-free market access for an increasing range of LDC products. However, if oil and arms are excluded, the proportion of total developed country imports from LDCs, that are admitted duty-free, actually fell between 1996 and 2003. As table 4.1 shows, it is developing countries other than LDCs that have in practice seen the greatest increase in the share of their imports into developed country markets that are admitted duty-free. A likely reason for this, given the new market access initiatives in favour of LDCs, is the greater supply capacity of the other developing countries. Table 4.1: Proportion of Total Developed Country Imports (by value) from
Developing Countries and LDCs Admitted Free of Duty
1996 2001 2002 2003 Excluding arms Developing countries 48.2 62.5 64.8 69.7 LDCs 70.3 77.5 78 80.5 Excluding arms and oil Developing countries 44.7 60.2 63.4 63.9 LDCs 77.4 70.4 69.2 72.1
Source: UNCTAD (2006)
An important feature of the trends in the merchandise export composition of the LDCs is that manufactured exports have been increasing. In 1980–1983, manufactured exports constituted only 13 per cent of total merchandise exports for the LDCs as a group. However, in the LDCs the shift away from primary commodities into manufactures is occurring much more slowly than in other developing countries. Between 1980–1983 and 2000–2003, the share of manufactures in total merchandise exports of other developing countries increased from 33 to 70 per cent (figure 4.2). Also, it is a fact that, only three LDCs (Bangladesh, Angola and Cambodia) account for majority of LDC exports.
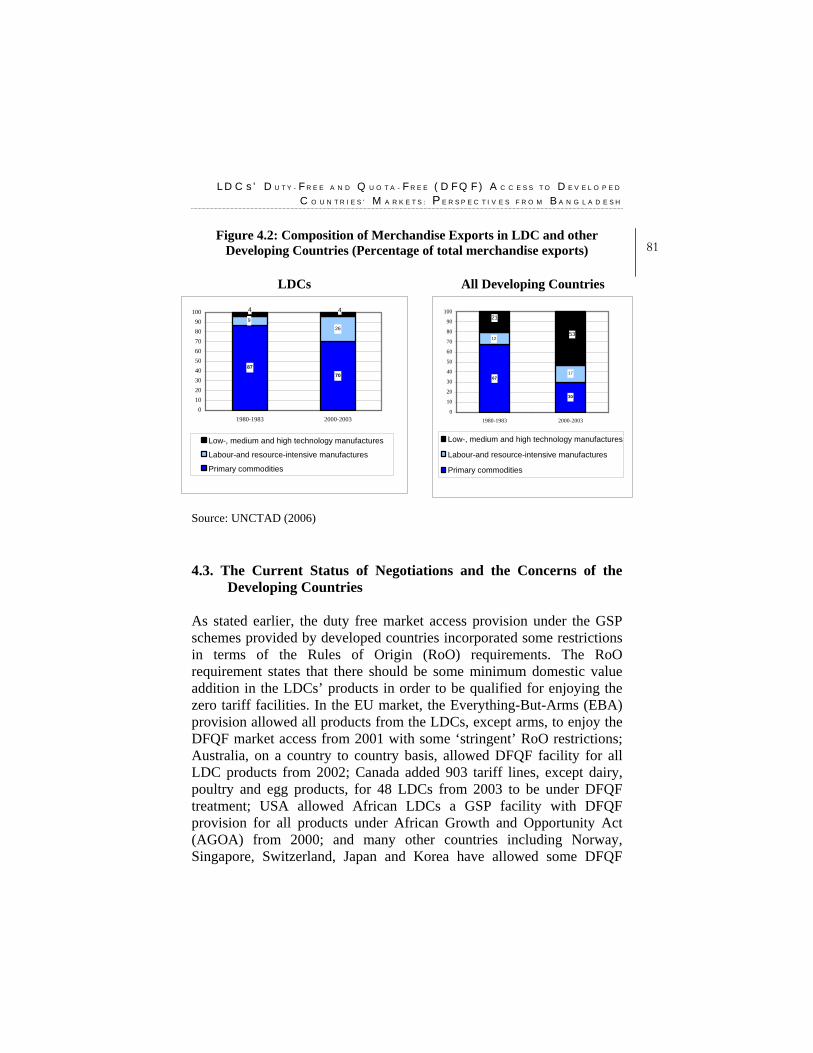
L D C s ’ D U T Y - F R E E A N D Q U O T A - F R E E ( D F Q F ) A C C E S S T O D E V E L O P E D
C O U N T R I E S ’ M A R K E T S : P E R S P E C T I V E S F R O M B A N G L A D E S H
81Figure 4.2: Composition of Merchandise Exports in LDC and other
Developing Countries (Percentage of total merchandise exports)
LDCs All Developing Countries
70
26
87
9
4 4
0102030405060708090
100
1980-1983 2000-2003
Low-, medium and high technology manufactures
Labour-and resource-intensive manufactures
Primary commodities
30
1767
12
21
53
0
10
20
30
40
50
60
70
80
90
100
1980-1983 2000-2003
Low-, medium and high technology manufactures
Labour-and resource-intensive manufactures
Primary commodities
Source: UNCTAD (2006)
4.3. The Current Status of Negotiations and the Concerns of the
Developing Countries As stated earlier, the duty free market access provision under the GSP schemes provided by developed countries incorporated some restrictions in terms of the Rules of Origin (RoO) requirements. The RoO requirement states that there should be some minimum domestic value addition in the LDCs’ products in order to be qualified for enjoying the zero tariff facilities. In the EU market, the Everything-But-Arms (EBA) provision allowed all products from the LDCs, except arms, to enjoy the DFQF market access from 2001 with some ‘stringent’ RoO restrictions; Australia, on a country to country basis, allowed DFQF facility for all LDC products from 2002; Canada added 903 tariff lines, except dairy, poultry and egg products, for 48 LDCs from 2003 to be under DFQF treatment; USA allowed African LDCs a GSP facility with DFQF provision for all products under African Growth and Opportunity Act (AGOA) from 2000; and many other countries including Norway, Singapore, Switzerland, Japan and Korea have allowed some DFQF
W T O A N D R E G I O N A L T R A D E N E G O T I A T I O N O U T C O M E S : Q U A N T I T A T I V E
A S S E S S M E N T S O F P O T E N T I A L I M P L I C A T I O N S O N B A N G L A D E S H
82 provision for the LDC products from the beginning of the twenty-first century.
In the Sixth WTO Ministerial Conference, held in Hong Kong in December 2005, developed countries have made binding commitment with regard to providing duty-free and quota-free access to products originating from LDCs. According to the article 36 of Annex F of the Ministerial Declaration there is the commitment that “developed county members shall, and developing country members, declaring themselves in a position to do so, should provide Duty free Quota free market access on a lasting basis, for all products originating from all LDCs by 2008 or no later than the start of the implementation period”. The Hong Kong declaration has the provision for ‘members with difficulties’ to cover 97 percent of products, defined at the tariff line level, originating from the LDCs for DFQF consideration, and the developing countries are allowed to enjoy ‘appropriate flexibility’. Moreover, the Rules of Origin (RoO) requirements are also agreed to make simplified and transparent and preferential for the LDCs to enhance their market access.
It is, however, important to note that, the bilateral pressure from US on LDC negotiators to exclude some of the products from DFQF facilities may jeopardize the whole initiative. Some LDC negotiators argue that to be effective, all countries and all commodities should be under DFQF provision (BRIDGES, 15 December, 2005). However, there are several causes of concern on current negotiation outcome that leave room for LDCs to design further negotiation strategies:
a. The DFQF market access commitment is a binding commitment for developed countries. Therefore, firm commitment from all developed countries, especially from the USA and Japan, which have indicated their difficulties at this point of time, to provide DFQF market access for all products originating from LDCs needs to be reassured.
b. The provision of DFQF market access for at least 97 percent of products originating from LDCs, has one important implication which should be subject of further discussions and negotiations. The declared 97 percent is to be considered as the minimum, not the maximum level. That is, given the provision of Hong Kong MC, developed countries can make commitments at a much higher level than 97 percent.
L D C s ’ D U T Y - F R E E A N D Q U O T A - F R E E ( D F Q F ) A C C E S S T O D E V E L O P E D
C O U N T R I E S ’ M A R K E T S : P E R S P E C T I V E S F R O M B A N G L A D E S H
83c. The Hong Kong Declaration specifically provides that members
facing difficulties ‘shall take steps to progressively achieve compliance’. In this light, LDCs are to take a position that there must be a time line for phasing out the exclusion list.
d. The definition of providing DFQF access ‘on a lasting basis’ in paragraph 36 (a) (i) of the Hong Kong Ministerial Declaration is not clear. This should be considered as bound in the WTO, i.e., its implementation is mandatory and subject to dispute settlement discipline in case of breach.
e. The same paragraph of Hong Kong Ministerial Declaration while providing DFQF access for 97 percent of LDC products also mentions about ‘taking into account the impact on other developing countries at similar levels of development’. One can argue that developing countries at similar levels of development should imply consideration of interest of other LDCs, and not non-LDC developing countries.
f. LDCs’ strategy will be to keep most of the duty-paid export items out of exclusion list. One of the suggestions is to negotiate for having duty free access of all those products that have existing high tariffs (for example, tariff rates higher than 6 percent).
g. LDCs may negotiate to have those commodities that entered in the developed country markets with zero tariff facilities in the recent past to be included in the 97 percent duty free list.
h. LDCs are to point out that, tariffs on apparels and other industrial goods are expected to come down because of the on-going NAMA negotiations. Therefore, if the USA does not provide zero tariff market access now, the opportunity of benefiting from such preferential treatment will become insignificant in the near future.
i. There has also been a suggestion to propose to the US for consideration of ceilings for the items in the exclusion list, beyond which the specified duties may be imposed.
j. There can be negotiations about safeguarding the export interest of LDCs, which they are already enjoying. It is of the view that, since many other developed countries have comprehensive GSP schemes for LDCs, it is in the best interest of the latter that these schemes be brought under the ambit of the relevant special and differential treatment provision of the WTO.
W T O A N D R E G I O N A L T R A D E N E G O T I A T I O N O U T C O M E S : Q U A N T I T A T I V E
A S S E S S M E N T S O F P O T E N T I A L I M P L I C A T I O N S O N B A N G L A D E S H
84 An important concern, as far as the developing countries
perspectives are concerned, is that there is a possibility of preference erosion for the developing countries if the LDCs are allowed DFQF facilities for all of their products as agreed in the Hong Kong Ministerial Declaration. In general, the vulnerability to preference erosion depends on factors like preference margins (difference between MFN and preferential tariffs), product coverage (the ratio between products covered by a scheme and the dutiable imports), preference utilization rate (the ratio between imports that actually receive preferential treatment and those that are in principle covered) and the utility rate (the ratio of the value of imports that get preferences to all dutiable imports), all of which are measures of the use of preferential treatment enjoyed by the developing countries. The higher the values of the above indicators, the greater the risk of preference erosion with some generalized schemes of tariff reduction. The developing countries, that currently enjoy preferential tariff rates in the developed country markets for their exports, are subject to preference erosion with implementation of duty free access to LDC products; however, the magnitude will depend on the relative values of the above indicators in addition to the relative cost competitiveness of developing and least developed countries. Therefore, gains to LDCs from duty free quota free market access need to be weighted against the resulting preference erosion for the developing countries. 4.4. Global and Regional Welfare Effects of DFQF Market Access:
Estimates from the GTAP Model With a view to explore the different scenarios of LDCs’ DFQF market access in the developed and developing countries this chapter adopts the methodology depicted in chapter 2 of this volume. The regional and commodity aggregation of the GTAP model has already been discussed in that chapter. 4.4.1. Simulation Design for the DFQF Scenarios To examine the impacts of providing DFQF access of LDCs products in the developed and developing countries markets, five simulation
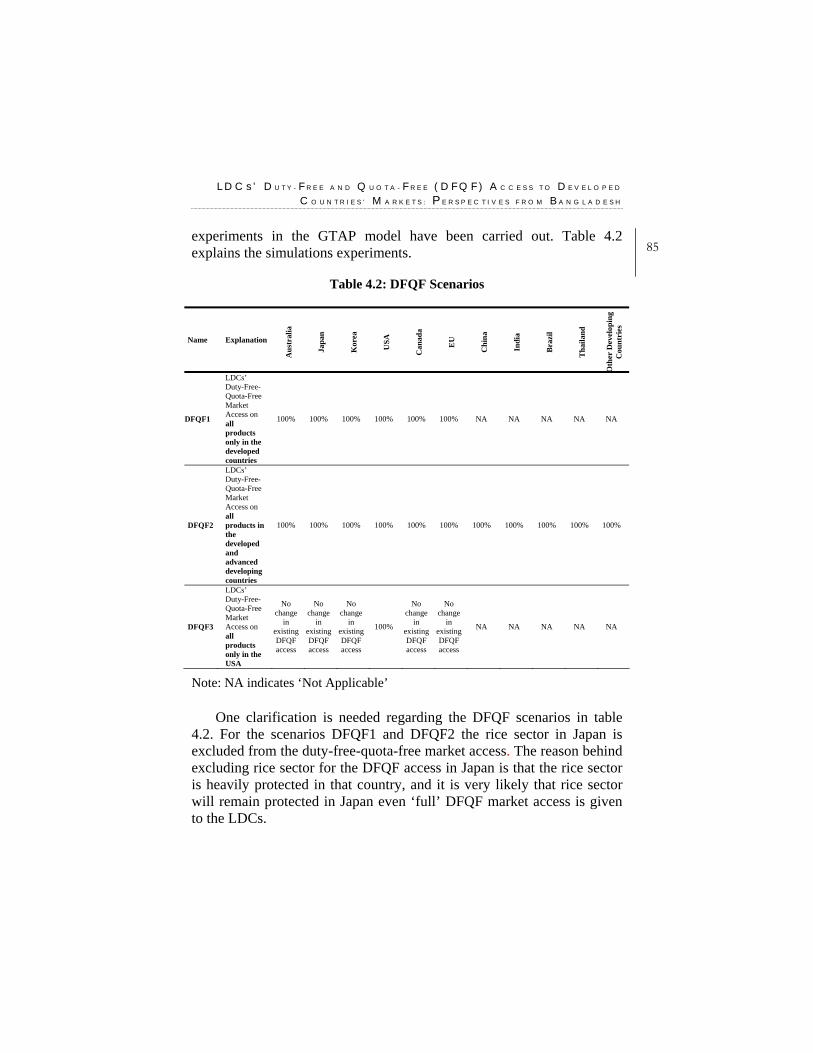
L D C s ’ D U T Y - F R E E A N D Q U O T A - F R E E ( D F Q F ) A C C E S S T O D E V E L O P E D
C O U N T R I E S ’ M A R K E T S : P E R S P E C T I V E S F R O M B A N G L A D E S H
85experiments in the GTAP model have been carried out. Table 4.2 explains the simulations experiments.
Table 4.2: DFQF Scenarios
Name Explanation
Aus
tral
ia
Japa
n
Kor
ea
USA
Can
ada
EU
Chi
na
Indi
a
Bra
zil
Tha
iland
Oth
er D
evel
opin
g
Cou
ntri
es
DFQF1
LDCs’ Duty-Free-Quota-Free Market Access on all products only in the developed countries
100% 100% 100% 100% 100% 100% NA NA NA NA NA
DFQF2
LDCs’ Duty-Free-Quota-Free Market Access on all products in the developed and advanced developing countries
100% 100% 100% 100% 100% 100% 100% 100% 100% 100% 100%
DFQF3
LDCs’ Duty-Free-Quota-Free Market Access on all products only in the USA
No change
in existing DFQF access
No change
in existing DFQF access
No change
in existing DFQF access
100%
No change
in existing DFQF access
No change
in existing DFQF access
NA NA NA NA NA
Note: NA indicates ‘Not Applicable’
One clarification is needed regarding the DFQF scenarios in table 4.2. For the scenarios DFQF1 and DFQF2 the rice sector in Japan is excluded from the duty-free-quota-free market access. The reason behind excluding rice sector for the DFQF access in Japan is that the rice sector is heavily protected in that country, and it is very likely that rice sector will remain protected in Japan even ‘full’ DFQF market access is given to the LDCs.
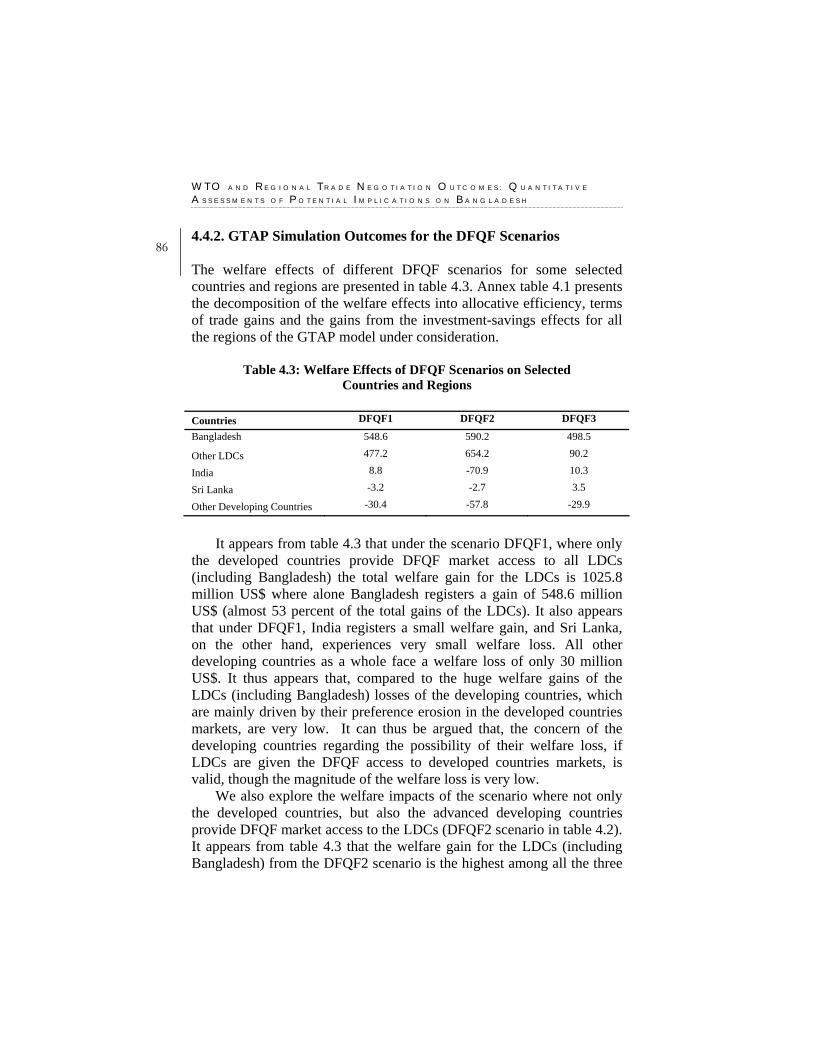
W T O A N D R E G I O N A L T R A D E N E G O T I A T I O N O U T C O M E S : Q U A N T I T A T I V E
A S S E S S M E N T S O F P O T E N T I A L I M P L I C A T I O N S O N B A N G L A D E S H
86 4.4.2. GTAP Simulation Outcomes for the DFQF Scenarios The welfare effects of different DFQF scenarios for some selected countries and regions are presented in table 4.3. Annex table 4.1 presents the decomposition of the welfare effects into allocative efficiency, terms of trade gains and the gains from the investment-savings effects for all the regions of the GTAP model under consideration.
Table 4.3: Welfare Effects of DFQF Scenarios on Selected Countries and Regions
Countries DFQF1 DFQF2 DFQF3
Bangladesh 548.6 590.2 498.5
Other LDCs 477.2 654.2 90.2
India 8.8 -70.9 10.3
Sri Lanka -3.2 -2.7 3.5
Other Developing Countries -30.4 -57.8 -29.9
It appears from table 4.3 that under the scenario DFQF1, where only
the developed countries provide DFQF market access to all LDCs (including Bangladesh) the total welfare gain for the LDCs is 1025.8 million US$ where alone Bangladesh registers a gain of 548.6 million US$ (almost 53 percent of the total gains of the LDCs). It also appears that under DFQF1, India registers a small welfare gain, and Sri Lanka, on the other hand, experiences very small welfare loss. All other developing countries as a whole face a welfare loss of only 30 million US$. It thus appears that, compared to the huge welfare gains of the LDCs (including Bangladesh) losses of the developing countries, which are mainly driven by their preference erosion in the developed countries markets, are very low. It can thus be argued that, the concern of the developing countries regarding the possibility of their welfare loss, if LDCs are given the DFQF access to developed countries markets, is valid, though the magnitude of the welfare loss is very low.
We also explore the welfare impacts of the scenario where not only the developed countries, but also the advanced developing countries provide DFQF market access to the LDCs (DFQF2 scenario in table 4.2). It appears from table 4.3 that the welfare gain for the LDCs (including Bangladesh) from the DFQF2 scenario is the highest among all the three
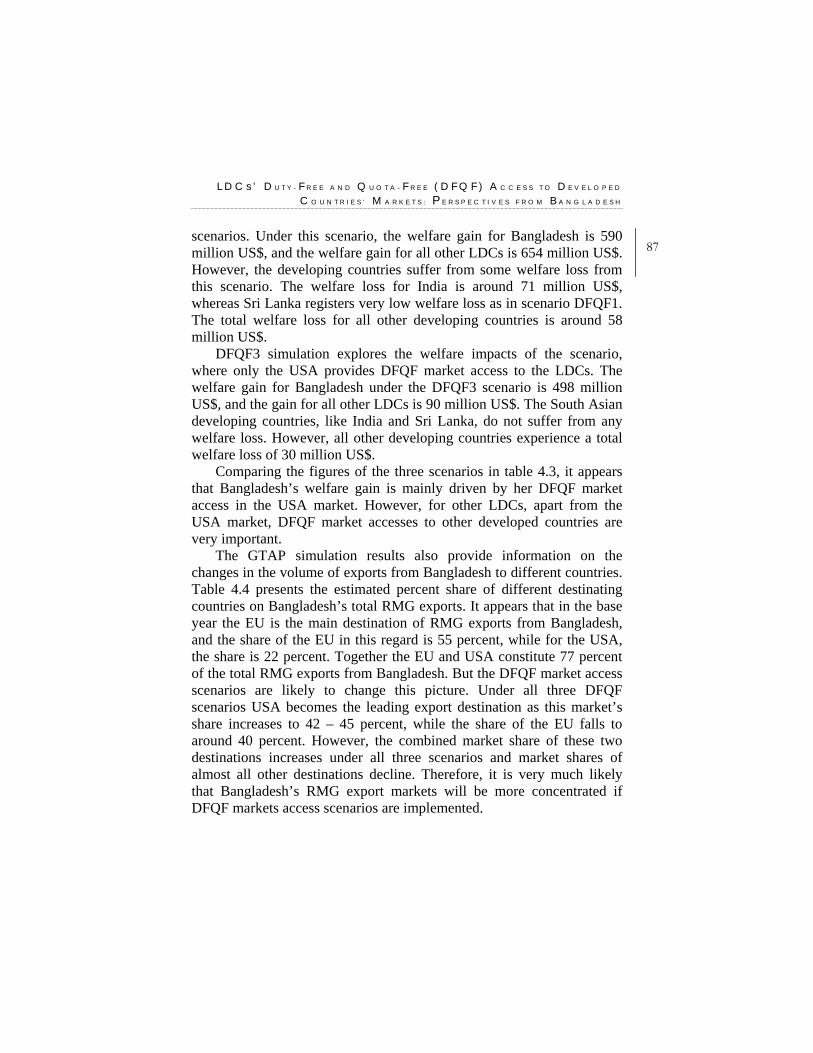
L D C s ’ D U T Y - F R E E A N D Q U O T A - F R E E ( D F Q F ) A C C E S S T O D E V E L O P E D
C O U N T R I E S ’ M A R K E T S : P E R S P E C T I V E S F R O M B A N G L A D E S H
87scenarios. Under this scenario, the welfare gain for Bangladesh is 590 million US$, and the welfare gain for all other LDCs is 654 million US$. However, the developing countries suffer from some welfare loss from this scenario. The welfare loss for India is around 71 million US$, whereas Sri Lanka registers very low welfare loss as in scenario DFQF1. The total welfare loss for all other developing countries is around 58 million US$.
DFQF3 simulation explores the welfare impacts of the scenario, where only the USA provides DFQF market access to the LDCs. The welfare gain for Bangladesh under the DFQF3 scenario is 498 million US$, and the gain for all other LDCs is 90 million US$. The South Asian developing countries, like India and Sri Lanka, do not suffer from any welfare loss. However, all other developing countries experience a total welfare loss of 30 million US$.
Comparing the figures of the three scenarios in table 4.3, it appears that Bangladesh’s welfare gain is mainly driven by her DFQF market access in the USA market. However, for other LDCs, apart from the USA market, DFQF market accesses to other developed countries are very important.
The GTAP simulation results also provide information on the changes in the volume of exports from Bangladesh to different countries. Table 4.4 presents the estimated percent share of different destinating countries on Bangladesh’s total RMG exports. It appears that in the base year the EU is the main destination of RMG exports from Bangladesh, and the share of the EU in this regard is 55 percent, while for the USA, the share is 22 percent. Together the EU and USA constitute 77 percent of the total RMG exports from Bangladesh. But the DFQF market access scenarios are likely to change this picture. Under all three DFQF scenarios USA becomes the leading export destination as this market’s share increases to 42 – 45 percent, while the share of the EU falls to around 40 percent. However, the combined market share of these two destinations increases under all three scenarios and market shares of almost all other destinations decline. Therefore, it is very much likely that Bangladesh’s RMG export markets will be more concentrated if DFQF markets access scenarios are implemented.
W T O A N D R E G I O N A L T R A D E N E G O T I A T I O N O U T C O M E S : Q U A N T I T A T I V E
A S S E S S M E N T S O F P O T E N T I A L I M P L I C A T I O N S O N B A N G L A D E S H
88 Table 4.4: More Concentration of the Bangladesh’s RMG Exports Market?
(Percent share) Base year
Share DFQF1 DFQF2 DFQF3
Australia and New Zealand 0.82 0.62 0.62 0.53
China 0.19 0.11 0.23 0.12
Japan 0.97 0.57 0.57 0.58
South Korea 0.15 0.19 0.19 0.08
India 0.26 0.16 0.31 0.16
Sri Lanka 0.11 0.07 0.07 0.07
Rest of South Asia 0.03 0.01 0.01 0.01
Canada 6.70 8.07 8.05 4.46
USA 22.28 42.96 42.36 45.46
Brazil 0.06 0.03 0.14 0.03
Other LDCs 0.33 0.22 0.22 0.22
EU 55.04 39.44 39.73 40.39
Other Developing Countries 4.51 2.52 2.50 2.64
Rest of the World 8.56 5.03 5.00 5.24
Total 100.00 100.00 100.00 100.00
USA + EU Market Share 77.32 82.4 82.49 86.36
Source: GTAP Simulation Results 4.5. Impacts of DFQF Market Access Scenarios on the Bangladesh
Economy: Estimates using the Bangladesh Dynamic CGE Model The Bangladesh Dynamic CGE model has been applied to explore the impacts of different DFQF scenarios on the Bangladesh economy. The detailed methodology of linking the results from the global model (the GTAP model) with the Bangladesh dynamic model has been elaborated in chapter 2. In brief, the export and import price shocks and the export volume shocks from the GTAP model are introduced in the Bangladesh dynamic model to examine the macro, sectoral, and welfare and poverty effects.
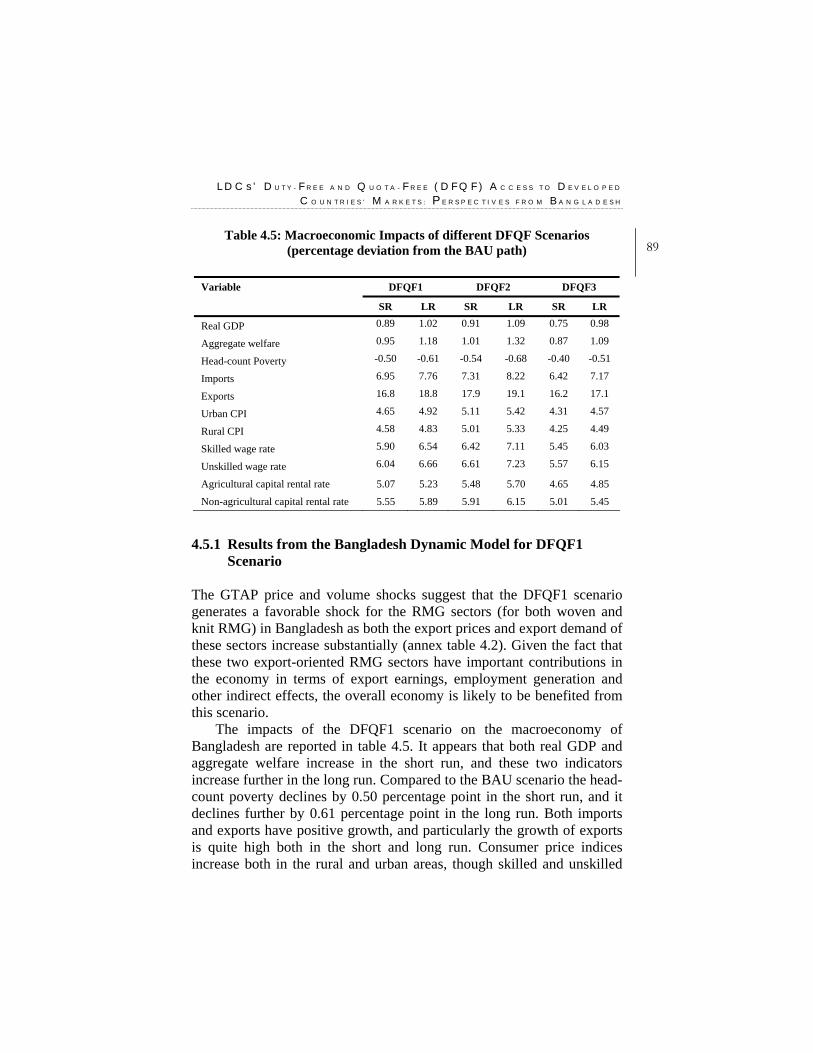
L D C s ’ D U T Y - F R E E A N D Q U O T A - F R E E ( D F Q F ) A C C E S S T O D E V E L O P E D
C O U N T R I E S ’ M A R K E T S : P E R S P E C T I V E S F R O M B A N G L A D E S H
89Table 4.5: Macroeconomic Impacts of different DFQF Scenarios
(percentage deviation from the BAU path)
Variable DFQF1 DFQF2 DFQF3
SR LR SR LR SR LR
Real GDP 0.89 1.02 0.91 1.09 0.75 0.98
Aggregate welfare 0.95 1.18 1.01 1.32 0.87 1.09
Head-count Poverty -0.50 -0.61 -0.54 -0.68 -0.40 -0.51
Imports 6.95 7.76 7.31 8.22 6.42 7.17
Exports 16.8 18.8 17.9 19.1 16.2 17.1
Urban CPI 4.65 4.92 5.11 5.42 4.31 4.57
Rural CPI 4.58 4.83 5.01 5.33 4.25 4.49
Skilled wage rate 5.90 6.54 6.42 7.11 5.45 6.03
Unskilled wage rate 6.04 6.66 6.61 7.23 5.57 6.15
Agricultural capital rental rate 5.07 5.23 5.48 5.70 4.65 4.85
Non-agricultural capital rental rate 5.55 5.89 5.91 6.15 5.01 5.45
4.5.1 Results from the Bangladesh Dynamic Model for DFQF1 Scenario
The GTAP price and volume shocks suggest that the DFQF1 scenario generates a favorable shock for the RMG sectors (for both woven and knit RMG) in Bangladesh as both the export prices and export demand of these sectors increase substantially (annex table 4.2). Given the fact that these two export-oriented RMG sectors have important contributions in the economy in terms of export earnings, employment generation and other indirect effects, the overall economy is likely to be benefited from this scenario.
The impacts of the DFQF1 scenario on the macroeconomy of Bangladesh are reported in table 4.5. It appears that both real GDP and aggregate welfare increase in the short run, and these two indicators increase further in the long run. Compared to the BAU scenario the head-count poverty declines by 0.50 percentage point in the short run, and it declines further by 0.61 percentage point in the long run. Both imports and exports have positive growth, and particularly the growth of exports is quite high both in the short and long run. Consumer price indices increase both in the rural and urban areas, though skilled and unskilled
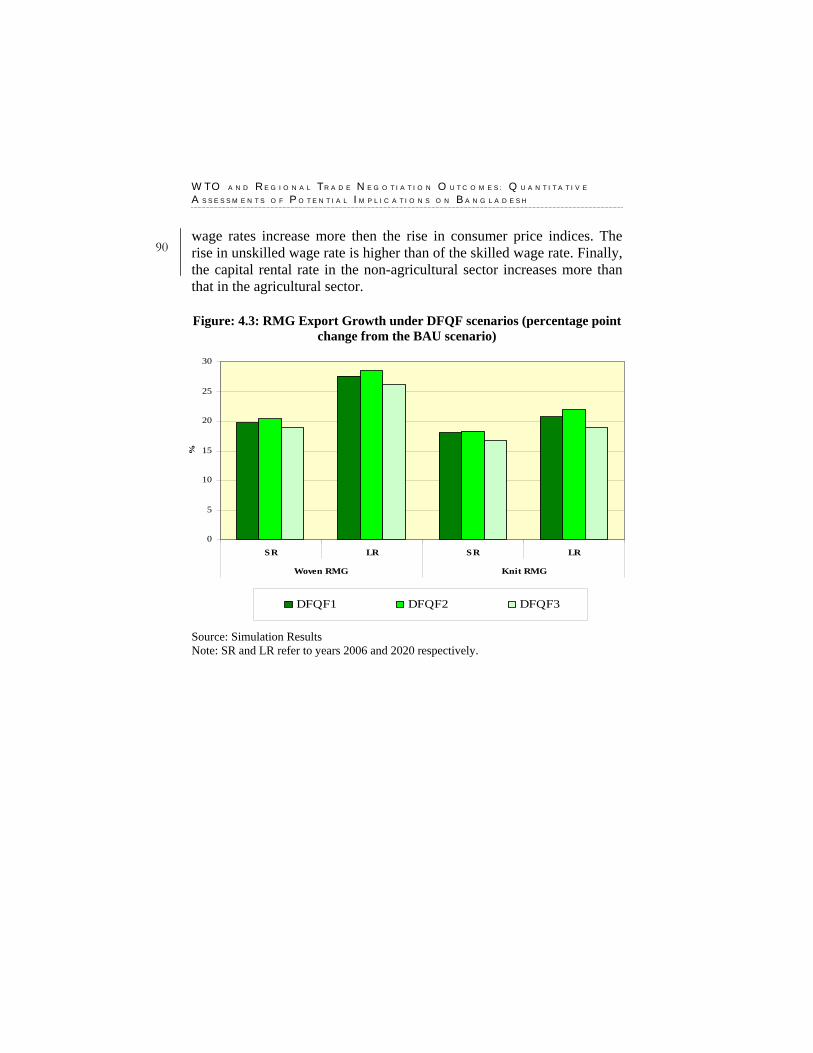
W T O A N D R E G I O N A L T R A D E N E G O T I A T I O N O U T C O M E S : Q U A N T I T A T I V E
A S S E S S M E N T S O F P O T E N T I A L I M P L I C A T I O N S O N B A N G L A D E S H
90 wage rates increase more then the rise in consumer price indices. The rise in unskilled wage rate is higher than of the skilled wage rate. Finally, the capital rental rate in the non-agricultural sector increases more than that in the agricultural sector. Figure: 4.3: RMG Export Growth under DFQF scenarios (percentage point
change from the BAU scenario)
0
5
10
15
20
25
30
SR LR SR LR
Woven RMG Knit RMG
%
DFQF1 DFQF2 DFQF3
Source: Simulation Results Note: SR and LR refer to years 2006 and 2020 respectively.
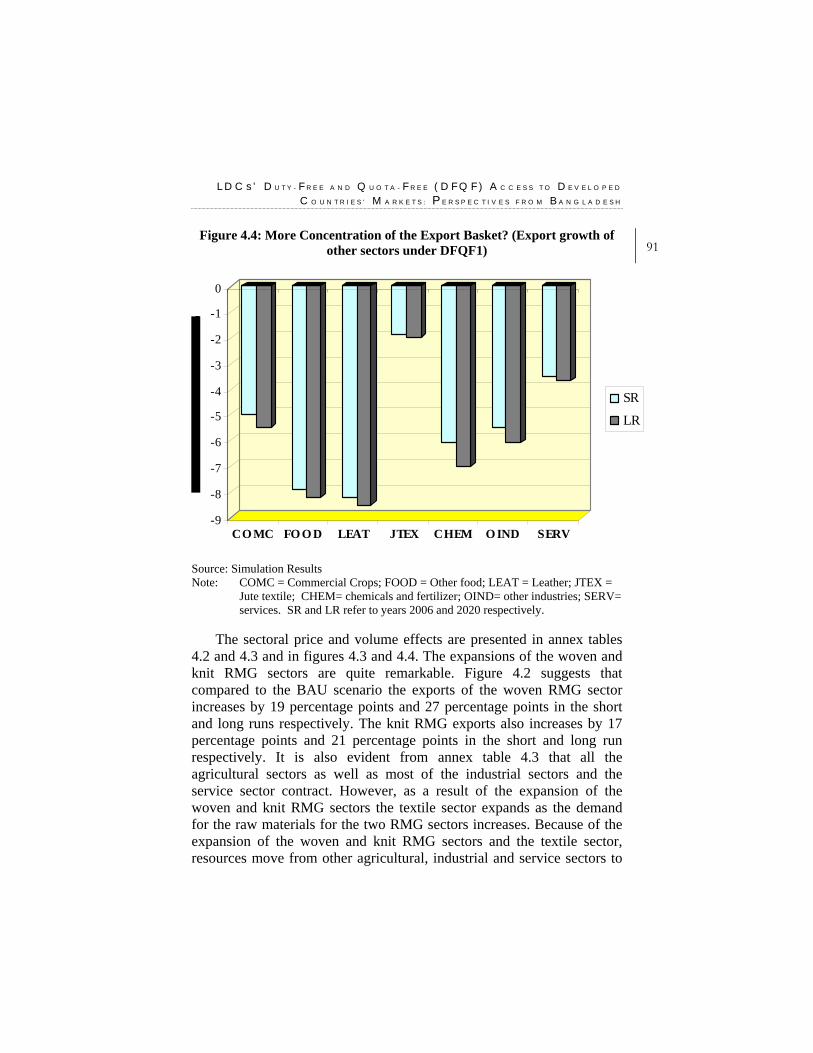
L D C s ’ D U T Y - F R E E A N D Q U O T A - F R E E ( D F Q F ) A C C E S S T O D E V E L O P E D
C O U N T R I E S ’ M A R K E T S : P E R S P E C T I V E S F R O M B A N G L A D E S H
91Figure 4.4: More Concentration of the Export Basket? (Export growth of
other sectors under DFQF1)
-9
-8
-7
-6
-5
-4
-3
-2
-1
0
CO MC FO O D LEAT JTEX CHEM O IND SERV
SR
LR
Source: Simulation Results Note: COMC = Commercial Crops; FOOD = Other food; LEAT = Leather; JTEX =
Jute textile; CHEM= chemicals and fertilizer; OIND= other industries; SERV= services. SR and LR refer to years 2006 and 2020 respectively.
The sectoral price and volume effects are presented in annex tables 4.2 and 4.3 and in figures 4.3 and 4.4. The expansions of the woven and knit RMG sectors are quite remarkable. Figure 4.2 suggests that compared to the BAU scenario the exports of the woven RMG sector increases by 19 percentage points and 27 percentage points in the short and long runs respectively. The knit RMG exports also increases by 17 percentage points and 21 percentage points in the short and long run respectively. It is also evident from annex table 4.3 that all the agricultural sectors as well as most of the industrial sectors and the service sector contract. However, as a result of the expansion of the woven and knit RMG sectors the textile sector expands as the demand for the raw materials for the two RMG sectors increases. Because of the expansion of the woven and knit RMG sectors and the textile sector, resources move from other agricultural, industrial and service sectors to
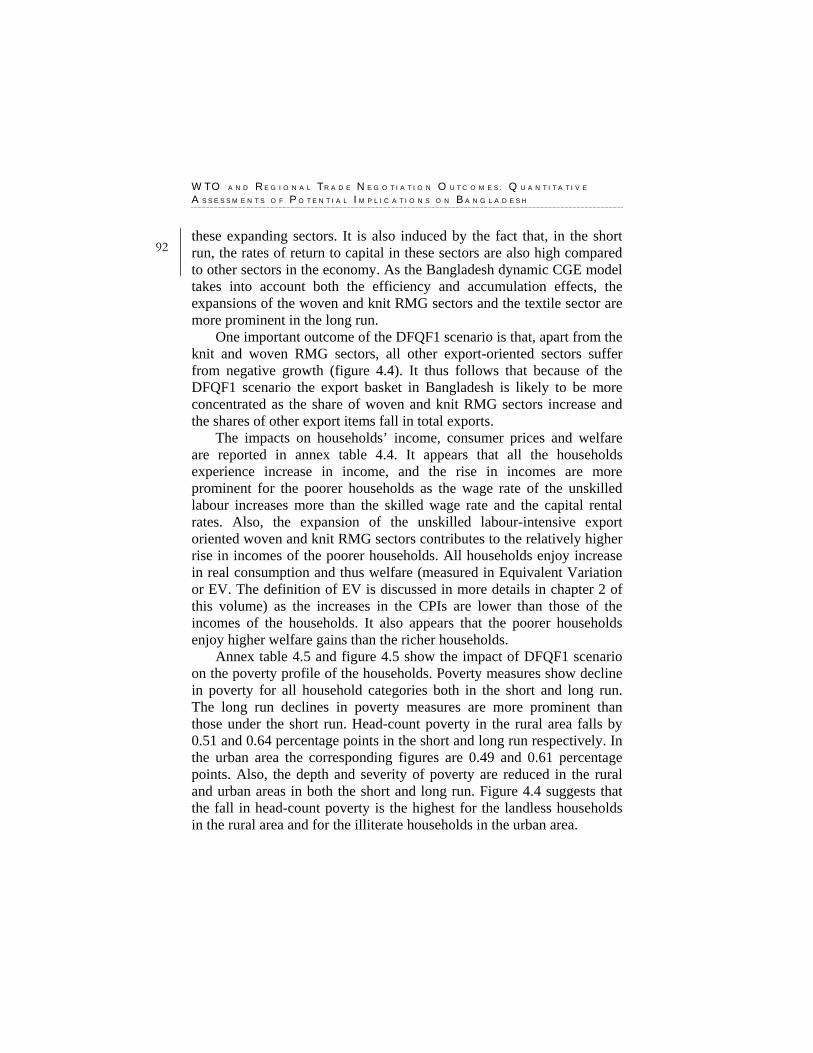
W T O A N D R E G I O N A L T R A D E N E G O T I A T I O N O U T C O M E S : Q U A N T I T A T I V E
A S S E S S M E N T S O F P O T E N T I A L I M P L I C A T I O N S O N B A N G L A D E S H
92 these expanding sectors. It is also induced by the fact that, in the short run, the rates of return to capital in these sectors are also high compared to other sectors in the economy. As the Bangladesh dynamic CGE model takes into account both the efficiency and accumulation effects, the expansions of the woven and knit RMG sectors and the textile sector are more prominent in the long run.
One important outcome of the DFQF1 scenario is that, apart from the knit and woven RMG sectors, all other export-oriented sectors suffer from negative growth (figure 4.4). It thus follows that because of the DFQF1 scenario the export basket in Bangladesh is likely to be more concentrated as the share of woven and knit RMG sectors increase and the shares of other export items fall in total exports.
The impacts on households’ income, consumer prices and welfare are reported in annex table 4.4. It appears that all the households experience increase in income, and the rise in incomes are more prominent for the poorer households as the wage rate of the unskilled labour increases more than the skilled wage rate and the capital rental rates. Also, the expansion of the unskilled labour-intensive export oriented woven and knit RMG sectors contributes to the relatively higher rise in incomes of the poorer households. All households enjoy increase in real consumption and thus welfare (measured in Equivalent Variation or EV. The definition of EV is discussed in more details in chapter 2 of this volume) as the increases in the CPIs are lower than those of the incomes of the households. It also appears that the poorer households enjoy higher welfare gains than the richer households.
Annex table 4.5 and figure 4.5 show the impact of DFQF1 scenario on the poverty profile of the households. Poverty measures show decline in poverty for all household categories both in the short and long run. The long run declines in poverty measures are more prominent than those under the short run. Head-count poverty in the rural area falls by 0.51 and 0.64 percentage points in the short and long run respectively. In the urban area the corresponding figures are 0.49 and 0.61 percentage points. Also, the depth and severity of poverty are reduced in the rural and urban areas in both the short and long run. Figure 4.4 suggests that the fall in head-count poverty is the highest for the landless households in the rural area and for the illiterate households in the urban area.
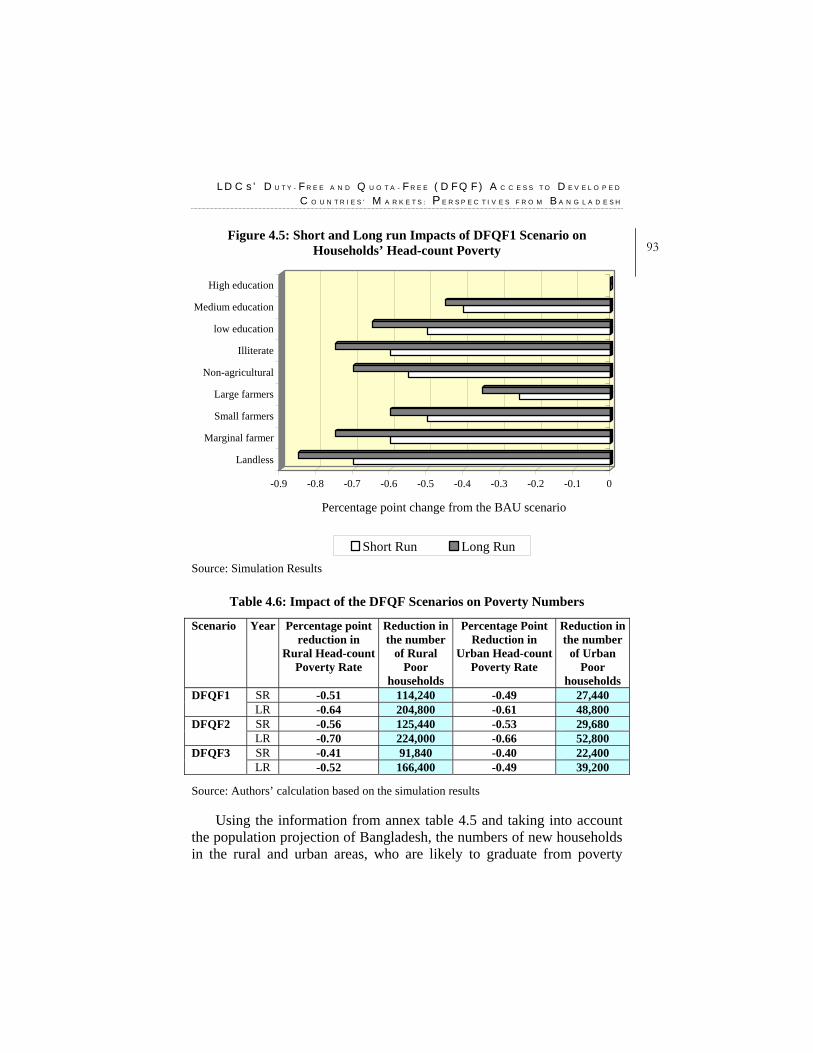
L D C s ’ D U T Y - F R E E A N D Q U O T A - F R E E ( D F Q F ) A C C E S S T O D E V E L O P E D
C O U N T R I E S ’ M A R K E T S : P E R S P E C T I V E S F R O M B A N G L A D E S H
93Figure 4.5: Short and Long run Impacts of DFQF1 Scenario on
Households’ Head-count Poverty
-0.9 -0.8 -0.7 -0.6 -0.5 -0.4 -0.3 -0.2 -0.1 0
Percentage point change from the BAU scenario
Landless
Marginal farmer
Small farmers
Large farmers
Non-agricultural
Illiterate
low education
Medium education
High education
Short Run Long Run Source: Simulation Results
Table 4.6: Impact of the DFQF Scenarios on Poverty Numbers
Scenario Year Percentage point reduction in
Rural Head-count Poverty Rate
Reduction in the number
of Rural Poor
households
Percentage Point Reduction in
Urban Head-countPoverty Rate
Reduction in the number
of Urban Poor
households SR -0.51 114,240 -0.49 27,440 DFQF1
LR -0.64 204,800 -0.61 48,800 SR -0.56 125,440 -0.53 29,680 DFQF2 LR -0.70 224,000 -0.66 52,800 SR -0.41 91,840 -0.40 22,400 DFQF3 LR -0.52 166,400 -0.49 39,200
Source: Authors’ calculation based on the simulation results
Using the information from annex table 4.5 and taking into account the population projection of Bangladesh, the numbers of new households in the rural and urban areas, who are likely to graduate from poverty
W T O A N D R E G I O N A L T R A D E N E G O T I A T I O N O U T C O M E S : Q U A N T I T A T I V E
A S S E S S M E N T S O F P O T E N T I A L I M P L I C A T I O N S O N B A N G L A D E S H
94 under the DFQF scenarios, are estimated (table 4.6). It appears that DFQF1 scenario can lead to a situation where significant numbers of rural and urban households can get rid of poverty. 4.5.2. Results from the Bangladesh Dynamic Model for DFQF2 Scenario The macroeconomic impacts of the DFQF2 scenario are very much similar to those under the DFQF1 scenario (table 4.5). However, the impacts are more favourable to the economy. The magnitudes of the increases in real GDP and aggregate welfare are higher than those under DFQF1. Also, the growth of imports and exports are more profound under DFQF2 scenario. The fall in the head-count poverty, both in the short and long run, are more prominent in this scenario. The pattern of the changes in the CPIs, wage rates and the capital rental rates are the same as in DFQF1 but the magnitudes are higher.
The sectoral impacts are much similar to those under the scenario DFQF1 (annex tables 4.2, 4.3 and figure 4.2). However, the expansions of the woven and knit RMG sectors and the textile sector are more prominent under the current scenario. On the other hand, most of the other export-oriented sectors suffer from negative export growth. The resources are reallocated from the agricultural and other manufacturing and service sectors to the expanding woven and knit RMG sectors and textile sectors.
The income and welfare impacts on the households under this scenario are also very much comparable to those under DFQF1 (annex table 4.4). Again, the poorer households, who depend mostly on unskilled labour income, benefit more than other households as the wage of unskilled labour increases and there is an expansion of the unskilled labour-intensive export oriented RMG sectors.
Poverty impacts of this scenario indicate a better picture compared to those under DFQF1 scenario (annex table 4.5 and table 4.6). It appears that poverty of the poorer households decline more when Bangladesh achieve DFQF access not only in the markets in the developed countries but also in the advanced developing countries.
L D C s ’ D U T Y - F R E E A N D Q U O T A - F R E E ( D F Q F ) A C C E S S T O D E V E L O P E D
C O U N T R I E S ’ M A R K E T S : P E R S P E C T I V E S F R O M B A N G L A D E S H
954.5.3. Results from the Bangladesh Dynamic Model for DFQF3
Scenario The pattern of the macroeconomic impacts under DFQF3 scenario are also similar to those under the previous two scenarios, however the magnitudes of the impacts are the smallest among the three scenarios (table 4.5). However, it appears that even under DFQF3 scenario the positive impacts on real GDP, aggregate welfare, and poverty reduction are noticeable.
At the sectoral level, the DFQF3 scenario also generates high export growth of the woven and knit RMG sectors, and textile sector also expands (annex table 4.2, 4.3 and figure 4.2). It appears that even a DFQF market access in the USA can lead to an export growth of the RMG sectors almost as high as the growth under the DFQF1 and DFQF2 scenarios.
The income and welfare effects are also similar as under the DFQF1 and DFQF2 scenarios, though the impacts are smallest in magnitudes (annex table 4.4). Again the poorer households turn out to be largest gainers.
The impacts on poverty measures are also prominent under this scenario, and the pattern is the same as in DFQF1 and DFQF2 scenarios (annex table 4.5 and table 4.6). The numbers of households in the rural and urban areas, who can get out of poverty, are very significant (though lower than under DFQF1 or DFQF2 scenarios). It can thus be argued that a DFQF market access only in the USA can lead to important poverty reduction in Bangladesh. 4.6. The Bangladesh Strategies and Concerns The Hong Kong Ministerial Declaration allowed ‘members facing difficulties’ to reduce the LDC product coverage for duty-free treatment to 97 percent of tariff lines. As Bangladesh’s exports are heavily concentrated on a few textile and clothing (T&C) categories, the Hong Kong Ministerial Conference (MC) declaration potentially implies no additional benefits for Bangladesh at all. For example, in the US Harmonised System (HS) 8-digit tariff lines there are 10,265 commodities. A 3 percent reservation list would then mean exclusion of

W T O A N D R E G I O N A L T R A D E N E G O T I A T I O N O U T C O M E S : Q U A N T I T A T I V E
A S S E S S M E N T S O F P O T E N T I A L I M P L I C A T I O N S O N B A N G L A D E S H
96 308 items from the duty-free and quota free (DFQF) facilities.8 Bangladesh’s top 10 apparel export items account for more than 46 percent of the country’s total exports to the US, top 20 items 61 percent, top 30 products 70 percent, and top 50 products 80 percent. According to one estimate, if the US decided to keep only those items in the 3 percent list that had imports from LDCs (to the US) of more than $50,000, it could eventually get away with not giving DFQF access for 224 apparel products thereby depriving 90 percent exports of Bangladesh and Cambodia. Again, if the US wants to exclude those items on which its existing tariff rate is 20 percent and above, it can restrict 137 apparel exports denying DFQF access to Bangladesh’s more than 90 percent exports. These signify the severity of an apparently small trade restriction, which is mainly attributable to a very narrow export base of Bangladesh.
After the Hong Kong MC, Bangladesh is now desperately trying to protect its interest as the US has already indicated its taking resort to 3 percent ‘exclusion list’ while Japan has indicated its inability to make DFQF commitments on 180 tariff lines, which includes such items as rice, fish, leather, and sugar. In this backdrop, the Ministry of Commerce (MOC), Government of Bangladesh, formed a Committee on Market Access to devise Bangladesh’s strategy as regards post-Hong Kong negotiations on the modalities by which the provision of the DFQF access for LDCs would be implemented. The Committee has produced its report and recommendations. Besides the common LDC strategies and considerations mentioned earlier, Bangladesh’s specific strategies in the post-Hong Kong negotiations related to the DFQF market access are summarized below.
a) The Hong Kong Declaration specifically provides that members facing difficulties ‘shall take steps to progressively achieve compliance’. In association with this, Bangladesh is to urge that the phrase ‘members facing difficulties’ needs to be defined precisely.
b) The DFQF initiative opens up an opportunity for a review of the rules of origin (RoO) requirements as the Hong Kong Declaration clearly states that ‘…preferential rules of origin applicable to imports from LDCs are transparent and simple….’. In this regard,
8 Note that after the abolition of Multi-fibre Arrangement (MFA), quantitative restrictions are no
longer imposed on trade in goods. Therefore, the issue of DFQF market access is essentially an issue of tariff free market access.
L D C s ’ D U T Y - F R E E A N D Q U O T A - F R E E ( D F Q F ) A C C E S S T O D E V E L O P E D
C O U N T R I E S ’ M A R K E T S : P E R S P E C T I V E S F R O M B A N G L A D E S H
97Bangladesh’s proposal will be to follow the RoO regime of Canada, which requires a simple 25 percent domestic value addition as a pre-condition for obtaining preferential access.
c) Bangladesh has now prepared a list of products covering 97 percent of exports for receiving DFQF market access. It will try to ensure that the products that are of export interest to Bangladesh are in the exclusion list of 3 percent in as small number as possible.
d) In 2005, 233 export items of Bangladesh entered into the US market either on MFN zero-duty basis (108 items) or GSP duty-free basis (125 items). Bangladesh will negotiate to have these commodities in the 97 percent duty free list.
e) Bangladesh is also to put emphasis on negotiating with the US in particular. The country will now try to portray a realistic assessment of its competitive strength in T&C exports taking into consideration of the fact that immediately after China’s accession to the WTO, the country’s exports to the US market actually fell. The situation slightly improved only after the imposition of US safeguard measures against China.
f) It is to be argued that providing DFQF access to Bangladesh is unlikely to cause any major disruptions for other countries. The apparel items exported by Bangladesh compete mainly in the lower segment of the US market, and consequently do not compete with the products manufactured in the US. Furthermore, Rest of South Asia specialises in home textile apparels, and Sri Lanka in women under garments, in which Bangladesh has no comparative advantage. However, there is no denying that in certain items Bangladesh competes with other developing countries. Because of these few items, the inclusion of all or most of Bangladesh’s apparel products in the exclusion list is not justified.
g) Another strategy for Bangladesh would be to seek low tariffs (5 percent) on commodities in the exclusion list.
h) Bangladesh is to take the position that while deciding about commodities for DFQF market access, the US or any other developed countries should not differentiate commodities across LDCs.
W T O A N D R E G I O N A L T R A D E N E G O T I A T I O N O U T C O M E S : Q U A N T I T A T I V E
A S S E S S M E N T S O F P O T E N T I A L I M P L I C A T I O N S O N B A N G L A D E S H
98 i) If major export items are included in the exclusion list,
Bangladesh should emphasize on phasing out of them on a priority basis and in an expeditious manner.
j) 41 items that Bangladesh exports to Japan are on the Japan’s sensitive list and some more are subject to tariffs. Bangladesh’s strategy here will be to reduce the numbers and to obtain duty free access of items having tariffs in particular.
4.7. Conclusion This paper has explored the impacts of different DFQF scenarios on different economies and on the economy of Bangladesh. It appears that the DFQF market access of LDCs in the developed countries generate large welfare gains for the LDCs, and particularly for Bangladesh. In fact, the gain to Bangladesh alone constitutes a major portion of the total LDCs’ gain. It is also conserved that even a DFQF market access only in the US market leads to a large welfare gain. The concern of the developing countries about the possibility of their losses can not be ruled out. However, the losses of the developing countries appear to very small compared to the gains of the LDCs.
The impacts of different DFQF market access scenarios on the economy of Bangladesh are also explored using the Bangladesh dynamic CGE model. The DFQF scenarios have positive impacts on the macroeconomy and on the expansion of the RMG sectors. Also, they have positive impacts in alleviating poverty. There is, however, a concern that such a DFQF market access may work against the strategy of diversification of the export basket of Bangladesh.
The paper has also explored the future line of strategies for Bangladesh in the negotiations on DFQF market access. There is no denying that Bangladesh needs to put much of her efforts in such negotiations as the stakes are very high for Bangladesh.
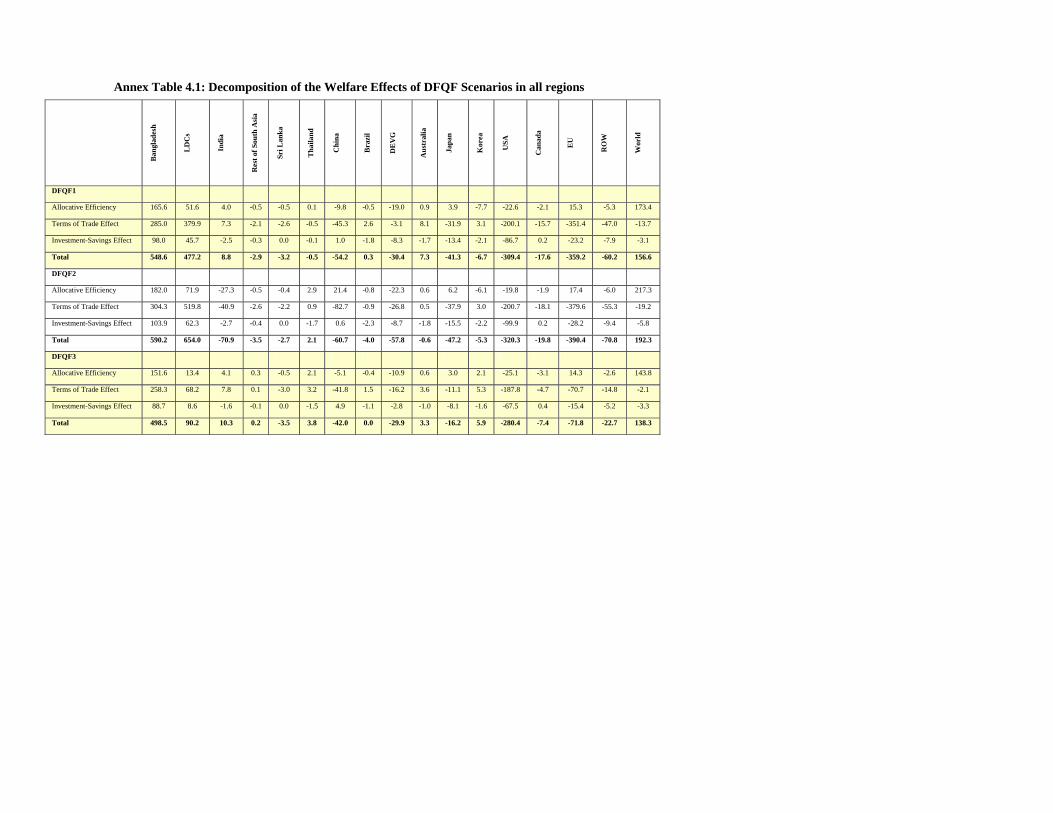
Annex Table 4.1: Decomposition of the Welfare Effects of DFQF Scenarios in all regions
Ban
glad
esh
LD
Cs
Indi
a
Res
t of S
outh
Asi
a
Sri L
anka
Tha
iland
Chi
na
Bra
zil
DE
VG
Aus
tral
ia
Japa
n
Kor
ea
USA
Can
ada
EU
RO
W
Wor
ld
DFQF1
Allocative Efficiency 165.6 51.6 4.0 -0.5 -0.5 0.1 -9.8 -0.5 -19.0 0.9 3.9 -7.7 -22.6 -2.1 15.3 -5.3 173.4
Terms of Trade Effect 285.0 379.9 7.3 -2.1 -2.6 -0.5 -45.3 2.6 -3.1 8.1 -31.9 3.1 -200.1 -15.7 -351.4 -47.0 -13.7
Investment-Savings Effect 98.0 45.7 -2.5 -0.3 0.0 -0.1 1.0 -1.8 -8.3 -1.7 -13.4 -2.1 -86.7 0.2 -23.2 -7.9 -3.1
Total 548.6 477.2 8.8 -2.9 -3.2 -0.5 -54.2 0.3 -30.4 7.3 -41.3 -6.7 -309.4 -17.6 -359.2 -60.2 156.6
DFQF2
Allocative Efficiency 182.0 71.9 -27.3 -0.5 -0.4 2.9 21.4 -0.8 -22.3 0.6 6.2 -6.1 -19.8 -1.9 17.4 -6.0 217.3
Terms of Trade Effect 304.3 519.8 -40.9 -2.6 -2.2 0.9 -82.7 -0.9 -26.8 0.5 -37.9 3.0 -200.7 -18.1 -379.6 -55.3 -19.2
Investment-Savings Effect 103.9 62.3 -2.7 -0.4 0.0 -1.7 0.6 -2.3 -8.7 -1.8 -15.5 -2.2 -99.9 0.2 -28.2 -9.4 -5.8
Total 590.2 654.0 -70.9 -3.5 -2.7 2.1 -60.7 -4.0 -57.8 -0.6 -47.2 -5.3 -320.3 -19.8 -390.4 -70.8 192.3
DFQF3
Allocative Efficiency 151.6 13.4 4.1 0.3 -0.5 2.1 -5.1 -0.4 -10.9 0.6 3.0 2.1 -25.1 -3.1 14.3 -2.6 143.8
Terms of Trade Effect 258.3 68.2 7.8 0.1 -3.0 3.2 -41.8 1.5 -16.2 3.6 -11.1 5.3 -187.8 -4.7 -70.7 -14.8 -2.1
Investment-Savings Effect 88.7 8.6 -1.6 -0.1 0.0 -1.5 4.9 -1.1 -2.8 -1.0 -8.1 -1.6 -67.5 0.4 -15.4 -5.2 -3.3
Total 498.5 90.2 10.3 0.2 -3.5 3.8 -42.0 0.0 -29.9 3.3 -16.2 5.9 -280.4 -7.4 -71.8 -22.7 138.3
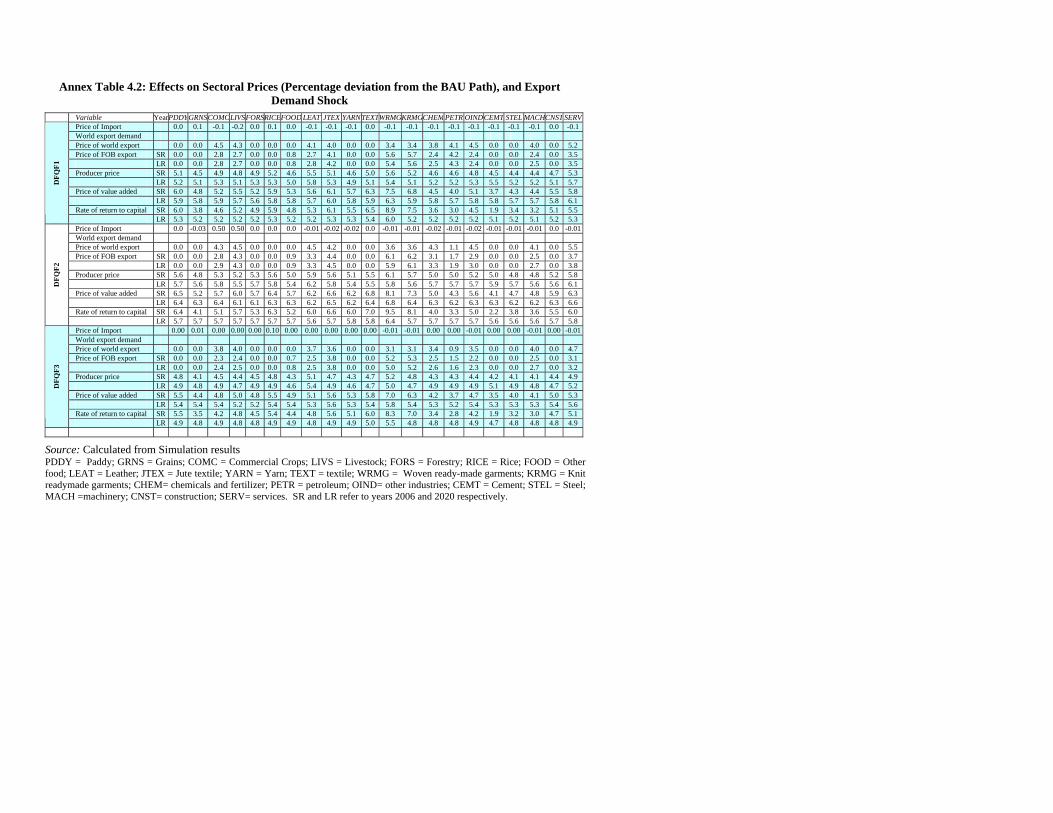
Annex Table 4.2: Effects on Sectoral Prices (Percentage deviation from the BAU Path), and Export Demand Shock
Variable YearPDDYGRNS COMCLIVS FORSRICEFOOD LEAT JTEX YARNTEXTWRMGKRMGCHEMPETR OINDCEMT STEL MACHCNST SERVPrice of Import 0.0 0.1 -0.1 -0.2 0.0 0.1 0.0 -0.1 -0.1 -0.1 0.0 -0.1 -0.1 -0.1 -0.1 -0.1 -0.1 -0.1 -0.1 0.0 -0.1World export demand Price of world export 0.0 0.0 4.5 4.3 0.0 0.0 0.0 4.1 4.0 0.0 0.0 3.4 3.4 3.8 4.1 4.5 0.0 0.0 4.0 0.0 5.2 Price of FOB export SR 0.0 0.0 2.8 2.7 0.0 0.0 0.8 2.7 4.1 0.0 0.0 5.6 5.7 2.4 4.2 2.4 0.0 0.0 2.4 0.0 3.5 LR 0.0 0.0 2.8 2.7 0.0 0.0 0.8 2.8 4.2 0.0 0.0 5.4 5.6 2.5 4.3 2.4 0.0 0.0 2.5 0.0 3.5 Producer price SR 5.1 4.5 4.9 4.8 4.9 5.2 4.6 5.5 5.1 4.6 5.0 5.6 5.2 4.6 4.6 4.8 4.5 4.4 4.4 4.7 5.3 LR 5.2 5.1 5.3 5.1 5.3 5.3 5.0 5.8 5.3 4.9 5.1 5.4 5.1 5.2 5.2 5.3 5.5 5.2 5.2 5.1 5.7 Price of value added SR 6.0 4.8 5.2 5.5 5.2 5.9 5.3 5.6 6.1 5.7 6.3 7.5 6.8 4.5 4.0 5.1 3.7 4.3 4.4 5.5 5.8 LR 5.9 5.8 5.9 5.7 5.6 5.8 5.8 5.7 6.0 5.8 5.9 6.3 5.9 5.8 5.7 5.8 5.8 5.7 5.7 5.8 6.1 Rate of return to capital SR 6.0 3.8 4.6 5.2 4.9 5.9 4.8 5.3 6.1 5.5 6.5 8.9 7.5 3.6 3.0 4.5 1.9 3.4 3.2 5.1 5.5
DFQ
F1
LR 5.3 5.2 5.2 5.2 5.2 5.3 5.2 5.2 5.3 5.3 5.4 6.0 5.2 5.2 5.2 5.2 5.1 5.2 5.1 5.2 5.3 Price of Import 0.0 -0.03 0.50 0.50 0.0 0.0 0.0 -0.01 -0.02 -0.02 0.0 -0.01 -0.01 -0.02 -0.01 -0.02 -0.01 -0.01 -0.01 0.0 -0.01World export demand Price of world export 0.0 0.0 4.3 4.5 0.0 0.0 0.0 4.5 4.2 0.0 0.0 3.6 3.6 4.3 1.1 4.5 0.0 0.0 4.1 0.0 5.5 Price of FOB export SR 0.0 0.0 2.8 4.3 0.0 0.0 0.9 3.3 4.4 0.0 0.0 6.1 6.2 3.1 1.7 2.9 0.0 0.0 2.5 0.0 3.7 LR 0.0 0.0 2.9 4.3 0.0 0.0 0.9 3.3 4.5 0.0 0.0 5.9 6.1 3.3 1.9 3.0 0.0 0.0 2.7 0.0 3.8 Producer price SR 5.6 4.8 5.3 5.2 5.3 5.6 5.0 5.9 5.6 5.1 5.5 6.1 5.7 5.0 5.0 5.2 5.0 4.8 4.8 5.2 5.8 LR 5.7 5.6 5.8 5.5 5.7 5.8 5.4 6.2 5.8 5.4 5.5 5.8 5.6 5.7 5.7 5.7 5.9 5.7 5.6 5.6 6.1 Price of value added SR 6.5 5.2 5.7 6.0 5.7 6.4 5.7 6.2 6.6 6.2 6.8 8.1 7.3 5.0 4.3 5.6 4.1 4.7 4.8 5.9 6.3 LR 6.4 6.3 6.4 6.1 6.1 6.3 6.3 6.2 6.5 6.2 6.4 6.8 6.4 6.3 6.2 6.3 6.3 6.2 6.2 6.3 6.6 Rate of return to capital SR 6.4 4.1 5.1 5.7 5.3 6.3 5.2 6.0 6.6 6.0 7.0 9.5 8.1 4.0 3.3 5.0 2.2 3.8 3.6 5.5 6.0
DFQ
F2
LR 5.7 5.7 5.7 5.7 5.7 5.7 5.7 5.6 5.7 5.8 5.8 6.4 5.7 5.7 5.7 5.7 5.6 5.6 5.6 5.7 5.8 Price of Import 0.00 0.01 0.00 0.00 0.00 0.10 0.00 0.00 0.00 0.00 0.00 -0.01 -0.01 0.00 0.00 -0.01 0.00 0.00 -0.01 0.00 -0.01World export demand Price of world export 0.0 0.0 3.8 4.0 0.0 0.0 0.0 3.7 3.6 0.0 0.0 3.1 3.1 3.4 0.9 3.5 0.0 0.0 4.0 0.0 4.7 Price of FOB export SR 0.0 0.0 2.3 2.4 0.0 0.0 0.7 2.5 3.8 0.0 0.0 5.2 5.3 2.5 1.5 2.2 0.0 0.0 2.5 0.0 3.1 LR 0.0 0.0 2.4 2.5 0.0 0.0 0.8 2.5 3.8 0.0 0.0 5.0 5.2 2.6 1.6 2.3 0.0 0.0 2.7 0.0 3.2 Producer price SR 4.8 4.1 4.5 4.4 4.5 4.8 4.3 5.1 4.7 4.3 4.7 5.2 4.8 4.3 4.3 4.4 4.2 4.1 4.1 4.4 4.9 LR 4.9 4.8 4.9 4.7 4.9 4.9 4.6 5.4 4.9 4.6 4.7 5.0 4.7 4.9 4.9 4.9 5.1 4.9 4.8 4.7 5.2 Price of value added SR 5.5 4.4 4.8 5.0 4.8 5.5 4.9 5.1 5.6 5.3 5.8 7.0 6.3 4.2 3.7 4.7 3.5 4.0 4.1 5.0 5.3 LR 5.4 5.4 5.4 5.2 5.2 5.4 5.4 5.3 5.6 5.3 5.4 5.8 5.4 5.3 5.2 5.4 5.3 5.3 5.3 5.4 5.6 Rate of return to capital SR 5.5 3.5 4.2 4.8 4.5 5.4 4.4 4.8 5.6 5.1 6.0 8.3 7.0 3.4 2.8 4.2 1.9 3.2 3.0 4.7 5.1
DFQ
F3
LR 4.9 4.8 4.9 4.8 4.8 4.9 4.9 4.8 4.9 4.9 5.0 5.5 4.8 4.8 4.8 4.9 4.7 4.8 4.8 4.8 4.9
Source: Calculated from Simulation results PDDY = Paddy; GRNS = Grains; COMC = Commercial Crops; LIVS = Livestock; FORS = Forestry; RICE = Rice; FOOD = Other food; LEAT = Leather; JTEX = Jute textile; YARN = Yarn; TEXT = textile; WRMG = Woven ready-made garments; KRMG = Knit readymade garments; CHEM= chemicals and fertilizer; PETR = petroleum; OIND= other industries; CEMT = Cement; STEL = Steel; MACH =machinery; CNST= construction; SERV= services. SR and LR refer to years 2006 and 2020 respectively.
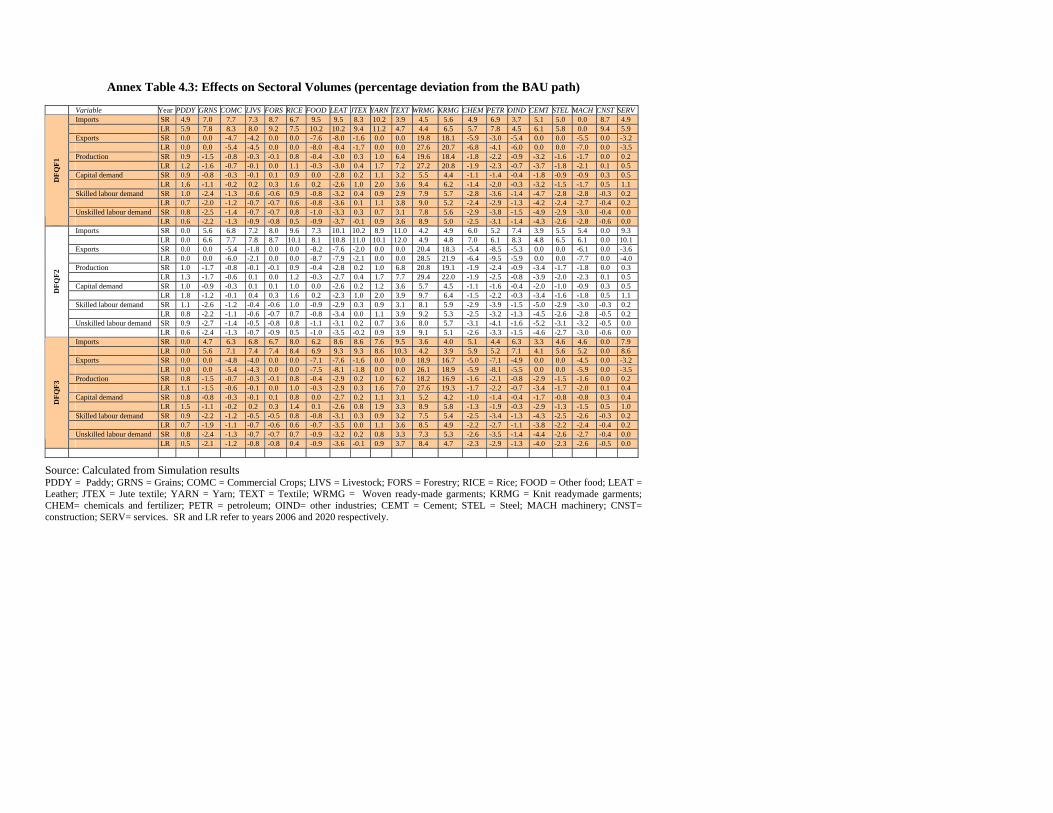
Annex Table 4.3: Effects on Sectoral Volumes (percentage deviation from the BAU path)
Variable Year PDDY GRNS COMC LIVS FORS RICE FOOD LEAT JTEX YARN TEXT WRMG KRMG CHEM PETR OIND CEMT STEL MACH CNST SERV Imports SR 4.9 7.0 7.7 7.3 8.7 6.7 9.5 9.5 8.3 10.2 3.9 4.5 5.6 4.9 6.9 3.7 5.1 5.0 0.0 8.7 4.9 LR 5.9 7.8 8.3 8.0 9.2 7.5 10.2 10.2 9.4 11.2 4.7 4.4 6.5 5.7 7.8 4.5 6.1 5.8 0.0 9.4 5.9 Exports SR 0.0 0.0 -4.7 -4.2 0.0 0.0 -7.6 -8.0 -1.6 0.0 0.0 19.8 18.1 -5.9 -3.0 -5.4 0.0 0.0 -5.5 0.0 -3.2 LR 0.0 0.0 -5.4 -4.5 0.0 0.0 -8.0 -8.4 -1.7 0.0 0.0 27.6 20.7 -6.8 -4.1 -6.0 0.0 0.0 -7.0 0.0 -3.5 Production SR 0.9 -1.5 -0.8 -0.3 -0.1 0.8 -0.4 -3.0 0.3 1.0 6.4 19.6 18.4 -1.8 -2.2 -0.9 -3.2 -1.6 -1.7 0.0 0.2 LR 1.2 -1.6 -0.7 -0.1 0.0 1.1 -0.3 -3.0 0.4 1.7 7.2 27.2 20.8 -1.9 -2.3 -0.7 -3.7 -1.8 -2.1 0.1 0.5 Capital demand SR 0.9 -0.8 -0.3 -0.1 0.1 0.9 0.0 -2.8 0.2 1.1 3.2 5.5 4.4 -1.1 -1.4 -0.4 -1.8 -0.9 -0.9 0.3 0.5 LR 1.6 -1.1 -0.2 0.2 0.3 1.6 0.2 -2.6 1.0 2.0 3.6 9.4 6.2 -1.4 -2.0 -0.3 -3.2 -1.5 -1.7 0.5 1.1 Skilled labour demand SR 1.0 -2.4 -1.3 -0.6 -0.6 0.9 -0.8 -3.2 0.4 0.9 2.9 7.9 5.7 -2.8 -3.6 -1.4 -4.7 -2.8 -2.8 -0.3 0.2 LR 0.7 -2.0 -1.2 -0.7 -0.7 0.6 -0.8 -3.6 0.1 1.1 3.8 9.0 5.2 -2.4 -2.9 -1.3 -4.2 -2.4 -2.7 -0.4 0.2 Unskilled labour demand SR 0.8 -2.5 -1.4 -0.7 -0.7 0.8 -1.0 -3.3 0.3 0.7 3.1 7.8 5.6 -2.9 -3.8 -1.5 -4.9 -2.9 -3.0 -0.4 0.0
DFQ
F1
LR 0.6 -2.2 -1.3 -0.9 -0.8 0.5 -0.9 -3.7 -0.1 0.9 3.6 8.9 5.0 -2.5 -3.1 -1.4 -4.3 -2.6 -2.8 -0.6 0.0 Imports SR 0.0 5.6 6.8 7.2 8.0 9.6 7.3 10.1 10.2 8.9 11.0 4.2 4.9 6.0 5.2 7.4 3.9 5.5 5.4 0.0 9.3 LR 0.0 6.6 7.7 7.8 8.7 10.1 8.1 10.8 11.0 10.1 12.0 4.9 4.8 7.0 6.1 8.3 4.8 6.5 6.1 0.0 10.1 Exports SR 0.0 0.0 -5.4 -1.8 0.0 0.0 -8.2 -7.6 -2.0 0.0 0.0 20.4 18.3 -5.4 -8.5 -5.3 0.0 0.0 -6.1 0.0 -3.6 LR 0.0 0.0 -6.0 -2.1 0.0 0.0 -8.7 -7.9 -2.1 0.0 0.0 28.5 21.9 -6.4 -9.5 -5.9 0.0 0.0 -7.7 0.0 -4.0 Production SR 1.0 -1.7 -0.8 -0.1 -0.1 0.9 -0.4 -2.8 0.2 1.0 6.8 20.8 19.1 -1.9 -2.4 -0.9 -3.4 -1.7 -1.8 0.0 0.3 LR 1.3 -1.7 -0.6 0.1 0.0 1.2 -0.3 -2.7 0.4 1.7 7.7 29.4 22.0 -1.9 -2.5 -0.8 -3.9 -2.0 -2.3 0.1 0.5 Capital demand SR 1.0 -0.9 -0.3 0.1 0.1 1.0 0.0 -2.6 0.2 1.2 3.6 5.7 4.5 -1.1 -1.6 -0.4 -2.0 -1.0 -0.9 0.3 0.5 LR 1.8 -1.2 -0.1 0.4 0.3 1.6 0.2 -2.3 1.0 2.0 3.9 9.7 6.4 -1.5 -2.2 -0.3 -3.4 -1.6 -1.8 0.5 1.1 Skilled labour demand SR 1.1 -2.6 -1.2 -0.4 -0.6 1.0 -0.9 -2.9 0.3 0.9 3.1 8.1 5.9 -2.9 -3.9 -1.5 -5.0 -2.9 -3.0 -0.3 0.2 LR 0.8 -2.2 -1.1 -0.6 -0.7 0.7 -0.8 -3.4 0.0 1.1 3.9 9.2 5.3 -2.5 -3.2 -1.3 -4.5 -2.6 -2.8 -0.5 0.2 Unskilled labour demand SR 0.9 -2.7 -1.4 -0.5 -0.8 0.8 -1.1 -3.1 0.2 0.7 3.6 8.0 5.7 -3.1 -4.1 -1.6 -5.2 -3.1 -3.2 -0.5 0.0
DFQ
F2
LR 0.6 -2.4 -1.3 -0.7 -0.9 0.5 -1.0 -3.5 -0.2 0.9 3.9 9.1 5.1 -2.6 -3.3 -1.5 -4.6 -2.7 -3.0 -0.6 0.0 Imports SR 0.0 4.7 6.3 6.8 6.7 8.0 6.2 8.6 8.6 7.6 9.5 3.6 4.0 5.1 4.4 6.3 3.3 4.6 4.6 0.0 7.9 LR 0.0 5.6 7.1 7.4 7.4 8.4 6.9 9.3 9.3 8.6 10.3 4.2 3.9 5.9 5.2 7.1 4.1 5.6 5.2 0.0 8.6 Exports SR 0.0 0.0 -4.8 -4.0 0.0 0.0 -7.1 -7.6 -1.6 0.0 0.0 18.9 16.7 -5.0 -7.1 -4.9 0.0 0.0 -4.5 0.0 -3.2 LR 0.0 0.0 -5.4 -4.3 0.0 0.0 -7.5 -8.1 -1.8 0.0 0.0 26.1 18.9 -5.9 -8.1 -5.5 0.0 0.0 -5.9 0.0 -3.5 Production SR 0.8 -1.5 -0.7 -0.3 -0.1 0.8 -0.4 -2.9 0.2 1.0 6.2 18.2 16.9 -1.6 -2.1 -0.8 -2.9 -1.5 -1.6 0.0 0.2 LR 1.1 -1.5 -0.6 -0.1 0.0 1.0 -0.3 -2.9 0.3 1.6 7.0 27.6 19.3 -1.7 -2.2 -0.7 -3.4 -1.7 -2.0 0.1 0.4 Capital demand SR 0.8 -0.8 -0.3 -0.1 0.1 0.8 0.0 -2.7 0.2 1.1 3.1 5.2 4.2 -1.0 -1.4 -0.4 -1.7 -0.8 -0.8 0.3 0.4 LR 1.5 -1.1 -0.2 0.2 0.3 1.4 0.1 -2.6 0.8 1.9 3.3 8.9 5.8 -1.3 -1.9 -0.3 -2.9 -1.3 -1.5 0.5 1.0 Skilled labour demand SR 0.9 -2.2 -1.2 -0.5 -0.5 0.8 -0.8 -3.1 0.3 0.9 3.2 7.5 5.4 -2.5 -3.4 -1.3 -4.3 -2.5 -2.6 -0.3 0.2 LR 0.7 -1.9 -1.1 -0.7 -0.6 0.6 -0.7 -3.5 0.0 1.1 3.6 8.5 4.9 -2.2 -2.7 -1.1 -3.8 -2.2 -2.4 -0.4 0.2 Unskilled labour demand SR 0.8 -2.4 -1.3 -0.7 -0.7 0.7 -0.9 -3.2 0.2 0.8 3.3 7.3 5.3 -2.6 -3.5 -1.4 -4.4 -2.6 -2.7 -0.4 0.0
DFQ
F3
LR 0.5 -2.1 -1.2 -0.8 -0.8 0.4 -0.9 -3.6 -0.1 0.9 3.7 8.4 4.7 -2.3 -2.9 -1.3 -4.0 -2.3 -2.6 -0.5 0.0
Source: Calculated from Simulation results PDDY = Paddy; GRNS = Grains; COMC = Commercial Crops; LIVS = Livestock; FORS = Forestry; RICE = Rice; FOOD = Other food; LEAT = Leather; JTEX = Jute textile; YARN = Yarn; TEXT = Textile; WRMG = Woven ready-made garments; KRMG = Knit readymade garments; CHEM= chemicals and fertilizer; PETR = petroleum; OIND= other industries; CEMT = Cement; STEL = Steel; MACH machinery; CNST= construction; SERV= services. SR and LR refer to years 2006 and 2020 respectively.
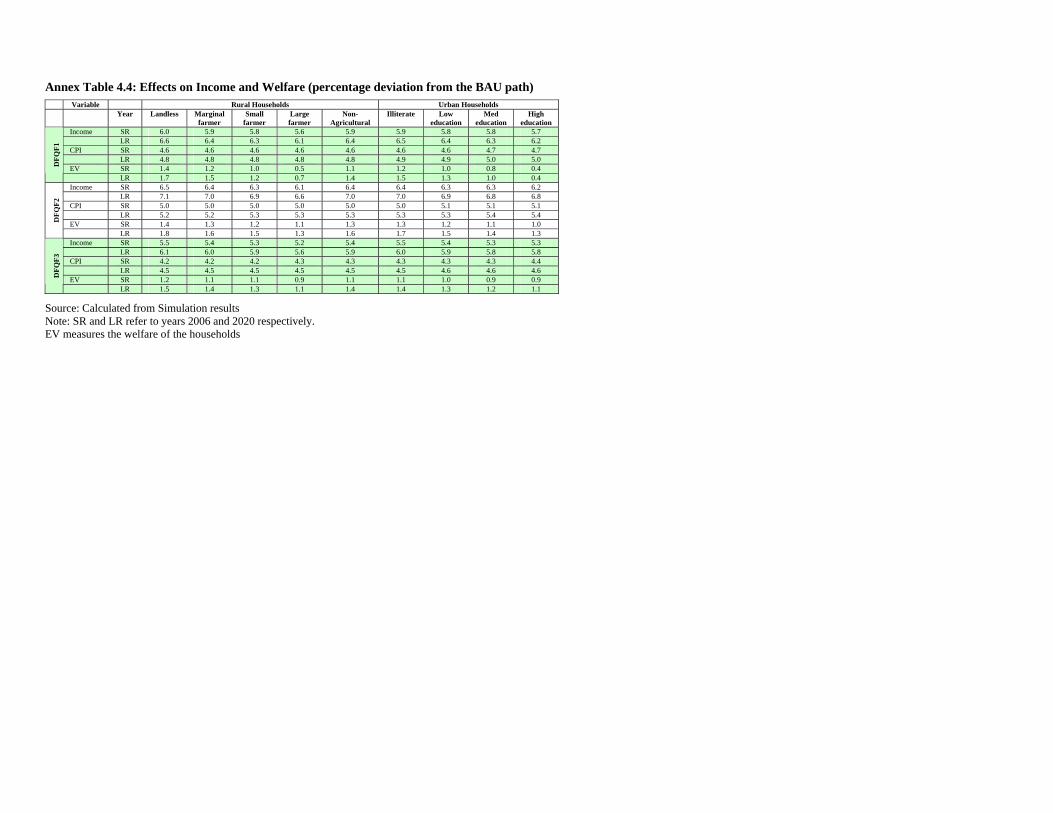
Annex Table 4.4: Effects on Income and Welfare (percentage deviation from the BAU path)
Variable Rural Households Urban Households Year Landless Marginal
farmer Small
farmer Large farmer
Non- Agricultural
Illiterate Low education
Med education
High education
Income SR 6.0 5.9 5.8 5.6 5.9 5.9 5.8 5.8 5.7 LR 6.6 6.4 6.3 6.1 6.4 6.5 6.4 6.3 6.2 CPI SR 4.6 4.6 4.6 4.6 4.6 4.6 4.6 4.7 4.7 LR 4.8 4.8 4.8 4.8 4.8 4.9 4.9 5.0 5.0 EV SR 1.4 1.2 1.0 0.5 1.1 1.2 1.0 0.8 0.4 D
FQF1
LR 1.7 1.5 1.2 0.7 1.4 1.5 1.3 1.0 0.4 Income SR 6.5 6.4 6.3 6.1 6.4 6.4 6.3 6.3 6.2 LR 7.1 7.0 6.9 6.6 7.0 7.0 6.9 6.8 6.8 CPI SR 5.0 5.0 5.0 5.0 5.0 5.0 5.1 5.1 5.1 LR 5.2 5.2 5.3 5.3 5.3 5.3 5.3 5.4 5.4 EV SR 1.4 1.3 1.2 1.1 1.3 1.3 1.2 1.1 1.0 D
FQF2
LR 1.8 1.6 1.5 1.3 1.6 1.7 1.5 1.4 1.3 Income SR 5.5 5.4 5.3 5.2 5.4 5.5 5.4 5.3 5.3 LR 6.1 6.0 5.9 5.6 5.9 6.0 5.9 5.8 5.8 CPI SR 4.2 4.2 4.2 4.3 4.3 4.3 4.3 4.3 4.4 LR 4.5 4.5 4.5 4.5 4.5 4.5 4.6 4.6 4.6 EV SR 1.2 1.1 1.1 0.9 1.1 1.1 1.0 0.9 0.9 D
FQF3
LR 1.5 1.4 1.3 1.1 1.4 1.4 1.3 1.2 1.1
Source: Calculated from Simulation results Note: SR and LR refer to years 2006 and 2020 respectively.
EV measures the welfare of the households
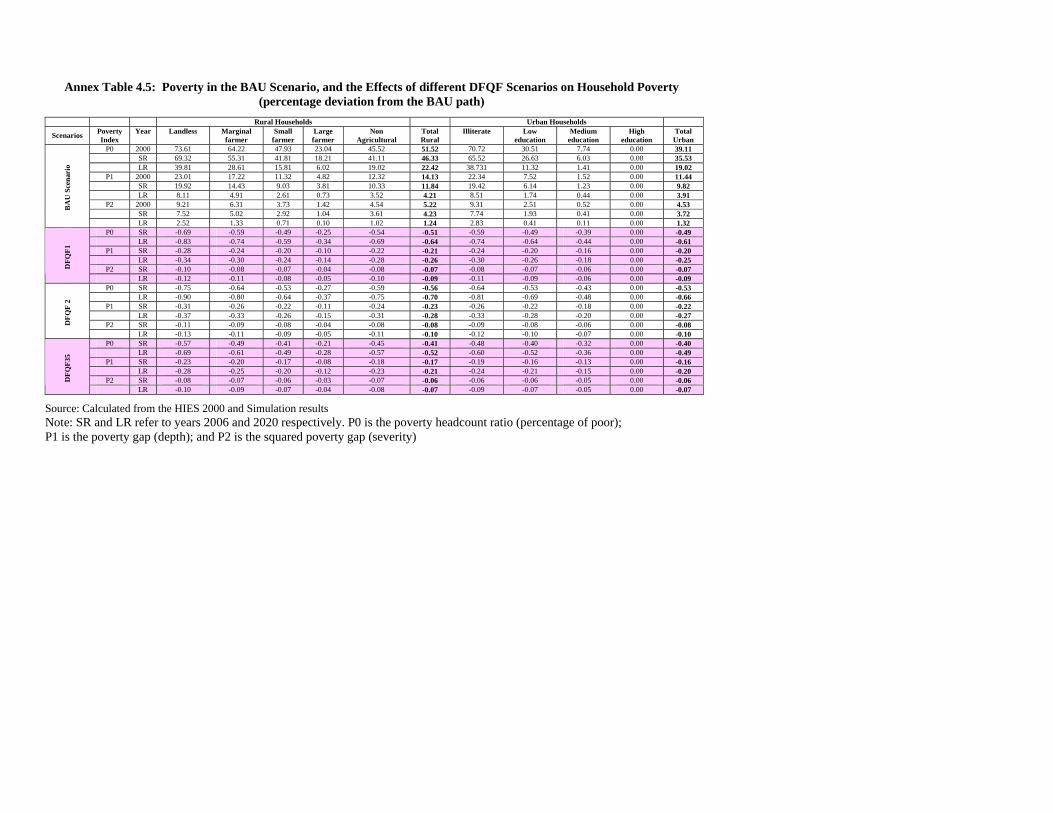
Annex Table 4.5: Poverty in the BAU Scenario, and the Effects of different DFQF Scenarios on Household Poverty (percentage deviation from the BAU path)
Rural Households Urban Households
Scenarios Poverty Index
Year Landless Marginal farmer
Small farmer
Large farmer
Non Agricultural
Total Rural
Illiterate Low education
Medium education
High education
Total Urban
P0 2000 73.61 64.22 47.93 23.04 45.52 51.52 70.72 30.51 7.74 0.00 39.11 SR 69.32 55.31 41.81 18.21 41.11 46.33 65.52 26.63 6.03 0.00 35.53 LR 39.81 28.61 15.81 6.02 19.02 22.42 38.731 11.32 1.41 0.00 19.02
P1 2000 23.01 17.22 11.32 4.82 12.32 14.13 22.34 7.52 1.52 0.00 11.44 SR 19.92 14.43 9.03 3.81 10.33 11.84 19.42 6.14 1.23 0.00 9.82 LR 8.11 4.91 2.61 0.73 3.52 4.21 8.51 1.74 0.44 0.00 3.91
P2 2000 9.21 6.31 3.73 1.42 4.54 5.22 9.31 2.51 0.52 0.00 4.53 SR 7.52 5.02 2.92 1.04 3.61 4.23 7.74 1.93 0.41 0.00 3.72
BA
U S
cena
rio
LR 2.52 1.33 0.71 0.10 1.02 1.24 2.83 0.41 0.11 0.00 1.32 P0 SR -0.69 -0.59 -0.49 -0.25 -0.54 -0.51 -0.59 -0.49 -0.39 0.00 -0.49
LR -0.83 -0.74 -0.59 -0.34 -0.69 -0.64 -0.74 -0.64 -0.44 0.00 -0.61 P1 SR -0.28 -0.24 -0.20 -0.10 -0.22 -0.21 -0.24 -0.20 -0.16 0.00 -0.20
LR -0.34 -0.30 -0.24 -0.14 -0.28 -0.26 -0.30 -0.26 -0.18 0.00 -0.25 P2 SR -0.10 -0.08 -0.07 -0.04 -0.08 -0.07 -0.08 -0.07 -0.06 0.00 -0.07 D
FQF1
LR -0.12 -0.11 -0.08 -0.05 -0.10 -0.09 -0.11 -0.09 -0.06 0.00 -0.09 P0 SR -0.75 -0.64 -0.53 -0.27 -0.59 -0.56 -0.64 -0.53 -0.43 0.00 -0.53
LR -0.90 -0.80 -0.64 -0.37 -0.75 -0.70 -0.81 -0.69 -0.48 0.00 -0.66 P1 SR -0.31 -0.26 -0.22 -0.11 -0.24 -0.23 -0.26 -0.22 -0.18 0.00 -0.22
LR -0.37 -0.33 -0.26 -0.15 -0.31 -0.28 -0.33 -0.28 -0.20 0.00 -0.27 P2 SR -0.11 -0.09 -0.08 -0.04 -0.08 -0.08 -0.09 -0.08 -0.06 0.00 -0.08 D
FQF
2
LR -0.13 -0.11 -0.09 -0.05 -0.11 -0.10 -0.12 -0.10 -0.07 0.00 -0.10 P0 SR -0.57 -0.49 -0.41 -0.21 -0.45 -0.41 -0.48 -0.40 -0.32 0.00 -0.40
LR -0.69 -0.61 -0.49 -0.28 -0.57 -0.52 -0.60 -0.52 -0.36 0.00 -0.49 P1 SR -0.23 -0.20 -0.17 -0.08 -0.18 -0.17 -0.19 -0.16 -0.13 0.00 -0.16
LR -0.28 -0.25 -0.20 -0.12 -0.23 -0.21 -0.24 -0.21 -0.15 0.00 -0.20 P2 SR -0.08 -0.07 -0.06 -0.03 -0.07 -0.06 -0.06 -0.06 -0.05 0.00 -0.06 D
FQF3
5
LR -0.10 -0.09 -0.07 -0.04 -0.08 -0.07 -0.09 -0.07 -0.05 0.00 -0.07
Source: Calculated from the HIES 2000 and Simulation results Note: SR and LR refer to years 2006 and 2020 respectively. P0 is the poverty headcount ratio (percentage of poor); P1 is the poverty gap (depth); and P2 is the squared poverty gap (severity)
CHAPTER FIVE
Selim Raihan, Abdur Razzaque and Rabeya Khatoon
WTO Negotiations on the Non-agricultural Market Access (NAMA): Implications for the Bangladesh Economy
5.1. Introduction WTO negotiations with respect to the non-agricultural commodities (all those are not covered under the negotiation on agriculture, sometimes referred to as industrial or, manufactured goods) centre around the enhancement of Non-Agricultural Market Access (NAMA), and are, therefore, proceeding towards the elimination or the reduction of bound tariff rates, bringing unbound tariff rates under binding commitments which will be subject to formula cuts, and identifying and removing Non-tariff Barriers (NTBs). The consensus on NAMA modalities, reached so far, include the use of a ‘Swiss-type’ formula for the reduction in the bound tariff rates, consideration of a non-linear mark up approach for establishing base rates of the unbound tariff rates, special and differential treatments for the developing countries in terms of allowing them ‘less than full reciprocity’ of commitments, and to keep LDCs above any commitment to undertake tariff cuts.
W T O N E G O T I A T I O N S O N T H E N O N - A G R I C U L T U R A L M A R K E T A C C E S S
( N A M A ) : I M P L I C A T I O N S F O R T H E B A N G L A D E S H E C O N O M Y
105It is, important to note that though the LDCs are exempted from
tariff cuts under the NAMA negotiations, they are likely to experience both positive and negative impacts on their economy if NAMA negotiations are implemented. On the positive side, because of tariff cuts by the developed and developing countries, LDCs are likely to have greater market access in many of these countries. However, on the negative side, LDCs may suffer from possible preference erosion in countries (for example in the EU) where they are currently enjoying duty-free and quota-free (DFQF) market access. As an LDC, Bangladesh is also concerned about these potential losses and gains.
Against these backdrops, this chapter tries to analyse the current status of the NAMA negotiations with respect to the types of the formula for industrial tariff cut and the possible impacts that the variants of existing formulas can have at the global and country level. In particular, this chapter explores the impacts of different NAMA negotiations on the economy of Bangladesh. In this regard, this study also estimates the possible extent of preference losses/gains for Bangladesh if NAMA negotiations are implemented. 5.2. Negotiations on NAMA: Background and the Current State of
Art Trade negotiations in the Uruguay Round, under the broad title of Non-agricultural Market Access (NAMA), achieved a progress in terms of reducing developed country’s average tariff rates from 6.3 percent to 3.8 percent, and an increase in developing country’s binding coverage from 21 percent to 73 percent. Under the ongoing Doha Round, the negotiations on NAMA incorporate the reduction or elimination of overall industrial tariff rates as well as the reduction or elimination of tariff peaks and tariff escalation, and also the removal of the non-tariff barriers (NTBs). In line with the work programmes, set in article 16 of the Doha Ministerial declaration, negotiations on NAMA were launched in January 2002 with the creation of a Negotiating Group on Market Access (NGMA). The sectors which should be covered for the formula approach for tariff reduction, as proposed by the NGMA in 2003, include (i) electronics and electrical goods, (ii) fish and fish products, (iii)
W T O A N D R E G I O N A L T R A D E N E G O T I A T I O N O U T C O M E S : Q U A N T I T A T I V E
A S S E S S M E N T S O F P O T E N T I A L I M P L I C A T I O N S O N B A N G L A D E S H
106 footwear, (iv) leather goods, (v) motor vehicle parts and components, (vi) stones, gems, and precious metals, and (vii) textiles and clothing.
The July 2004 package moved onward with a framework for establishing modalities for NAMA negotiations and the 6th Ministerial Declaration in Hong Kong in December 2005 set out the mandate to use a ‘Swiss type’ formula for the reduction in the bound tariff rates. However, there have been intense debates, and a number of proposals have been put in place with respect to the value and the number of coefficient used in the tariff-cut formula, and no consensus has yet been reached.
According to the July 2004 framework, NAMA tariff reduction should have comprehensive product coverage, should commence from bound rates, and all non-ad-valorem duties are to be converted to ad-valorem equivalents and to bind them in ad-valorem terms. Although the tariff reductions are to be on the bound tariff rates, the implication will have bearings on the applied rates too, as in most of the developed countries MFN applied tariffs and bound tariffs don’t have wide spreads for industrial commodities.
The rationale for applying a formula cut approach for tariff reduction includes the willingness of making the process transparent, efficient, equitable and predictable. There were intensive discussions among the member countries regarding the development of modalities as NAMA, and finally they reached a consensus on applying the formula approach, and the negotiation so far proceeded, the formula will be a ‘Swiss type with coefficients’.
One of the key features in the NAMA negotiations so far is that LDCs are exempted from taking any tariff cut initiative, rather LDCs are only ‘expected to increase their binding commitments substantially’. The July package proposed enhanced DFQF access provisions for non-agricultural products originating from the LDCs to counterattack the effects of tariff cuts by the developed and developing countries. On the other hand, for the developing countries, the differential treatment has been set out with flexibilities in terms of:
(a) applying less than formula cuts to up to 10 percent of the tariff lines provided that the cuts are no less than half the formula cuts and that these tariff lines do not exceed 10 percent of the total value of a Member's imports; or
W T O N E G O T I A T I O N S O N T H E N O N - A G R I C U L T U R A L M A R K E T A C C E S S
( N A M A ) : I M P L I C A T I O N S F O R T H E B A N G L A D E S H E C O N O M Y
107b) keeping, as an exception, tariff lines unbound, or not applying
formula cuts for up to 5 percent of tariff lines provided they do not exceed 5 percent of the total value of a Member's imports’.
Additionally, participants with a binding coverage of non-
agricultural tariff lines of less than 35 percent are considered to be exempted from tariff cuts and are expected to increase binding coverage to 100 percent. (Annex B-8, July 2004 modalities).
5.3. The Tariff Cut Formulas
The Hong Kong Ministerial Declaration has specified the mandate to apply a ‘Swiss formula with coefficients’ for tariff cut under NAMA negotiations. Before the declaration, the negotiation evolved around some linear formulas with single or multiple coefficients, as well as some tiered and non-linear formulas with constant and multiple coefficients, proposed by different countries and country-groups. India, at the initial stage of the negotiation, proposed a linear formula with two coefficients: 50 percent tariff cut for the developed countries and 33 percent cut for the developing countries. China proposed a non-linear formula with variable coefficients dependent on the simple average of the base rates, The proposal by the USA incorporated a non-linear formula applicable in two phases: in phase one (2005 – 2010), tariffs of 5 percent or below would be eliminated and tariffs above 5 percent are subject to a Swiss formula, and in phase two (2010- 2015), tariffs will be brought to zero using a linear cut formula. The European Commission proposal was to reduce all tariffs and their dispersion by compressing them into a range- influential enough in reducing peak tariffs and tariff escalation. Finally, the Korean proposal suggested a linear cut formula depending upon the trade weighted average. Afterward, there have been a number of proposals by some group of countries which suggested some modifications of the original Swiss formula with constant coefficient (box 5.1, equation 1). The proposal by US, and Norway suggested the application of fixed number of two coefficients to the Swiss formula (box 5.1, equation 2). However, Chile, Columbia and Mexico proposed the use of four coefficients in the same formula. The March 2005, Argentina, Brazil and India (ABI formula) suggested incorporating the tariff average in the multiple coefficient Swiss formula. Finally, the
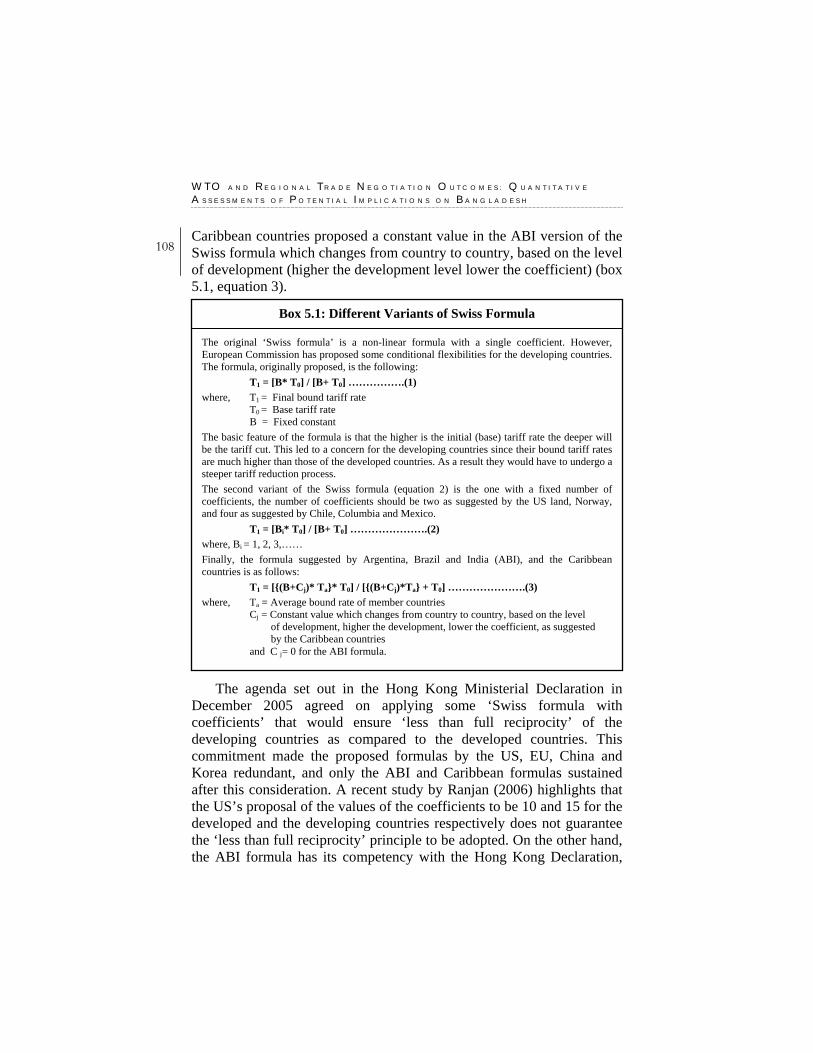
W T O A N D R E G I O N A L T R A D E N E G O T I A T I O N O U T C O M E S : Q U A N T I T A T I V E
A S S E S S M E N T S O F P O T E N T I A L I M P L I C A T I O N S O N B A N G L A D E S H
108 Caribbean countries proposed a constant value in the ABI version of the Swiss formula which changes from country to country, based on the level of development (higher the development level lower the coefficient) (box 5.1, equation 3).
The agenda set out in the Hong Kong Ministerial Declaration in December 2005 agreed on applying some ‘Swiss formula with coefficients’ that would ensure ‘less than full reciprocity’ of the developing countries as compared to the developed countries. This commitment made the proposed formulas by the US, EU, China and Korea redundant, and only the ABI and Caribbean formulas sustained after this consideration. A recent study by Ranjan (2006) highlights that the US’s proposal of the values of the coefficients to be 10 and 15 for the developed and the developing countries respectively does not guarantee the ‘less than full reciprocity’ principle to be adopted. On the other hand, the ABI formula has its competency with the Hong Kong Declaration,
Box 5.1: Different Variants of Swiss Formula The original ‘Swiss formula’ is a non-linear formula with a single coefficient. However, European Commission has proposed some conditional flexibilities for the developing countries. The formula, originally proposed, is the following:
T1 = [B* T0] / [B+ T0] …………….(1)
where, T1 = Final bound tariff rate T0 = Base tariff rate B = Fixed constant
The basic feature of the formula is that the higher is the initial (base) tariff rate the deeper will be the tariff cut. This led to a concern for the developing countries since their bound tariff rates are much higher than those of the developed countries. As a result they would have to undergo a steeper tariff reduction process.
The second variant of the Swiss formula (equation 2) is the one with a fixed number of coefficients, the number of coefficients should be two as suggested by the US land, Norway, and four as suggested by Chile, Columbia and Mexico.
T1 = [Bi* T0] / [B+ T0] ………………….(2)
where, Bi = 1, 2, 3,……
Finally, the formula suggested by Argentina, Brazil and India (ABI), and the Caribbean countries is as follows:
T1 = [{(B+Cj)* Ta}* T0] / [{(B+Cj)*Ta} + T0] ………………….(3)
where, Ta = Average bound rate of member countries Cj = Constant value which changes from country to country, based on the level of development, higher the development, lower the coefficient, as suggested by the Caribbean countries
and C j= 0 for the ABI formula.
W T O N E G O T I A T I O N S O N T H E N O N - A G R I C U L T U R A L M A R K E T A C C E S S
( N A M A ) : I M P L I C A T I O N S F O R T H E B A N G L A D E S H E C O N O M Y
109and in addition to this, the use of average tariff rates as coefficients allows the existing tariff structure being taken into account in designing the new tariff structure, and therefore, sounds more realistic and adaptable. Furthermore, the Caribbean formula incorporates the internal need for tariff in a country in terms of a source of revenue and domestic protection, and therefore, in addition to the ABI formula, can be considered for negotiation. 5.4. The Concerns over Possible Preference Erosion for LDCs. The general rule of the WTO is to apply agreements on a non-discriminatory basis among countries (the Most Favoured Nation provision). However, from the broader development perspectives WTO negotiations allow the developing and the least developed countries some special and differential treatment (S&DT) with respect to the degree of trade liberalisation and market access facilities. In terms of tariffs, the preferential provision is that for developing and the LDCs products, the developed country markets allow less than MFN tariff facilities and therefore there arises a preferential margin between the two rates. In European Union market, under ‘Generalized System of Preference (GSP)’ and Everything-But-Arms (EBA) provisions, commodities originating from LDCs enjoy zero tariff market access. However, the limiting factor is the Rules of Origin (RoO) requirements, i.e. to take advantage of the zero tariff facility, a certain level of domestic value addition is required. Among some other non-reciprocal preferential trading arrangements for developing and least developed countries, there are the Caribbean Basin Trade Partnership Act, the Andean Trade Promotion and Drug Eradication Act, the African Growth and Opportunity Act (U.S.); and the Cotonou convention (EU) (Boxes 5.2 and 5.3).
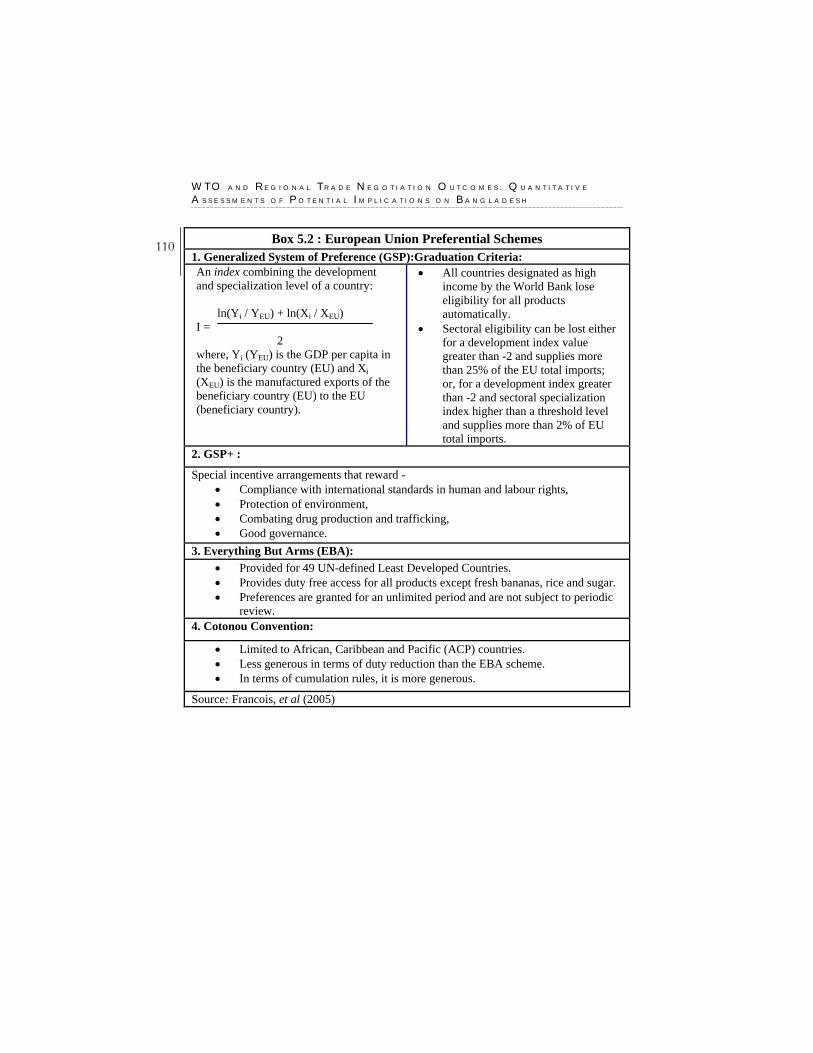
W T O A N D R E G I O N A L T R A D E N E G O T I A T I O N O U T C O M E S : Q U A N T I T A T I V E
A S S E S S M E N T S O F P O T E N T I A L I M P L I C A T I O N S O N B A N G L A D E S H
110 Box 5.2 : European Union Preferential Schemes 1. Generalized System of Preference (GSP):Graduation Criteria: An index combining the development and specialization level of a country: ln(Yi / YEU) + ln(Xi / XEU) I = 2 where, Yi (YEU) is the GDP per capita in the beneficiary country (EU) and Xi (XEU) is the manufactured exports of the beneficiary country (EU) to the EU (beneficiary country).
• All countries designated as high income by the World Bank lose eligibility for all products automatically.
• Sectoral eligibility can be lost either for a development index value greater than -2 and supplies more than 25% of the EU total imports; or, for a development index greater than -2 and sectoral specialization index higher than a threshold level and supplies more than 2% of EU total imports.
2. GSP+ :
Special incentive arrangements that reward - • Compliance with international standards in human and labour rights, • Protection of environment, • Combating drug production and trafficking, • Good governance.
3. Everything But Arms (EBA): • Provided for 49 UN-defined Least Developed Countries. • Provides duty free access for all products except fresh bananas, rice and sugar. • Preferences are granted for an unlimited period and are not subject to periodic
review. 4. Cotonou Convention:
• Limited to African, Caribbean and Pacific (ACP) countries. • Less generous in terms of duty reduction than the EBA scheme. • In terms of cumulation rules, it is more generous.
Source: Francois, et al (2005)
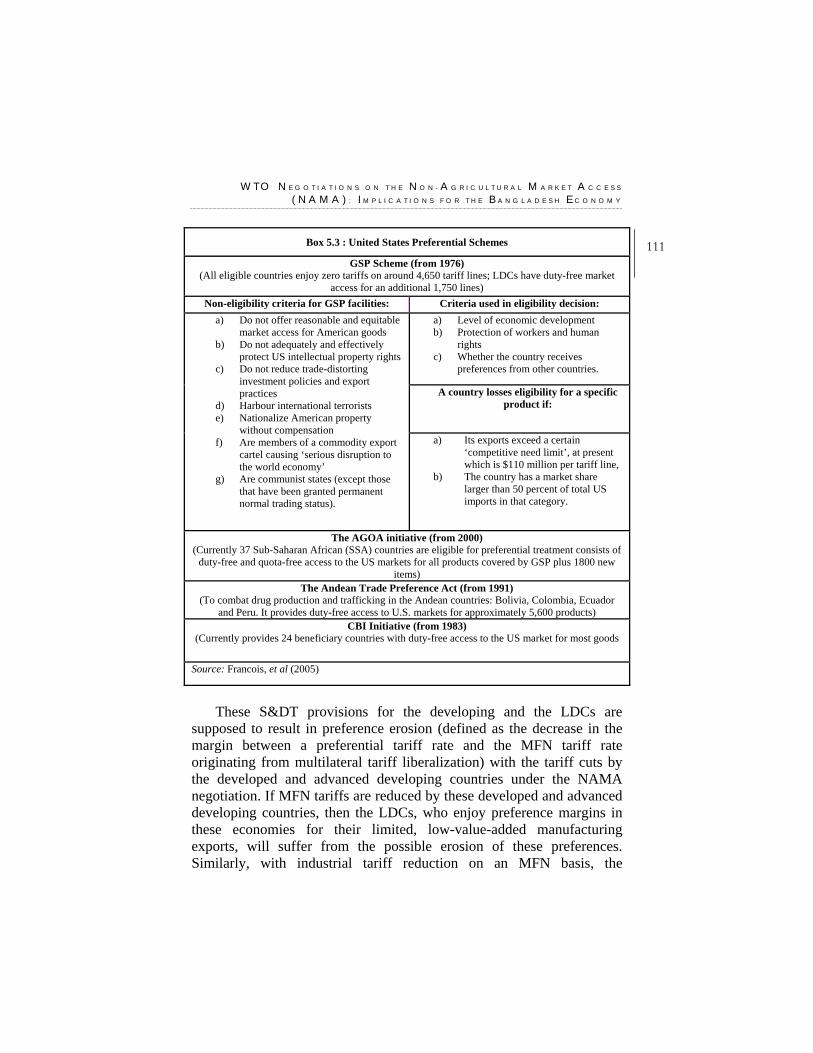
W T O N E G O T I A T I O N S O N T H E N O N - A G R I C U L T U R A L M A R K E T A C C E S S
( N A M A ) : I M P L I C A T I O N S F O R T H E B A N G L A D E S H E C O N O M Y
111Box 5.3 : United States Preferential Schemes
GSP Scheme (from 1976) (All eligible countries enjoy zero tariffs on around 4,650 tariff lines; LDCs have duty-free market
access for an additional 1,750 lines) Non-eligibility criteria for GSP facilities: Criteria used in eligibility decision:
a) Level of economic development b) Protection of workers and human
rights c) Whether the country receives
preferences from other countries.
A country losses eligibility for a specific product if:
a) Do not offer reasonable and equitable market access for American goods
b) Do not adequately and effectively protect US intellectual property rights
c) Do not reduce trade-distorting investment policies and export practices
d) Harbour international terrorists e) Nationalize American property
without compensation f) Are members of a commodity export
cartel causing ‘serious disruption to the world economy’
g) Are communist states (except those that have been granted permanent normal trading status).
a) Its exports exceed a certain ‘competitive need limit’, at present which is $110 million per tariff line,
b) The country has a market share larger than 50 percent of total US imports in that category.
The AGOA initiative (from 2000) (Currently 37 Sub-Saharan African (SSA) countries are eligible for preferential treatment consists of
duty-free and quota-free access to the US markets for all products covered by GSP plus 1800 new items)
The Andean Trade Preference Act (from 1991) (To combat drug production and trafficking in the Andean countries: Bolivia, Colombia, Ecuador
and Peru. It provides duty-free access to U.S. markets for approximately 5,600 products) CBI Initiative (from 1983)
(Currently provides 24 beneficiary countries with duty-free access to the US market for most goods
Source: Francois, et al (2005)
These S&DT provisions for the developing and the LDCs are
supposed to result in preference erosion (defined as the decrease in the margin between a preferential tariff rate and the MFN tariff rate originating from multilateral tariff liberalization) with the tariff cuts by the developed and advanced developing countries under the NAMA negotiation. If MFN tariffs are reduced by these developed and advanced developing countries, then the LDCs, who enjoy preference margins in these economies for their limited, low-value-added manufacturing exports, will suffer from the possible erosion of these preferences. Similarly, with industrial tariff reduction on an MFN basis, the
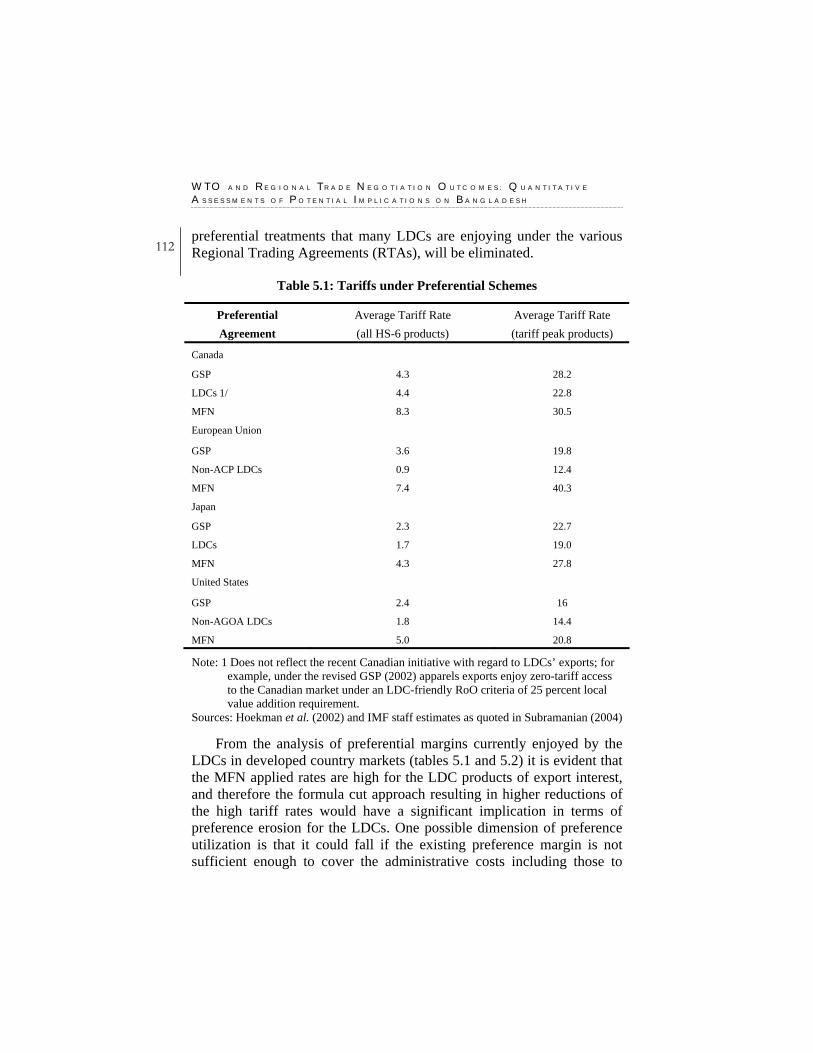
W T O A N D R E G I O N A L T R A D E N E G O T I A T I O N O U T C O M E S : Q U A N T I T A T I V E
A S S E S S M E N T S O F P O T E N T I A L I M P L I C A T I O N S O N B A N G L A D E S H
112 preferential treatments that many LDCs are enjoying under the various Regional Trading Agreements (RTAs), will be eliminated.
Table 5.1: Tariffs under Preferential Schemes
Preferential Agreement
Average Tariff Rate (all HS-6 products)
Average Tariff Rate (tariff peak products)
Canada
GSP 4.3 28.2
LDCs 1/ 4.4 22.8
MFN 8.3 30.5
European Union
GSP 3.6 19.8
Non-ACP LDCs 0.9 12.4
MFN 7.4 40.3
Japan
GSP 2.3 22.7
LDCs 1.7 19.0
MFN 4.3 27.8
United States
GSP 2.4 16
Non-AGOA LDCs 1.8 14.4
MFN 5.0 20.8
Note: 1 Does not reflect the recent Canadian initiative with regard to LDCs’ exports; for example, under the revised GSP (2002) apparels exports enjoy zero-tariff access to the Canadian market under an LDC-friendly RoO criteria of 25 percent local value addition requirement.
Sources: Hoekman et al. (2002) and IMF staff estimates as quoted in Subramanian (2004)
From the analysis of preferential margins currently enjoyed by the LDCs in developed country markets (tables 5.1 and 5.2) it is evident that the MFN applied rates are high for the LDC products of export interest, and therefore the formula cut approach resulting in higher reductions of the high tariff rates would have a significant implication in terms of preference erosion for the LDCs. One possible dimension of preference utilization is that it could fall if the existing preference margin is not sufficient enough to cover the administrative costs including those to
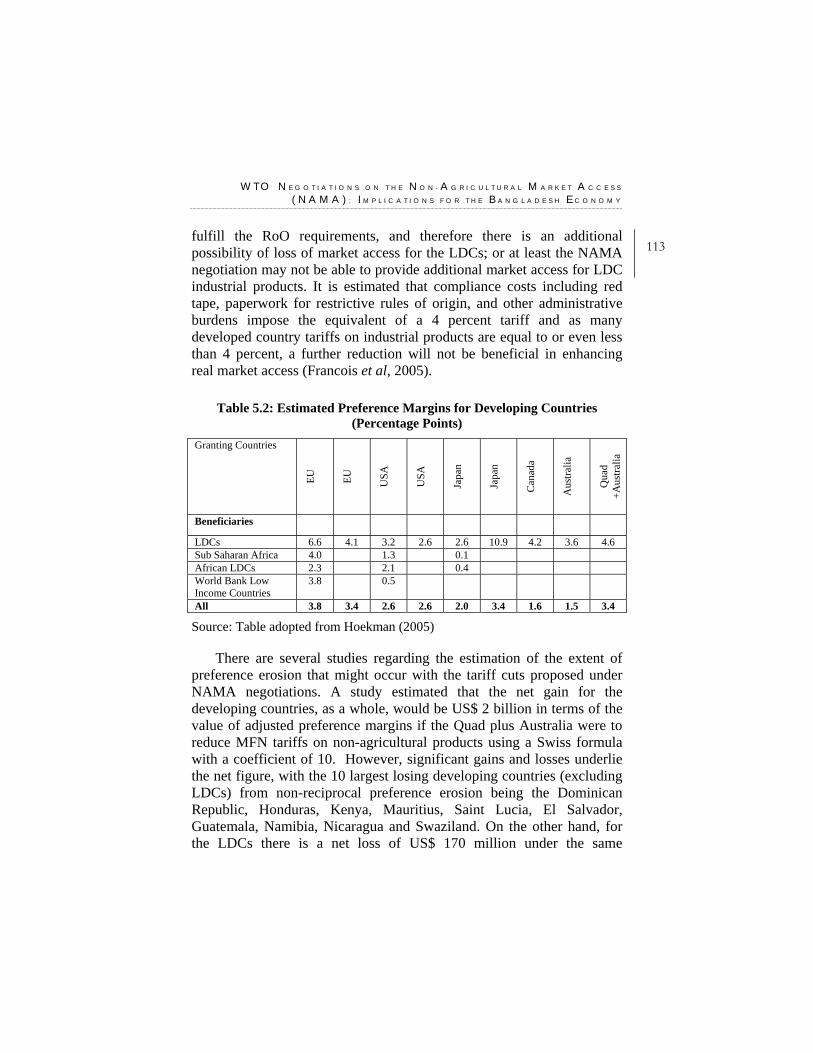
W T O N E G O T I A T I O N S O N T H E N O N - A G R I C U L T U R A L M A R K E T A C C E S S
( N A M A ) : I M P L I C A T I O N S F O R T H E B A N G L A D E S H E C O N O M Y
113fulfill the RoO requirements, and therefore there is an additional possibility of loss of market access for the LDCs; or at least the NAMA negotiation may not be able to provide additional market access for LDC industrial products. It is estimated that compliance costs including red tape, paperwork for restrictive rules of origin, and other administrative burdens impose the equivalent of a 4 percent tariff and as many developed country tariffs on industrial products are equal to or even less than 4 percent, a further reduction will not be beneficial in enhancing real market access (Francois et al, 2005).
Table 5.2: Estimated Preference Margins for Developing Countries (Percentage Points)
Granting Countries
EU
EU
USA
USA
Japa
n
Japa
n
Can
ada
Aus
tralia
Qua
d +A
ustra
lia
Beneficiaries
LDCs 6.6 4.1 3.2 2.6 2.6 10.9 4.2 3.6 4.6
Sub Saharan Africa 4.0 1.3 0.1 African LDCs 2.3 2.1 0.4 World Bank Low Income Countries
3.8 0.5
All 3.8 3.4 2.6 2.6 2.0 3.4 1.6 1.5 3.4
Source: Table adopted from Hoekman (2005)
There are several studies regarding the estimation of the extent of preference erosion that might occur with the tariff cuts proposed under NAMA negotiations. A study estimated that the net gain for the developing countries, as a whole, would be US$ 2 billion in terms of the value of adjusted preference margins if the Quad plus Australia were to reduce MFN tariffs on non-agricultural products using a Swiss formula with a coefficient of 10. However, significant gains and losses underlie the net figure, with the 10 largest losing developing countries (excluding LDCs) from non-reciprocal preference erosion being the Dominican Republic, Honduras, Kenya, Mauritius, Saint Lucia, El Salvador, Guatemala, Namibia, Nicaragua and Swaziland. On the other hand, for the LDCs there is a net loss of US$ 170 million under the same
W T O A N D R E G I O N A L T R A D E N E G O T I A T I O N O U T C O M E S : Q U A N T I T A T I V E
A S S E S S M E N T S O F P O T E N T I A L I M P L I C A T I O N S O N B A N G L A D E S H
114 liberalization scenario, where only two LDCs, Nepal and Maldives, experience a gain (Low et al, 2005).
In terms of preferential market access provisions and utilization, the European Union market has been considered as the most significant by almost all relevant studies. The zero tariff facilities provided under the Everything But Arms (EBA) provision in EU for developing and least developed countries allow them to enjoy preferential treatment and therefore MFN liberalization may make them vulnerable to preference erosion. However, the assessment of vulnerability to preference erosion in terms of preference utilization rate identified 33 countries including only 11 LDCs, and 21 sectors as vulnerable to preference erosion in the EU market (Curran et al, 2006). The study highlighted clothing as the most affected sector for the LDCs.
A study on Bangladesh by Rahman and Shadat (2006), using the estimation of preference margins and utilization of preferences methodology, estimated the amount of preference erosion under different scenarios of Swiss formula tariff cuts in the EU market. Bangladesh, like any other LDCs, will face two opposite directional effects – one due to Swiss formula tariff cut under NAMA (LDCs being exempted), and the other with MFN tariff reduction, where the former will result in preference erosion and the latter to some recovery. The study estimated the net preference erosion taking into account both the effects. For Example, with a Swiss coefficient of 0.3, net preference erosion on all products is US$ 53 million; if the value of the coefficient is 0.5, net preference erosion is US$ 316.8 million, and if the coefficient is taken to be 0.8, the preference erosion amounted to be US$ 24.3 million. Again, disaggregated estimate for woven and knit RMG exports from Bangladesh reveals the fact that due to non-compliance with the RoO requirements, there will be net preference gain in the woven RMG sector, whereas for the knit RMG sector, which is now enjoying almost 90 percent of the GSP facilities, net preference erosion will outperform the gains. Similar simulation exercises for the USA market show that import tariffs on Bangladeshi commodities will be reduced by US$ 122.9 million, US$ 87.8 million and US$ 61.4 million with 0.3, 0.5 and 0.8 Swiss formula coefficients respectively, since Bangladesh is not enjoying zero tariff facilities for her principal (RMG) exports to USA. However, the problem with this methodology is that it is a partial equilibrium method and thus fails to take into account the general equilibrium effects,
W T O N E G O T I A T I O N S O N T H E N O N - A G R I C U L T U R A L M A R K E T A C C E S S
( N A M A ) : I M P L I C A T I O N S F O R T H E B A N G L A D E S H E C O N O M Y
115and the estimation uses the impact of tariff reduction on aggregate tariffs payable, without taking into consideration the resulting terms of trade shocks, and thereby changes in international demand for Bangladeshi commodities. Moreover, the study is based only on the RMG exports and preference utilization rates are assumed to remain constant.
Based on an econometric assessment of actual preference utilisation the estimates of preference erosion in the EU market for the LDCs and low income countries by Francois et at (2005) suggest an income gain of US$ 222.5 million in total. Bangladesh accounts for also a loss of US$ 101 million and African LDCs suffer for a loss of US$ 458.3 million. For low income countries like India, there is a positive income effect of US$ 174 million. The magnitude of loss is showever reduced substantially if all OECD countries reduce MFN tariff rates. This is because EU has been the most aggressive in giving preferential facilities as a development initiative. Again, being adjusted for the compliance costs including administrative costs and costs for fulfilling RoO requirements, the magnitude, and even in some cases, the direction of the income effect due to preference erosion is changed. For example, for Bangladesh, the loss is reduced to US$ 77.2 million from US$ 101 million, for India for the there is a substantial increase to US$ 267.9 million, and for African LDCs the huge negative figure turns out to be slightly positive.
All the study findings so far, conclude the possibility of preference erosion for the LDCs. Therefore, as a part of the NAMA negotiation, various proposals have surfaced to address the issue of preference erosion, including:
• The formation of a “competitiveness fund” or other development assistance so that countries affected by preference erosion can undertake adjustment programs; and this is considered as one of the basis for ‘Aid for Trade’ facilitation.
• To add a “correction coefficient” which is expected to improve margins of preference for products that enjoy nonreciprocal preferential access at present, along with longer staging for these products to preserve the margin of preference.
• There can be delayed or gradual reduction of tariffs on products that have significant export activity and margins of preference.
W T O A N D R E G I O N A L T R A D E N E G O T I A T I O N O U T C O M E S : Q U A N T I T A T I V E
A S S E S S M E N T S O F P O T E N T I A L I M P L I C A T I O N S O N B A N G L A D E S H
116 • An ‘index of vulnerability’ is proposed to be developed in order
to identify products of special concern to particular countries, especially LDCs.
• Among the ‘trade solutions’ to preference erosion, there can be multilateral trade concession schemes designed to protect the preference dependent countries, and
• Compensation of preference erosion through preferences in other countries.
5.5. Welfare Effects and Preference Erosion of Bangladesh for
NAMA Scenarios: Estimates from the GTAP Model The shortcomings of the partial equilibrium method in estimating the preference erosion and the welfare effects of the NAMA negotiations on the LDCs lead us to explore the general equilibrium method. The GTAP based global general equilibrium model helps us to estimate the actual welfare loss/gain and the preference erosion or export market gains in a holistic framework and it takes into action the interlinkages among different sectors and different countries in the world. The methods of the GTAP model are discussed in details in chapter 2 of this volume. 5.5.1. GTAP Simulation Design for Different NAMA Scenarios Table 5.3 presents two NAMA scenarios which have been simulated in the GTAP model. In order to explore the effects of the implementation of a full NAMA negotiation we consider NAMA1 where all developed and developing countries eliminate their tariffs on non-agricultural commodities by 100 percent. This scenario helps us to understand the maximum effects that a NAMA negotiation can have on different economies.
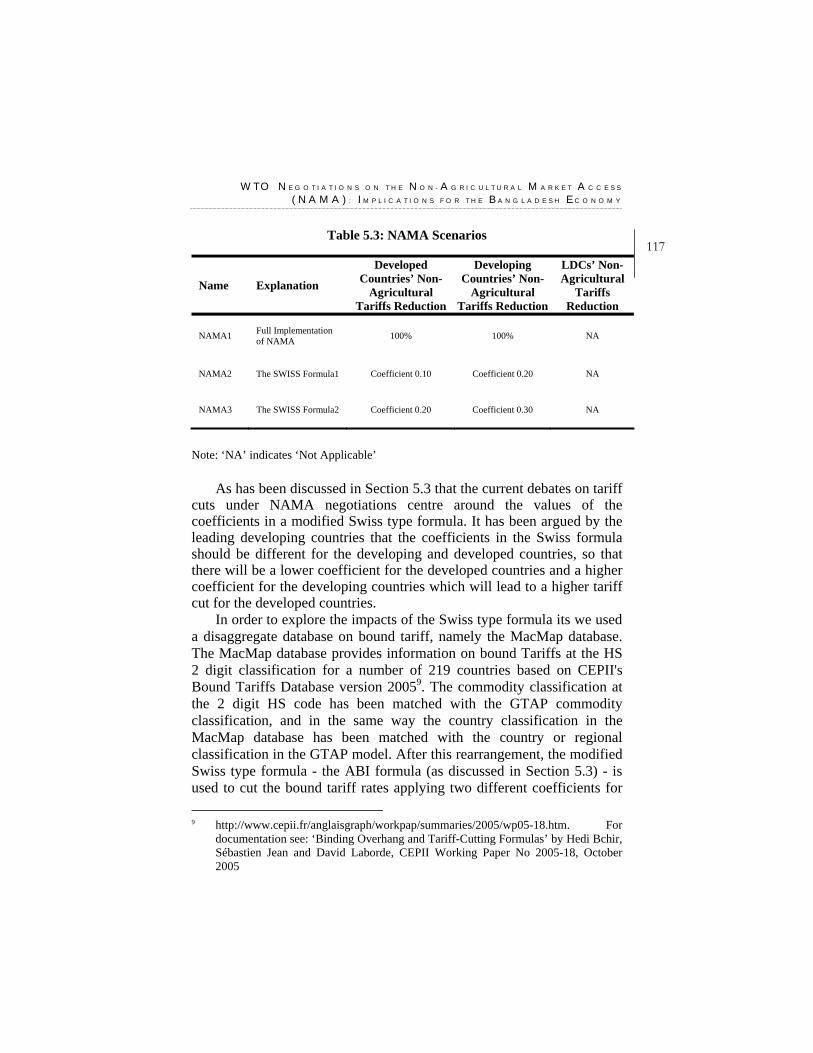
W T O N E G O T I A T I O N S O N T H E N O N - A G R I C U L T U R A L M A R K E T A C C E S S
( N A M A ) : I M P L I C A T I O N S F O R T H E B A N G L A D E S H E C O N O M Y
117Table 5.3: NAMA Scenarios
Name Explanation
Developed Countries’ Non-
Agricultural Tariffs Reduction
Developing Countries’ Non-
Agricultural Tariffs Reduction
LDCs’ Non-Agricultural
Tariffs Reduction
NAMA1 Full Implementation of NAMA 100% 100% NA
NAMA2 The SWISS Formula1
Coefficient 0.10 Coefficient 0.20 NA
NAMA3 The SWISS Formula2 Coefficient 0.20 Coefficient 0.30 NA
Note: ‘NA’ indicates ‘Not Applicable’
As has been discussed in Section 5.3 that the current debates on tariff cuts under NAMA negotiations centre around the values of the coefficients in a modified Swiss type formula. It has been argued by the leading developing countries that the coefficients in the Swiss formula should be different for the developing and developed countries, so that there will be a lower coefficient for the developed countries and a higher coefficient for the developing countries which will lead to a higher tariff cut for the developed countries.
In order to explore the impacts of the Swiss type formula its we used a disaggregate database on bound tariff, namely the MacMap database. The MacMap database provides information on bound Tariffs at the HS 2 digit classification for a number of 219 countries based on CEPII's Bound Tariffs Database version 20059. The commodity classification at the 2 digit HS code has been matched with the GTAP commodity classification, and in the same way the country classification in the MacMap database has been matched with the country or regional classification in the GTAP model. After this rearrangement, the modified Swiss type formula - the ABI formula (as discussed in Section 5.3) - is used to cut the bound tariff rates applying two different coefficients for 9 http://www.cepii.fr/anglaisgraph/workpap/summaries/2005/wp05-18.htm. For
documentation see: ‘Binding Overhang and Tariff-Cutting Formulas’ by Hedi Bchir, Sébastien Jean and David Laborde, CEPII Working Paper No 2005-18, October 2005
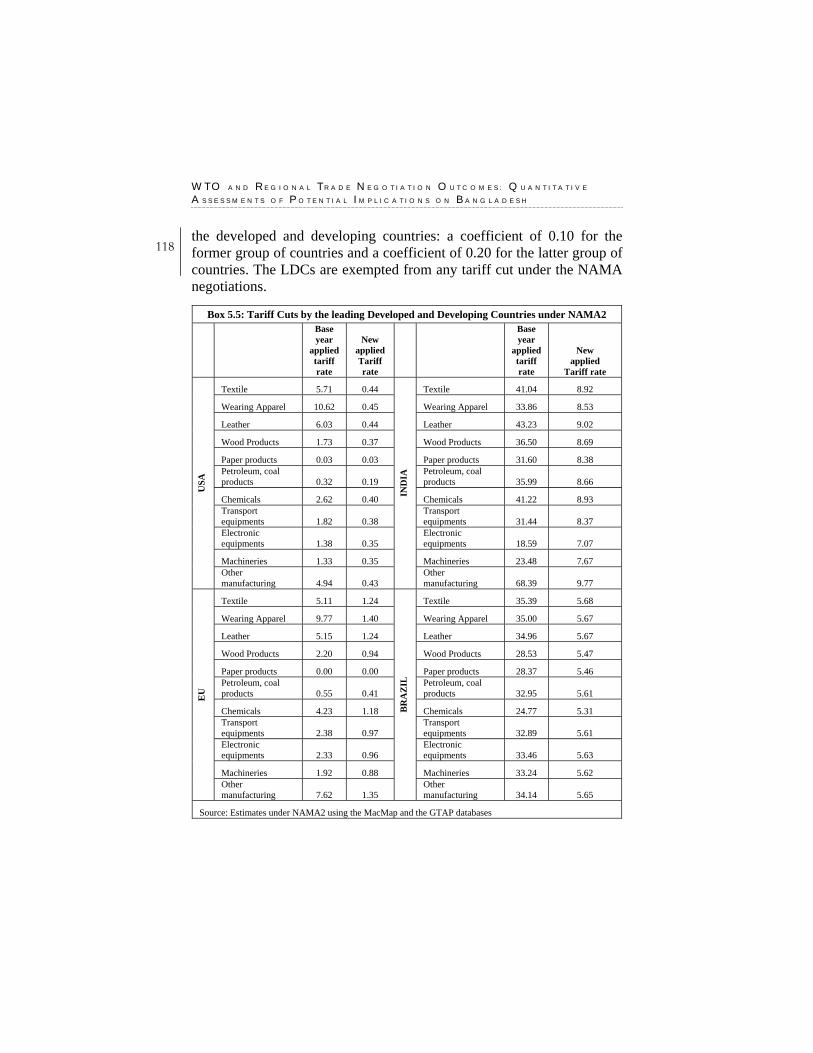
W T O A N D R E G I O N A L T R A D E N E G O T I A T I O N O U T C O M E S : Q U A N T I T A T I V E
A S S E S S M E N T S O F P O T E N T I A L I M P L I C A T I O N S O N B A N G L A D E S H
118 the developed and developing countries: a coefficient of 0.10 for the former group of countries and a coefficient of 0.20 for the latter group of countries. The LDCs are exempted from any tariff cut under the NAMA negotiations.
Box 5.5: Tariff Cuts by the leading Developed and Developing Countries under NAMA2
Base year
applied tariff rate
New applied Tariff rate
Base year
applied tariff rate
New applied
Tariff rate
Textile 5.71 0.44 Textile 41.04 8.92
Wearing Apparel 10.62 0.45 Wearing Apparel 33.86 8.53
Leather 6.03 0.44 Leather 43.23 9.02
Wood Products 1.73 0.37 Wood Products 36.50 8.69
Paper products 0.03 0.03 Paper products 31.60 8.38 Petroleum, coal products 0.32 0.19
Petroleum, coal products 35.99 8.66
Chemicals 2.62 0.40 Chemicals 41.22 8.93 Transport equipments 1.82 0.38
Transport equipments 31.44 8.37
Electronic equipments 1.38 0.35
Electronic equipments 18.59 7.07
Machineries 1.33 0.35 Machineries 23.48 7.67
USA
Other manufacturing 4.94 0.43
IND
IA
Other manufacturing 68.39 9.77
Textile 5.11 1.24 Textile 35.39 5.68
Wearing Apparel 9.77 1.40 Wearing Apparel 35.00 5.67
Leather 5.15 1.24 Leather 34.96 5.67
Wood Products 2.20 0.94 Wood Products 28.53 5.47
Paper products 0.00 0.00 Paper products 28.37 5.46 Petroleum, coal products 0.55 0.41
Petroleum, coal products 32.95 5.61
Chemicals 4.23 1.18 Chemicals 24.77 5.31 Transport equipments 2.38 0.97
Transport equipments 32.89 5.61
Electronic equipments 2.33 0.96
Electronic equipments 33.46 5.63
Machineries 1.92 0.88 Machineries 33.24 5.62
EU
Other manufacturing 7.62 1.35
BR
AZ
IL
Other manufacturing 34.14 5.65
Source: Estimates under NAMA2 using the MacMap and the GTAP databases
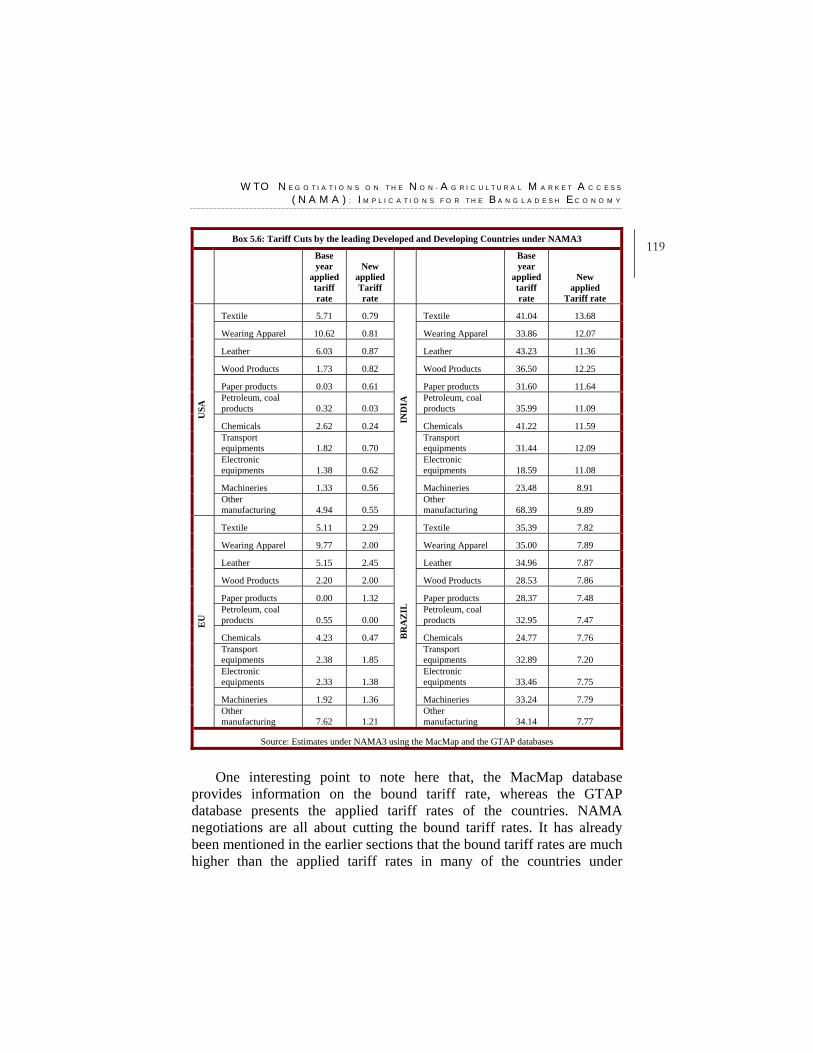
W T O N E G O T I A T I O N S O N T H E N O N - A G R I C U L T U R A L M A R K E T A C C E S S
( N A M A ) : I M P L I C A T I O N S F O R T H E B A N G L A D E S H E C O N O M Y
119Box 5.6: Tariff Cuts by the leading Developed and Developing Countries under NAMA3
Base year
applied tariff rate
New applied Tariff rate
Base year
applied tariff rate
New applied
Tariff rate
Textile 5.71 0.79 Textile 41.04 13.68
Wearing Apparel 10.62 0.81 Wearing Apparel 33.86 12.07
Leather 6.03 0.87 Leather 43.23 11.36
Wood Products 1.73 0.82 Wood Products 36.50 12.25
Paper products 0.03 0.61 Paper products 31.60 11.64 Petroleum, coal products 0.32 0.03
Petroleum, coal products 35.99 11.09
Chemicals 2.62 0.24 Chemicals 41.22 11.59 Transport equipments 1.82 0.70
Transport equipments 31.44 12.09
Electronic equipments 1.38 0.62
Electronic equipments 18.59 11.08
Machineries 1.33 0.56 Machineries 23.48 8.91
USA
Other manufacturing 4.94 0.55
IND
IA
Other manufacturing 68.39 9.89
Textile 5.11 2.29 Textile 35.39 7.82
Wearing Apparel 9.77 2.00 Wearing Apparel 35.00 7.89
Leather 5.15 2.45 Leather 34.96 7.87
Wood Products 2.20 2.00 Wood Products 28.53 7.86
Paper products 0.00 1.32 Paper products 28.37 7.48 Petroleum, coal products 0.55 0.00
Petroleum, coal products 32.95 7.47
Chemicals 4.23 0.47 Chemicals 24.77 7.76 Transport equipments 2.38 1.85
Transport equipments 32.89 7.20
Electronic equipments 2.33 1.38
Electronic equipments 33.46 7.75
Machineries 1.92 1.36 Machineries 33.24 7.79
EU
Other manufacturing 7.62 1.21
BR
AZ
IL
Other manufacturing 34.14 7.77
Source: Estimates under NAMA3 using the MacMap and the GTAP databases
One interesting point to note here that, the MacMap database
provides information on the bound tariff rate, whereas the GTAP database presents the applied tariff rates of the countries. NAMA negotiations are all about cutting the bound tariff rates. It has already been mentioned in the earlier sections that the bound tariff rates are much higher than the applied tariff rates in many of the countries under
W T O A N D R E G I O N A L T R A D E N E G O T I A T I O N O U T C O M E S : Q U A N T I T A T I V E
A S S E S S M E N T S O F P O T E N T I A L I M P L I C A T I O N S O N B A N G L A D E S H
120 consideration. Therefore, once the bound tariff rates are cut using the modified Swiss formula, with coefficients of 0.10 and 0.20 for the developed and developing countries respectively, the new bound tariff rates are matched with the applied tariff rates. And only if the new bound rates are lower than the applied rate, the new bound rates are introduced in the GTAP model as tariff cut shocks. NAMA2 scenario takes into account all these dimensions. Box 5.5 shows the figures of the tariff cuts by the four leading developed and developing countries under NAMA2.
The third simulation, namely NAMA3, leads to a tariff cut in the developed and developing countries by considering coefficients 0.20 for the developed and 0.30 for the developing countries in the modified Swiss formula. It appears that, compared to NAMA2, higher values of the coefficients in the Swiss formula under NAMA3 leads to a relatively less deep cut in tariffs. Box 5.6 presents the changes in tariffs under NAMA3 in four leading developed and developing countries. 5.5.2. Welfare Effects of NAMA Scenarios: GTAP Simulation
Outcomes Table 5.4 presents the welfare effects on selected countries, and annex table 5.1 presents the decomposition of the welfare effects for all the countries or regions in the GTAP model under consideration for NAMA1, NAMA2 and NAMA3 scenarios. It appears that a full implementation of the NAMA negotiations (NAMA1 scenario) will lead to a net welfare gain for Bangladesh and other LDCs. From annex table 5.1 it is understood that the welfare gain in Bangladesh and other LDCs are mainly driven by the favorable terms of trade shock, as the export prices of their products increase, whereas import prices decline in many cases. However, compared to the DFQF scenarios in chapter 4 the gains due to the favorable terms of trade are less pronounced. This is because of the resultant preference erosion of Bangladesh’s and other LDCs’ products in the countries, especially in the EU, where they are enjoying preference margins over other developing and developed countries.
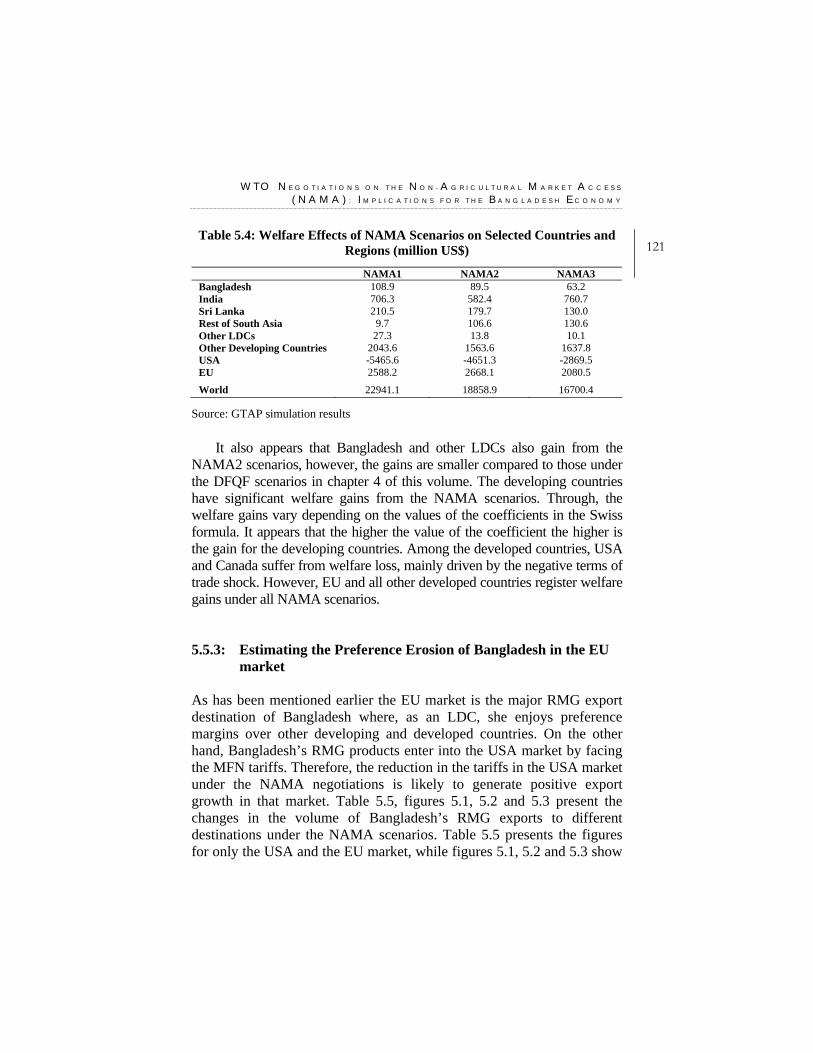
W T O N E G O T I A T I O N S O N T H E N O N - A G R I C U L T U R A L M A R K E T A C C E S S
( N A M A ) : I M P L I C A T I O N S F O R T H E B A N G L A D E S H E C O N O M Y
121Table 5.4: Welfare Effects of NAMA Scenarios on Selected Countries and
Regions (million US$)
NAMA1 NAMA2 NAMA3 Bangladesh 108.9 89.5 63.2 India 706.3 582.4 760.7 Sri Lanka 210.5 179.7 130.0 Rest of South Asia 9.7 106.6 130.6 Other LDCs 27.3 13.8 10.1 Other Developing Countries 2043.6 1563.6 1637.8 USA -5465.6 -4651.3 -2869.5 EU 2588.2 2668.1 2080.5
World 22941.1 18858.9 16700.4 Source: GTAP simulation results
It also appears that Bangladesh and other LDCs also gain from the NAMA2 scenarios, however, the gains are smaller compared to those under the DFQF scenarios in chapter 4 of this volume. The developing countries have significant welfare gains from the NAMA scenarios. Through, the welfare gains vary depending on the values of the coefficients in the Swiss formula. It appears that the higher the value of the coefficient the higher is the gain for the developing countries. Among the developed countries, USA and Canada suffer from welfare loss, mainly driven by the negative terms of trade shock. However, EU and all other developed countries register welfare gains under all NAMA scenarios. 5.5.3: Estimating the Preference Erosion of Bangladesh in the EU
market As has been mentioned earlier the EU market is the major RMG export destination of Bangladesh where, as an LDC, she enjoys preference margins over other developing and developed countries. On the other hand, Bangladesh’s RMG products enter into the USA market by facing the MFN tariffs. Therefore, the reduction in the tariffs in the USA market under the NAMA negotiations is likely to generate positive export growth in that market. Table 5.5, figures 5.1, 5.2 and 5.3 present the changes in the volume of Bangladesh’s RMG exports to different destinations under the NAMA scenarios. Table 5.5 presents the figures for only the USA and the EU market, while figures 5.1, 5.2 and 5.3 show

W T O A N D R E G I O N A L T R A D E N E G O T I A T I O N O U T C O M E S : Q U A N T I T A T I V E
A S S E S S M E N T S O F P O T E N T I A L I M P L I C A T I O N S O N B A N G L A D E S H
122 the changes in Bangladesh’s RMG export volumes in all markets as specified in the GTAP model. It is also important to note that, though Bangladesh qualifies for DFQF access in the EU market, because of the stringent RoO all of the Bangladesh’s RMG products can not enter the EU market under the DFQF facilities. On the basis of the estimates of the rate of actual preference utilisation, in the present study we assume that roughly 50 percent of the Bangladesh’s RMG exports in the EU market can enjoy preference margins. In line with this assumption some adjustments are made in the GTAP model in order to capture this dimension. Table 5.5: Bangladesh’s RMG Exports Volume Change in the USA and EU
under NAMA (Million US$)
NAMA1 NAMA2 NAMA3
USA 406.5 375.2 318.2
EU -173.4 -143.6 -124.8
Total 191.9 182.3 158.3
Source: GTAP simulation results Figure 5.1: Preference Erosion and Gains of Bangladesh’s RMG
Exports in different Markets under NAMA1
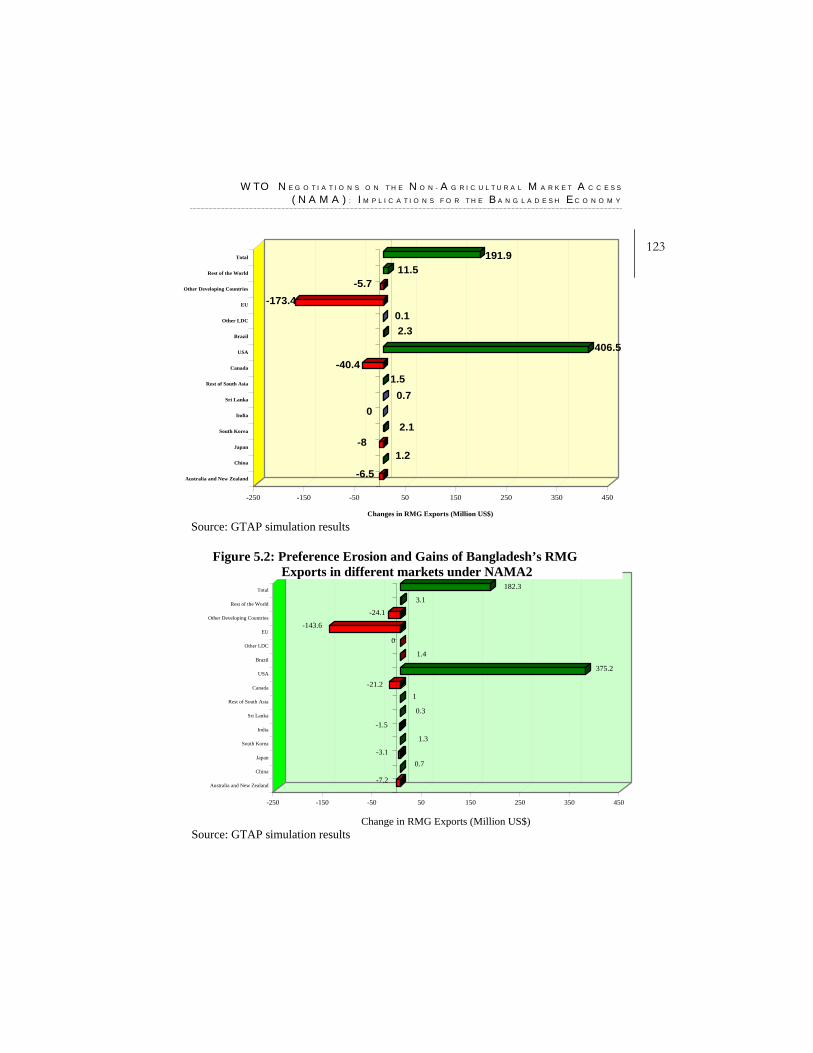
W T O N E G O T I A T I O N S O N T H E N O N - A G R I C U L T U R A L M A R K E T A C C E S S
( N A M A ) : I M P L I C A T I O N S F O R T H E B A N G L A D E S H E C O N O M Y
123
-6.5
1.2-8
2.10
0.71.5
-40.4406.5
2.30.1
-173.4-5.7
11.5191.9
-250 -150 -50 50 150 250 350 450
Changes in RMG Exports (Million US$)
Australia and New Zealand
China
Japan
South Korea
India
Sri Lanka
Rest of South Asia
Canada
USA
Brazil
Other LDC
EU
Other Developing Countries
Rest of the World
Total
-7.2
0.7-3.1
1.3
-1.5
0.3
1-21.2
375.2
1.4
0
-143.6
-24.1
3.1
182.3
-250 -150 -50 50 150 250 350 450
Change in RMG Exports (Million US$)
Australia and New Zealand
China
Japan
South Korea
India
Sri Lanka
Rest of South Asia
Canada
USA
Brazil
Other LDC
EU
Other Developing Countries
Rest of the World
Total
Source: GTAP simulation results
Figure 5.2: Preference Erosion and Gains of Bangladesh’s RMG Exports in different markets under NAMA2
Source: GTAP simulation results
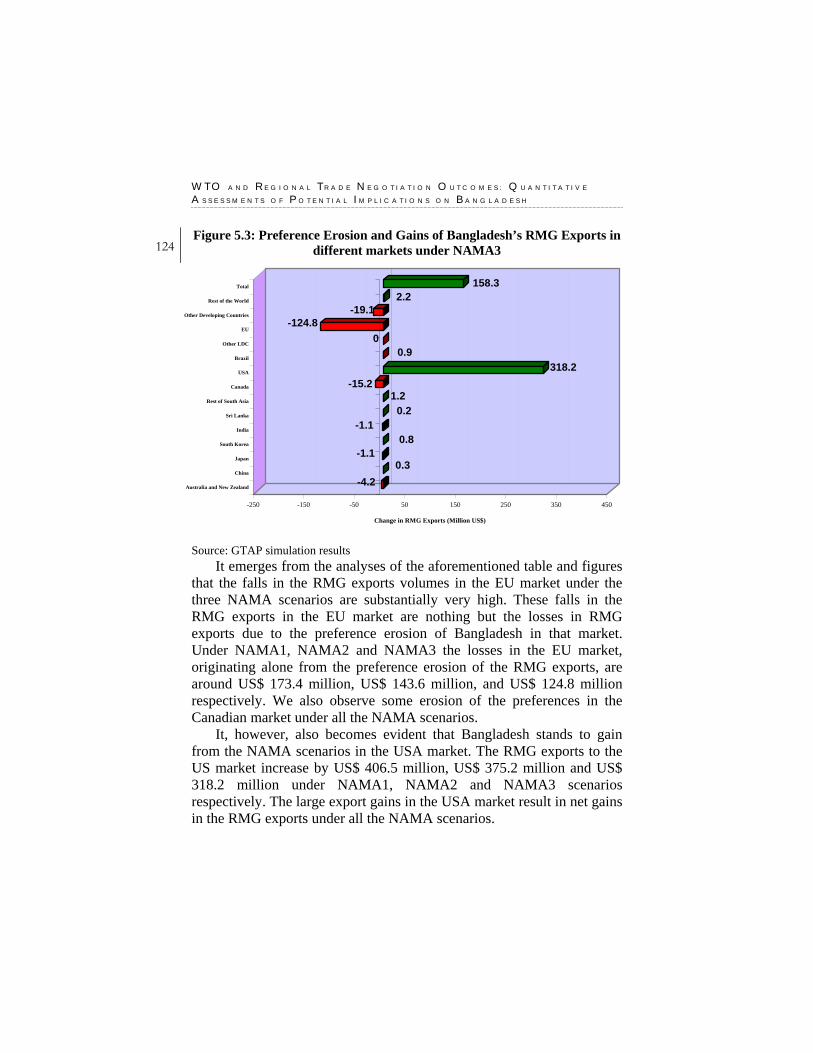
W T O A N D R E G I O N A L T R A D E N E G O T I A T I O N O U T C O M E S : Q U A N T I T A T I V E
A S S E S S M E N T S O F P O T E N T I A L I M P L I C A T I O N S O N B A N G L A D E S H
124 Figure 5.3: Preference Erosion and Gains of Bangladesh’s RMG Exports in
different markets under NAMA3
-4.20.3
-1.10.8
-1.10.2
1.2-15.2
318.20.9
0-124.8
-19.12.2
158.3
-250 -150 -50 50 150 250 350 450
Change in RMG Exports (Million US$)
Australia and New Zealand
China
Japan
South Korea
India
Sri Lanka
Rest of South Asia
Canada
USA
Brazil
Other LDC
EU
Other Developing Countries
Rest of the World
Total
Source: GTAP simulation results It emerges from the analyses of the aforementioned table and figures
that the falls in the RMG exports volumes in the EU market under the three NAMA scenarios are substantially very high. These falls in the RMG exports in the EU market are nothing but the losses in RMG exports due to the preference erosion of Bangladesh in that market. Under NAMA1, NAMA2 and NAMA3 the losses in the EU market, originating alone from the preference erosion of the RMG exports, are around US$ 173.4 million, US$ 143.6 million, and US$ 124.8 million respectively. We also observe some erosion of the preferences in the Canadian market under all the NAMA scenarios.
It, however, also becomes evident that Bangladesh stands to gain from the NAMA scenarios in the USA market. The RMG exports to the US market increase by US$ 406.5 million, US$ 375.2 million and US$ 318.2 million under NAMA1, NAMA2 and NAMA3 scenarios respectively. The large export gains in the USA market result in net gains in the RMG exports under all the NAMA scenarios.
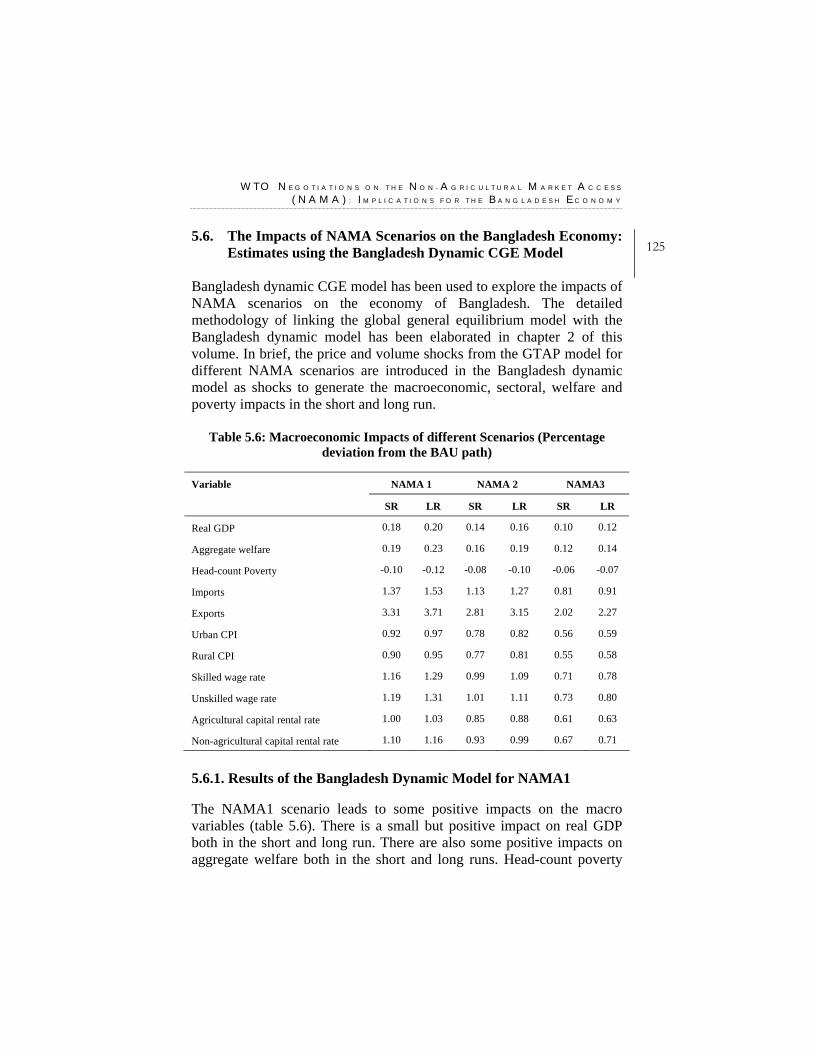
W T O N E G O T I A T I O N S O N T H E N O N - A G R I C U L T U R A L M A R K E T A C C E S S
( N A M A ) : I M P L I C A T I O N S F O R T H E B A N G L A D E S H E C O N O M Y
1255.6. The Impacts of NAMA Scenarios on the Bangladesh Economy:
Estimates using the Bangladesh Dynamic CGE Model Bangladesh dynamic CGE model has been used to explore the impacts of NAMA scenarios on the economy of Bangladesh. The detailed methodology of linking the global general equilibrium model with the Bangladesh dynamic model has been elaborated in chapter 2 of this volume. In brief, the price and volume shocks from the GTAP model for different NAMA scenarios are introduced in the Bangladesh dynamic model as shocks to generate the macroeconomic, sectoral, welfare and poverty impacts in the short and long run.
Table 5.6: Macroeconomic Impacts of different Scenarios (Percentage deviation from the BAU path)
Variable NAMA 1 NAMA 2 NAMA3
SR LR SR LR SR LR
Real GDP 0.18 0.20 0.14 0.16 0.10 0.12
Aggregate welfare 0.19 0.23 0.16 0.19 0.12 0.14
Head-count Poverty -0.10 -0.12 -0.08 -0.10 -0.06 -0.07
Imports 1.37 1.53 1.13 1.27 0.81 0.91
Exports 3.31 3.71 2.81 3.15 2.02 2.27
Urban CPI 0.92 0.97 0.78 0.82 0.56 0.59
Rural CPI 0.90 0.95 0.77 0.81 0.55 0.58
Skilled wage rate 1.16 1.29 0.99 1.09 0.71 0.78
Unskilled wage rate 1.19 1.31 1.01 1.11 0.73 0.80
Agricultural capital rental rate 1.00 1.03 0.85 0.88 0.61 0.63
Non-agricultural capital rental rate 1.10 1.16 0.93 0.99 0.67 0.71
5.6.1. Results of the Bangladesh Dynamic Model for NAMA1 The NAMA1 scenario leads to some positive impacts on the macro variables (table 5.6). There is a small but positive impact on real GDP both in the short and long run. There are also some positive impacts on aggregate welfare both in the short and long runs. Head-count poverty
W T O A N D R E G I O N A L T R A D E N E G O T I A T I O N O U T C O M E S : Q U A N T I T A T I V E
A S S E S S M E N T S O F P O T E N T I A L I M P L I C A T I O N S O N B A N G L A D E S H
126 declines by small margins. The impacts on both imports and exports are positive. Consumer price indices, wage rates and the capital rental rates rise, though the increases in the wage rates and capital rental rates are higher than those of the consumer price induces.
The sectoral impacts are reported in the annex tables 5.2 and 5.3. The sectoral impacts are also seen to be smaller but positive in magnitudes. It appears that the NAMA1 scenario leads a rise in export pries and export demand of woven and knit RMG products. As a result, in the short run these two sectors expand, though in modest margins. However, some other export oriented sectors, like the leather sector, suffer from negative export demand shocks, and therefore, contract. The textile sector expands because of the increased demand of raw materials from the RMG sectors. This leads to a reallocation of resources from the agriculture and other import-competing sectors to the expanding sectors, namely the woven and knit RMG and the textile sector in the economy. As a result of the expansion of the leading export-oriented sectors, which are mainly unskilled labour-intensive sectors, the wage rates of the unskilled labour increases more than that of the skilled labour (table 5.6). The pattern of the impacts in the long run is similar to those in the short run, though the positive impacts on the RMG sectors are strengthened.
Figure 5.4: More Concentration of the Export Basket? (Export growth of
other sectors under NAMA1)
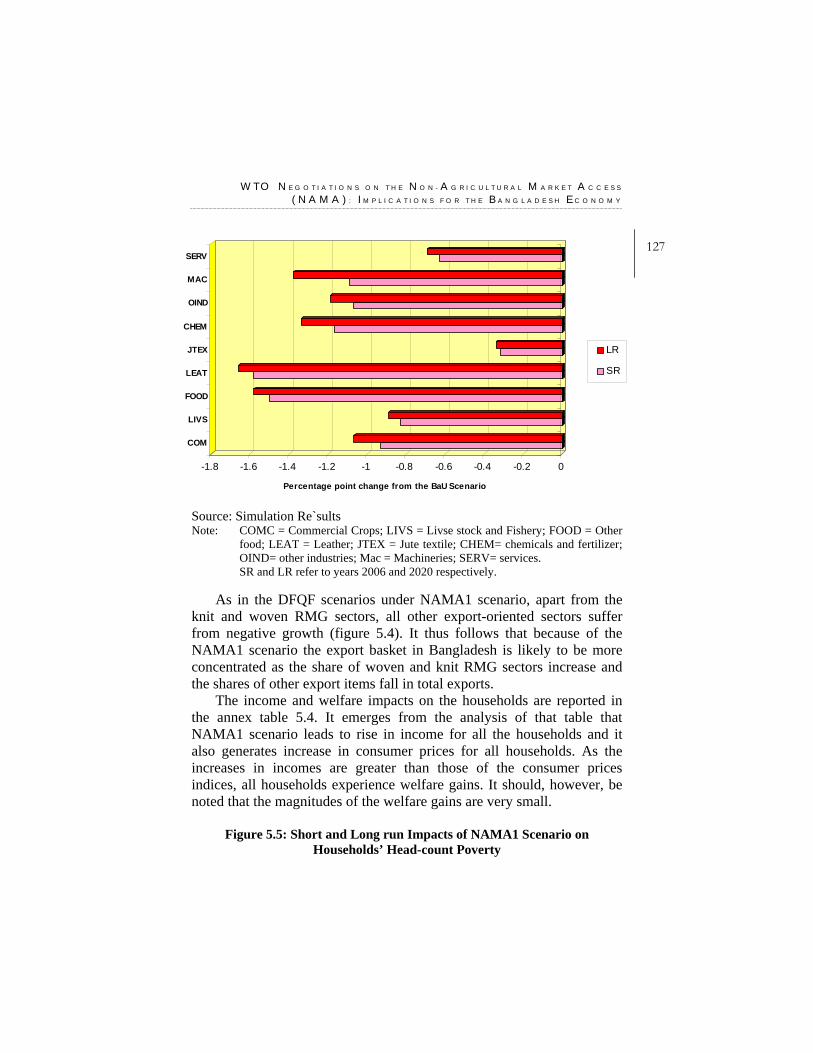
W T O N E G O T I A T I O N S O N T H E N O N - A G R I C U L T U R A L M A R K E T A C C E S S
( N A M A ) : I M P L I C A T I O N S F O R T H E B A N G L A D E S H E C O N O M Y
127
-1.8 -1.6 -1.4 -1.2 -1 -0.8 -0.6 -0.4 -0.2 0
Percentage point change from the BaU Scenario
COM
LIVS
FOOD
LEAT
JTEX
CHEM
OIND
MAC
SERV
LR
SR
Source: Simulation Re`sults Note: COMC = Commercial Crops; LIVS = Livse stock and Fishery; FOOD = Other
food; LEAT = Leather; JTEX = Jute textile; CHEM= chemicals and fertilizer; OIND= other industries; Mac = Machineries; SERV= services. SR and LR refer to years 2006 and 2020 respectively.
As in the DFQF scenarios under NAMA1 scenario, apart from the knit and woven RMG sectors, all other export-oriented sectors suffer from negative growth (figure 5.4). It thus follows that because of the NAMA1 scenario the export basket in Bangladesh is likely to be more concentrated as the share of woven and knit RMG sectors increase and the shares of other export items fall in total exports.
The income and welfare impacts on the households are reported in the annex table 5.4. It emerges from the analysis of that table that NAMA1 scenario leads to rise in income for all the households and it also generates increase in consumer prices for all households. As the increases in incomes are greater than those of the consumer prices indices, all households experience welfare gains. It should, however, be noted that the magnitudes of the welfare gains are very small.
Figure 5.5: Short and Long run Impacts of NAMA1 Scenario on
Households’ Head-count Poverty
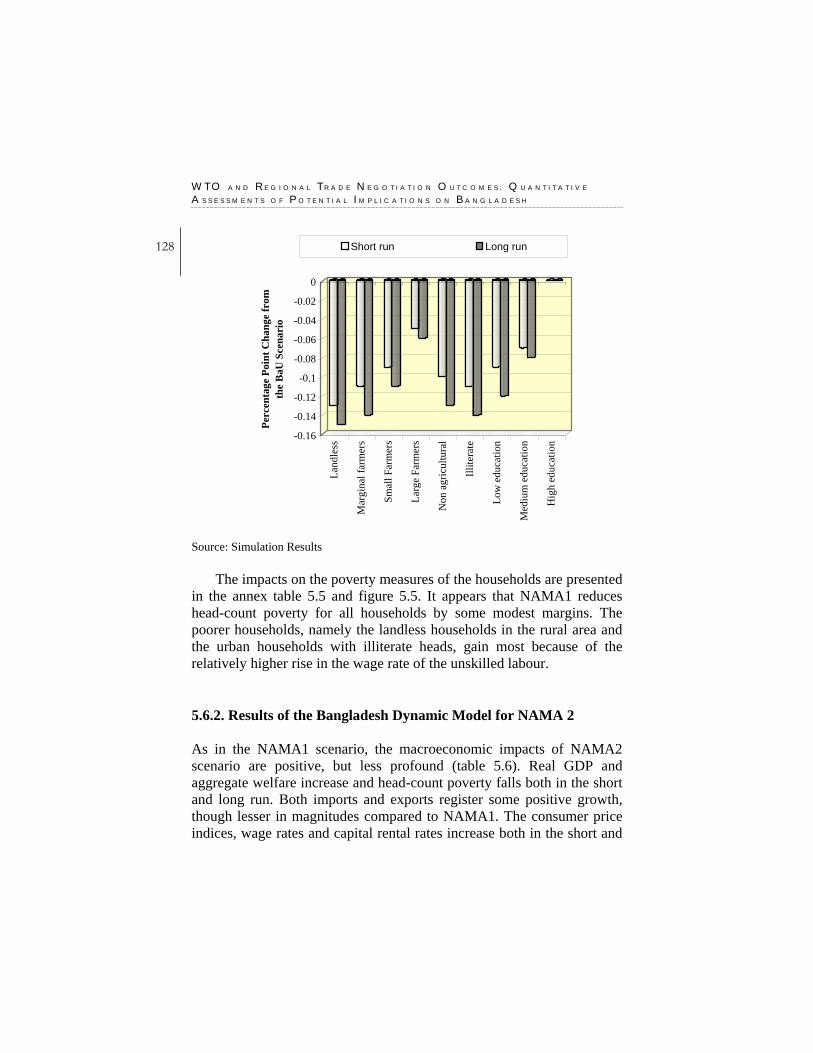
W T O A N D R E G I O N A L T R A D E N E G O T I A T I O N O U T C O M E S : Q U A N T I T A T I V E
A S S E S S M E N T S O F P O T E N T I A L I M P L I C A T I O N S O N B A N G L A D E S H
128
-0.16
-0.14
-0.12
-0.1
-0.08
-0.06
-0.04
-0.02
0Pe
rcen
tage
Poi
nt C
hang
e fr
om
the
BaU
Sce
nari
o
Land
less
Mar
gina
l far
mer
s
Smal
l Far
mer
s
Larg
e Fa
rmer
s
Non
agr
icul
tura
l
Illite
rate
Low
edu
catio
n
Med
ium
edu
catio
n
Hig
h ed
ucat
ion
Short run Long run
Source: Simulation Results
The impacts on the poverty measures of the households are presented in the annex table 5.5 and figure 5.5. It appears that NAMA1 reduces head-count poverty for all households by some modest margins. The poorer households, namely the landless households in the rural area and the urban households with illiterate heads, gain most because of the relatively higher rise in the wage rate of the unskilled labour. 5.6.2. Results of the Bangladesh Dynamic Model for NAMA 2 As in the NAMA1 scenario, the macroeconomic impacts of NAMA2 scenario are positive, but less profound (table 5.6). Real GDP and aggregate welfare increase and head-count poverty falls both in the short and long run. Both imports and exports register some positive growth, though lesser in magnitudes compared to NAMA1. The consumer price indices, wage rates and capital rental rates increase both in the short and
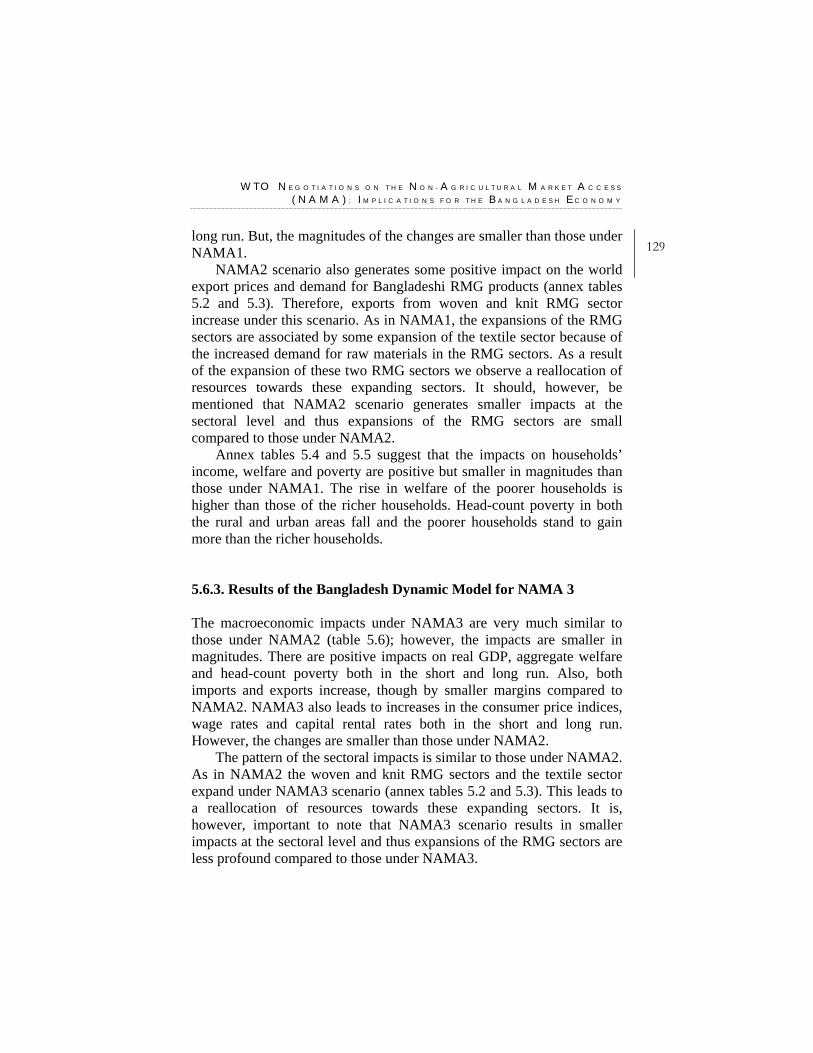
W T O N E G O T I A T I O N S O N T H E N O N - A G R I C U L T U R A L M A R K E T A C C E S S
( N A M A ) : I M P L I C A T I O N S F O R T H E B A N G L A D E S H E C O N O M Y
129long run. But, the magnitudes of the changes are smaller than those under NAMA1.
NAMA2 scenario also generates some positive impact on the world export prices and demand for Bangladeshi RMG products (annex tables 5.2 and 5.3). Therefore, exports from woven and knit RMG sector increase under this scenario. As in NAMA1, the expansions of the RMG sectors are associated by some expansion of the textile sector because of the increased demand for raw materials in the RMG sectors. As a result of the expansion of these two RMG sectors we observe a reallocation of resources towards these expanding sectors. It should, however, be mentioned that NAMA2 scenario generates smaller impacts at the sectoral level and thus expansions of the RMG sectors are small compared to those under NAMA2.
Annex tables 5.4 and 5.5 suggest that the impacts on households’ income, welfare and poverty are positive but smaller in magnitudes than those under NAMA1. The rise in welfare of the poorer households is higher than those of the richer households. Head-count poverty in both the rural and urban areas fall and the poorer households stand to gain more than the richer households. 5.6.3. Results of the Bangladesh Dynamic Model for NAMA 3 The macroeconomic impacts under NAMA3 are very much similar to those under NAMA2 (table 5.6); however, the impacts are smaller in magnitudes. There are positive impacts on real GDP, aggregate welfare and head-count poverty both in the short and long run. Also, both imports and exports increase, though by smaller margins compared to NAMA2. NAMA3 also leads to increases in the consumer price indices, wage rates and capital rental rates both in the short and long run. However, the changes are smaller than those under NAMA2.
The pattern of the sectoral impacts is similar to those under NAMA2. As in NAMA2 the woven and knit RMG sectors and the textile sector expand under NAMA3 scenario (annex tables 5.2 and 5.3). This leads to a reallocation of resources towards these expanding sectors. It is, however, important to note that NAMA3 scenario results in smaller impacts at the sectoral level and thus expansions of the RMG sectors are less profound compared to those under NAMA3.

W T O A N D R E G I O N A L T R A D E N E G O T I A T I O N O U T C O M E S : Q U A N T I T A T I V E
A S S E S S M E N T S O F P O T E N T I A L I M P L I C A T I O N S O N B A N G L A D E S H
130 The welfare and poverty impacts are also similar as in NAMA2
(annex tables 5.4 and 5.5). The impacts on households’ income, welfare and poverty are positive but smaller in magnitudes than those under NAMA2. Head-count poverty in both the rural and urban areas falls. As in NAMA2, it appears that the poorer households stand to gain more than the richer households in terms of increase in welfare and reduction in poverty. 5.7. Conclusion This paper has explored three different NAMA scenarios with a view to estimating the preference erosion of Bangladesh’s RMG exports in the EU and Canadian markets and the possible gains in the USA and other markets. Using the GTAP general equilibrium method this paper has also estimated the welfare impacts of different NAMA scenarios. It appears from the simulation results that a full implementation of NAMA will lead to large preference erosion of Bangladesh RMG exports in the EU and Canadian markets, where Bangladesh is currently enjoying duty-free-quota-free market access. However, the large gain in the USA market is sufficient enough to offset the losses in the EU and Canadian market, and as a result, for Bangladesh both total RMG exports and welfare rise under NAMA1. Also NAMA2 and NAMA3, which are the scenarios based on the modified Swiss-type formula with different coefficients for the developed and developing countries, lead to a situation where the preference erosions in the EU and Canadian market is offset by the expansion of RMG exports in the USA market. Therefore, total RMG exports of Bangladesh increases. Also, aggregate welfare increases, though in smaller margin.
The Bangladesh dynamic model has been applied to explore the impacts of different NAMA scenarios on the economy of Bangladesh. All NAMA scenarios generate some positive impact on the economy, and lead to some expansion of the RMG sectors. They also increase households’ welfare and reduce poverty. However, the positive gains from the NAMA sceneries are much smaller than those under the DFQF scenarios as depicted in chapter 4 of this volume.
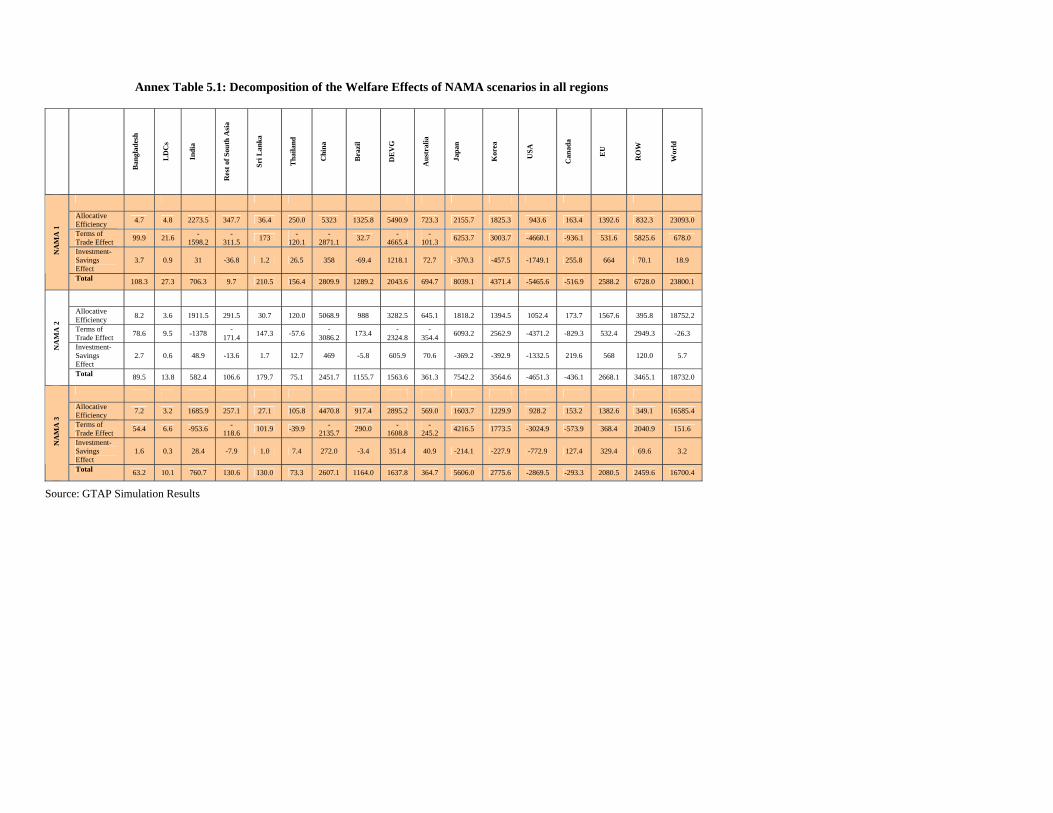
Annex Table 5.1: Decomposition of the Welfare Effects of NAMA scenarios in all regions
Ban
glad
esh
LD
Cs
Indi
a
Res
t of S
outh
Asi
a
Sri L
anka
Tha
iland
Chi
na
Bra
zil
DE
VG
Aus
tral
ia
Japa
n
Kor
ea
USA
Can
ada
EU
RO
W
Wor
ld
Allocative Efficiency 4.7 4.8 2273.5 347.7 36.4 250.0 5323 1325.8 5490.9 723.3 2155.7 1825.3 943.6 163.4 1392.6 832.3 23093.0
Terms of Trade Effect 99.9 21.6 -
1598.2 -
311.5 173 -120.1
-2871.1 32.7 -
4665.4 -
101.3 6253.7 3003.7 -4660.1 -936.1 531.6 5825.6 678.0
Investment-Savings Effect
3.7 0.9 31 -36.8 1.2 26.5 358 -69.4 1218.1 72.7 -370.3 -457.5 -1749.1 255.8 664 70.1 18.9
NA
MA
1
Total 108.3 27.3 706.3 9.7 210.5 156.4 2809.9 1289.2 2043.6 694.7 8039.1 4371.4 -5465.6 -516.9 2588.2 6728.0 23800.1
Allocative Efficiency 8.2 3.6 1911.5 291.5 30.7 120.0 5068.9 988 3282.5 645.1 1818.2 1394.5 1052.4 173.7 1567.6 395.8 18752.2
Terms of Trade Effect 78.6 9.5 -1378 -
171.4 147.3 -57.6 -3086.2 173.4 -
2324.8 -
354.4 6093.2 2562.9 -4371.2 -829.3 532.4 2949.3 -26.3
Investment-Savings Effect
2.7 0.6 48.9 -13.6 1.7 12.7 469 -5.8 605.9 70.6 -369.2 -392.9 -1332.5 219.6 568 120.0 5.7
NA
MA
2
Total 89.5 13.8 582.4 106.6 179.7 75.1 2451.7 1155.7 1563.6 361.3 7542.2 3564.6 -4651.3 -436.1 2668.1 3465.1 18732.0
Allocative Efficiency 7.2 3.2 1685.9 257.1 27.1 105.8 4470.8 917.4 2895.2 569.0 1603.7 1229.9 928.2 153.2 1382.6 349.1 16585.4
Terms of Trade Effect 54.4 6.6 -953.6 -
118.6 101.9 -39.9 -2135.7 290.0 -
1608.8 -
245.2 4216.5 1773.5 -3024.9 -573.9 368.4 2040.9 151.6
Investment-Savings Effect
1.6 0.3 28.4 -7.9 1.0 7.4 272.0 -3.4 351.4 40.9 -214.1 -227.9 -772.9 127.4 329.4 69.6 3.2
NA
MA
3
Total 63.2 10.1 760.7 130.6 130.0 73.3 2607.1 1164.0 1637.8 364.7 5606.0 2775.6 -2869.5 -293.3 2080.5 2459.6 16700.4
Source: GTAP Simulation Results
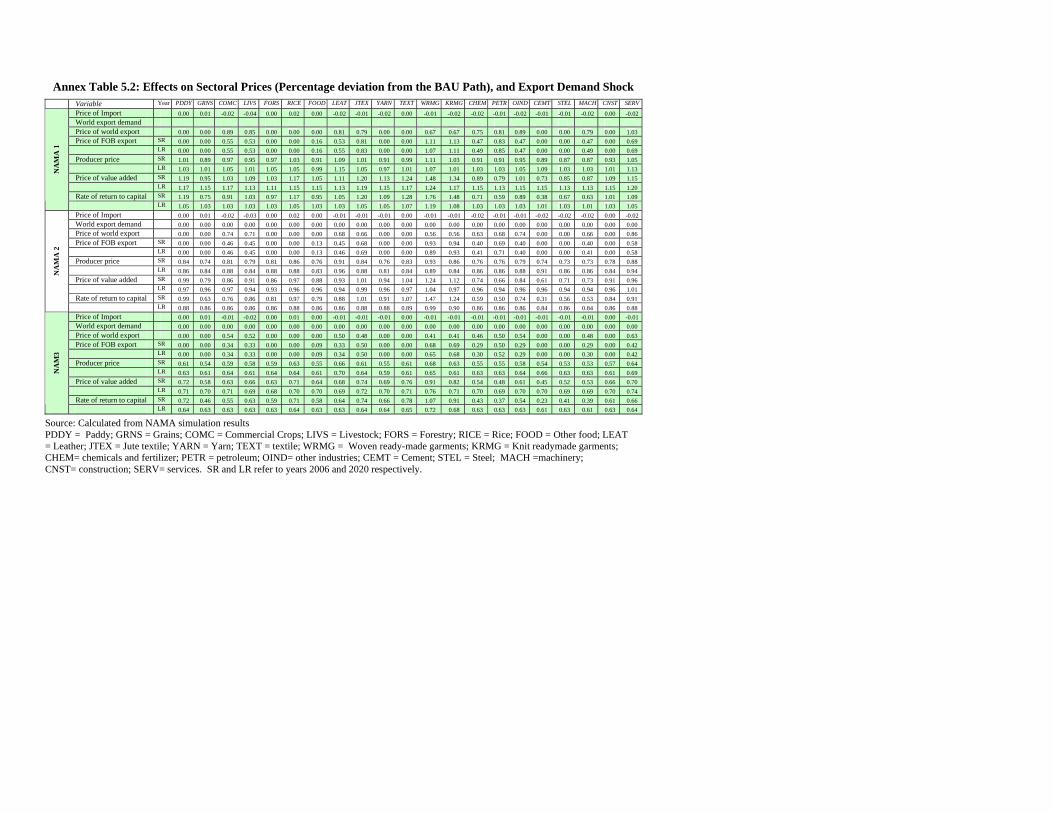
Annex Table 5.2: Effects on Sectoral Prices (Percentage deviation from the BAU Path), and Export Demand Shock
Variable Year PDDY GRNS COMC LIVS FORS RICE FOOD LEAT JTEX YARN TEXT WRMG KRMG CHEM PETR OIND CEMT STEL MACH CNST SERV
Price of Import 0.00 0.01 -0.02 -0.04 0.00 0.02 0.00 -0.02 -0.01 -0.02 0.00 -0.01 -0.02 -0.02 -0.01 -0.02 -0.01 -0.01 -0.02 0.00 -0.02 World export demand Price of world export 0.00 0.00 0.89 0.85 0.00 0.00 0.00 0.81 0.79 0.00 0.00 0.67 0.67 0.75 0.81 0.89 0.00 0.00 0.79 0.00 1.03 Price of FOB export SR 0.00 0.00 0.55 0.53 0.00 0.00 0.16 0.53 0.81 0.00 0.00 1.11 1.13 0.47 0.83 0.47 0.00 0.00 0.47 0.00 0.69 LR 0.00 0.00 0.55 0.53 0.00 0.00 0.16 0.55 0.83 0.00 0.00 1.07 1.11 0.49 0.85 0.47 0.00 0.00 0.49 0.00 0.69 Producer price SR 1.01 0.89 0.97 0.95 0.97 1.03 0.91 1.09 1.01 0.91 0.99 1.11 1.03 0.91 0.91 0.95 0.89 0.87 0.87 0.93 1.05 LR 1.03 1.01 1.05 1.01 1.05 1.05 0.99 1.15 1.05 0.97 1.01 1.07 1.01 1.03 1.03 1.05 1.09 1.03 1.03 1.01 1.13 Price of value added SR 1.19 0.95 1.03 1.09 1.03 1.17 1.05 1.11 1.20 1.13 1.24 1.48 1.34 0.89 0.79 1.01 0.73 0.85 0.87 1.09 1.15 LR 1.17 1.15 1.17 1.13 1.11 1.15 1.15 1.13 1.19 1.15 1.17 1.24 1.17 1.15 1.13 1.15 1.15 1.13 1.13 1.15 1.20 Rate of return to capital SR 1.19 0.75 0.91 1.03 0.97 1.17 0.95 1.05 1.20 1.09 1.28 1.76 1.48 0.71 0.59 0.89 0.38 0.67 0.63 1.01 1.09
NA
MA
1
LR 1.05 1.03 1.03 1.03 1.03 1.05 1.03 1.03 1.05 1.05 1.07 1.19 1.08 1.03 1.03 1.03 1.01 1.03 1.01 1.03 1.05 Price of Import 0.00 0.01 -0.02 -0.03 0.00 0.02 0.00 -0.01 -0.01 -0.01 0.00 -0.01 -0.01 -0.02 -0.01 -0.01 -0.02 -0.02 -0.02 0.00 -0.02 World export demand 0.00 0.00 0.00 0.00 0.00 0.00 0.00 0.00 0.00 0.00 0.00 0.00 0.00 0.00 0.00 0.00 0.00 0.00 0.00 0.00 0.00 Price of world export 0.00 0.00 0.74 0.71 0.00 0.00 0.00 0.68 0.66 0.00 0.00 0.56 0.56 0.63 0.68 0.74 0.00 0.00 0.66 0.00 0.86 Price of FOB export SR 0.00 0.00 0.46 0.45 0.00 0.00 0.13 0.45 0.68 0.00 0.00 0.93 0.94 0.40 0.69 0.40 0.00 0.00 0.40 0.00 0.58 LR 0.00 0.00 0.46 0.45 0.00 0.00 0.13 0.46 0.69 0.00 0.00 0.89 0.93 0.41 0.71 0.40 0.00 0.00 0.41 0.00 0.58 Producer price SR 0.84 0.74 0.81 0.79 0.81 0.86 0.76 0.91 0.84 0.76 0.83 0.93 0.86 0.76 0.76 0.79 0.74 0.73 0.73 0.78 0.88 LR 0.86 0.84 0.88 0.84 0.88 0.88 0.83 0.96 0.88 0.81 0.84 0.89 0.84 0.86 0.86 0.88 0.91 0.86 0.86 0.84 0.94 Price of value added SR 0.99 0.79 0.86 0.91 0.86 0.97 0.88 0.93 1.01 0.94 1.04 1.24 1.12 0.74 0.66 0.84 0.61 0.71 0.73 0.91 0.96 LR 0.97 0.96 0.97 0.94 0.93 0.96 0.96 0.94 0.99 0.96 0.97 1.04 0.97 0.96 0.94 0.96 0.96 0.94 0.94 0.96 1.01 Rate of return to capital SR 0.99 0.63 0.76 0.86 0.81 0.97 0.79 0.88 1.01 0.91 1.07 1.47 1.24 0.59 0.50 0.74 0.31 0.56 0.53 0.84 0.91
NA
MA
2
LR 0.88 0.86 0.86 0.86 0.86 0.88 0.86 0.86 0.88 0.88 0.89 0.99 0.90 0.86 0.86 0.86 0.84 0.86 0.84 0.86 0.88 Price of Import 0.00 0.01 -0.01 -0.02 0.00 0.01 0.00 -0.01 -0.01 -0.01 0.00 -0.01 -0.01 -0.01 -0.01 -0.01 -0.01 -0.01 -0.01 0.00 -0.01 World export demand 0.00 0.00 0.00 0.00 0.00 0.00 0.00 0.00 0.00 0.00 0.00 0.00 0.00 0.00 0.00 0.00 0.00 0.00 0.00 0.00 0.00 Price of world export 0.00 0.00 0.54 0.52 0.00 0.00 0.00 0.50 0.48 0.00 0.00 0.41 0.41 0.46 0.50 0.54 0.00 0.00 0.48 0.00 0.63 Price of FOB export SR 0.00 0.00 0.34 0.33 0.00 0.00 0.09 0.33 0.50 0.00 0.00 0.68 0.69 0.29 0.50 0.29 0.00 0.00 0.29 0.00 0.42 LR 0.00 0.00 0.34 0.33 0.00 0.00 0.09 0.34 0.50 0.00 0.00 0.65 0.68 0.30 0.52 0.29 0.00 0.00 0.30 0.00 0.42 Producer price SR 0.61 0.54 0.59 0.58 0.59 0.63 0.55 0.66 0.61 0.55 0.61 0.68 0.63 0.55 0.55 0.58 0.54 0.53 0.53 0.57 0.64 LR 0.63 0.61 0.64 0.61 0.64 0.64 0.61 0.70 0.64 0.59 0.61 0.65 0.61 0.63 0.63 0.64 0.66 0.63 0.63 0.61 0.69 Price of value added SR 0.72 0.58 0.63 0.66 0.63 0.71 0.64 0.68 0.74 0.69 0.76 0.91 0.82 0.54 0.48 0.61 0.45 0.52 0.53 0.66 0.70 LR 0.71 0.70 0.71 0.69 0.68 0.70 0.70 0.69 0.72 0.70 0.71 0.76 0.71 0.70 0.69 0.70 0.70 0.69 0.69 0.70 0.74 Rate of return to capital SR 0.72 0.46 0.55 0.63 0.59 0.71 0.58 0.64 0.74 0.66 0.78 1.07 0.91 0.43 0.37 0.54 0.23 0.41 0.39 0.61 0.66
NA
M3
LR 0.64 0.63 0.63 0.63 0.63 0.64 0.63 0.63 0.64 0.64 0.65 0.72 0.68 0.63 0.63 0.63 0.61 0.63 0.61 0.63 0.64
Source: Calculated from NAMA simulation results PDDY = Paddy; GRNS = Grains; COMC = Commercial Crops; LIVS = Livestock; FORS = Forestry; RICE = Rice; FOOD = Other food; LEAT = Leather; JTEX = Jute textile; YARN = Yarn; TEXT = textile; WRMG = Woven ready-made garments; KRMG = Knit readymade garments; CHEM= chemicals and fertilizer; PETR = petroleum; OIND= other industries; CEMT = Cement; STEL = Steel; MACH =machinery; CNST= construction; SERV= services. SR and LR refer to years 2006 and 2020 respectively.
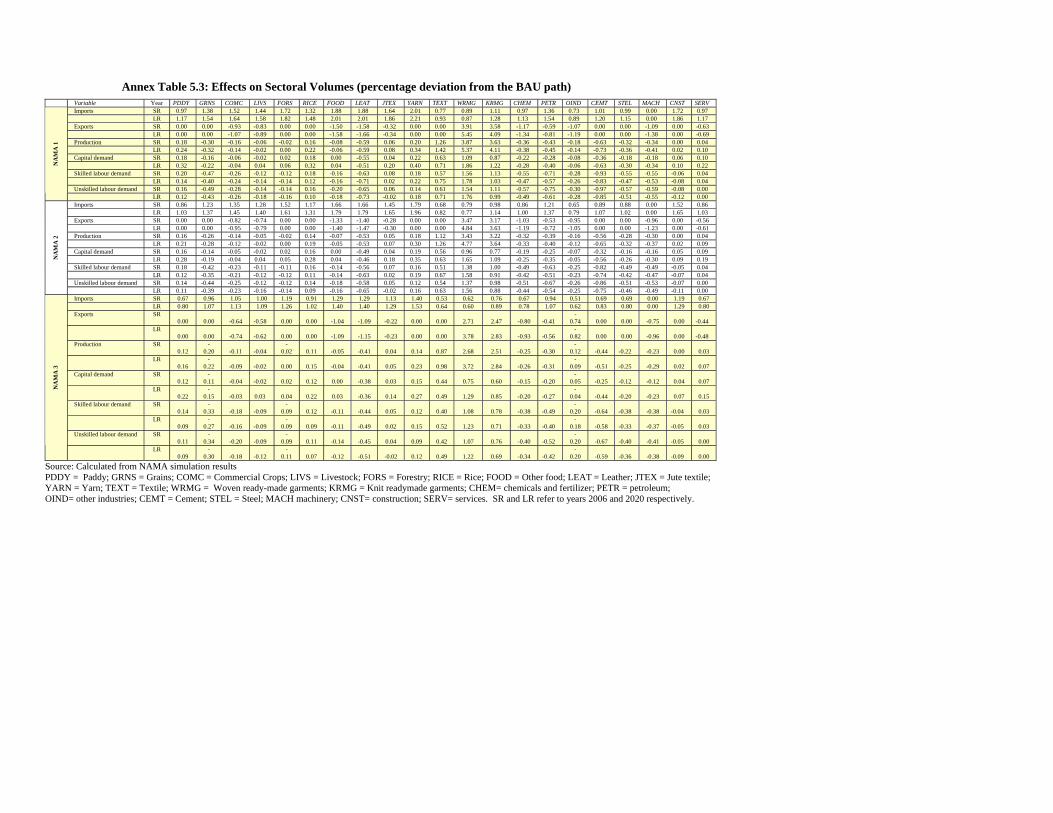
Annex Table 5.3: Effects on Sectoral Volumes (percentage deviation from the BAU path)
Variable Year PDDY GRNS COMC LIVS FORS RICE FOOD LEAT JTEX YARN TEXT WRMG KRMG CHEM PETR OIND CEMT STEL MACH CNST SERV Imports SR 0.97 1.38 1.52 1.44 1.72 1.32 1.88 1.88 1.64 2.01 0.77 0.89 1.11 0.97 1.36 0.73 1.01 0.99 0.00 1.72 0.97 LR 1.17 1.54 1.64 1.58 1.82 1.48 2.01 2.01 1.86 2.21 0.93 0.87 1.28 1.13 1.54 0.89 1.20 1.15 0.00 1.86 1.17 Exports SR 0.00 0.00 -0.93 -0.83 0.00 0.00 -1.50 -1.58 -0.32 0.00 0.00 3.91 3.58 -1.17 -0.59 -1.07 0.00 0.00 -1.09 0.00 -0.63 LR 0.00 0.00 -1.07 -0.89 0.00 0.00 -1.58 -1.66 -0.34 0.00 0.00 5.45 4.09 -1.34 -0.81 -1.19 0.00 0.00 -1.38 0.00 -0.69 Production SR 0.18 -0.30 -0.16 -0.06 -0.02 0.16 -0.08 -0.59 0.06 0.20 1.26 3.87 3.63 -0.36 -0.43 -0.18 -0.63 -0.32 -0.34 0.00 0.04 LR 0.24 -0.32 -0.14 -0.02 0.00 0.22 -0.06 -0.59 0.08 0.34 1.42 5.37 4.11 -0.38 -0.45 -0.14 -0.73 -0.36 -0.41 0.02 0.10 Capital demand SR 0.18 -0.16 -0.06 -0.02 0.02 0.18 0.00 -0.55 0.04 0.22 0.63 1.09 0.87 -0.22 -0.28 -0.08 -0.36 -0.18 -0.18 0.06 0.10 LR 0.32 -0.22 -0.04 0.04 0.06 0.32 0.04 -0.51 0.20 0.40 0.71 1.86 1.22 -0.28 -0.40 -0.06 -0.63 -0.30 -0.34 0.10 0.22 Skilled labour demand SR 0.20 -0.47 -0.26 -0.12 -0.12 0.18 -0.16 -0.63 0.08 0.18 0.57 1.56 1.13 -0.55 -0.71 -0.28 -0.93 -0.55 -0.55 -0.06 0.04 LR 0.14 -0.40 -0.24 -0.14 -0.14 0.12 -0.16 -0.71 0.02 0.22 0.75 1.78 1.03 -0.47 -0.57 -0.26 -0.83 -0.47 -0.53 -0.08 0.04 Unskilled labour demand SR 0.16 -0.49 -0.28 -0.14 -0.14 0.16 -0.20 -0.65 0.06 0.14 0.61 1.54 1.11 -0.57 -0.75 -0.30 -0.97 -0.57 -0.59 -0.08 0.00
NA
MA
1
LR 0.12 -0.43 -0.26 -0.18 -0.16 0.10 -0.18 -0.73 -0.02 0.18 0.71 1.76 0.99 -0.49 -0.61 -0.28 -0.85 -0.51 -0.55 -0.12 0.00 Imports SR 0.86 1.23 1.35 1.28 1.52 1.17 1.66 1.66 1.45 1.79 0.68 0.79 0.98 0.86 1.21 0.65 0.89 0.88 0.00 1.52 0.86 LR 1.03 1.37 1.45 1.40 1.61 1.31 1.79 1.79 1.65 1.96 0.82 0.77 1.14 1.00 1.37 0.79 1.07 1.02 0.00 1.65 1.03 Exports SR 0.00 0.00 -0.82 -0.74 0.00 0.00 -1.33 -1.40 -0.28 0.00 0.00 3.47 3.17 -1.03 -0.53 -0.95 0.00 0.00 -0.96 0.00 -0.56 LR 0.00 0.00 -0.95 -0.79 0.00 0.00 -1.40 -1.47 -0.30 0.00 0.00 4.84 3.63 -1.19 -0.72 -1.05 0.00 0.00 -1.23 0.00 -0.61 Production SR 0.16 -0.26 -0.14 -0.05 -0.02 0.14 -0.07 -0.53 0.05 0.18 1.12 3.43 3.22 -0.32 -0.39 -0.16 -0.56 -0.28 -0.30 0.00 0.04 LR 0.21 -0.28 -0.12 -0.02 0.00 0.19 -0.05 -0.53 0.07 0.30 1.26 4.77 3.64 -0.33 -0.40 -0.12 -0.65 -0.32 -0.37 0.02 0.09 Capital demand SR 0.16 -0.14 -0.05 -0.02 0.02 0.16 0.00 -0.49 0.04 0.19 0.56 0.96 0.77 -0.19 -0.25 -0.07 -0.32 -0.16 -0.16 0.05 0.09 LR 0.28 -0.19 -0.04 0.04 0.05 0.28 0.04 -0.46 0.18 0.35 0.63 1.65 1.09 -0.25 -0.35 -0.05 -0.56 -0.26 -0.30 0.09 0.19 Skilled labour demand SR 0.18 -0.42 -0.23 -0.11 -0.11 0.16 -0.14 -0.56 0.07 0.16 0.51 1.38 1.00 -0.49 -0.63 -0.25 -0.82 -0.49 -0.49 -0.05 0.04 LR 0.12 -0.35 -0.21 -0.12 -0.12 0.11 -0.14 -0.63 0.02 0.19 0.67 1.58 0.91 -0.42 -0.51 -0.23 -0.74 -0.42 -0.47 -0.07 0.04 Unskilled labour demand SR 0.14 -0.44 -0.25 -0.12 -0.12 0.14 -0.18 -0.58 0.05 0.12 0.54 1.37 0.98 -0.51 -0.67 -0.26 -0.86 -0.51 -0.53 -0.07 0.00
NA
MA
2
LR 0.11 -0.39 -0.23 -0.16 -0.14 0.09 -0.16 -0.65 -0.02 0.16 0.63 1.56 0.88 -0.44 -0.54 -0.25 -0.75 -0.46 -0.49 -0.11 0.00 Imports SR 0.67 0.96 1.05 1.00 1.19 0.91 1.29 1.29 1.13 1.40 0.53 0.62 0.76 0.67 0.94 0.51 0.69 0.69 0.00 1.19 0.67 LR 0.80 1.07 1.13 1.09 1.26 1.02 1.40 1.40 1.29 1.53 0.64 0.60 0.89 0.78 1.07 0.62 0.83 0.80 0.00 1.29 0.80 Exports SR
0.00 0.00 -0.64 -0.58 0.00 0.00 -1.04 -1.09 -0.22 0.00 0.00 2.71 2.47 -0.80 -0.41 -
0.74 0.00 0.00 -0.75 0.00 -0.44 LR
0.00 0.00 -0.74 -0.62 0.00 0.00 -1.09 -1.15 -0.23 0.00 0.00 3.78 2.83 -0.93 -0.56 -
0.82 0.00 0.00 -0.96 0.00 -0.48 Production SR
0.12 -
0.20 -0.11 -0.04 -
0.02 0.11 -0.05 -0.41 0.04 0.14 0.87 2.68 2.51 -0.25 -0.30 -
0.12 -0.44 -0.22 -0.23 0.00 0.03 LR
0.16 -
0.22 -0.09 -0.02 0.00 0.15 -0.04 -0.41 0.05 0.23 0.98 3.72 2.84 -0.26 -0.31 -
0.09 -0.51 -0.25 -0.29 0.02 0.07 Capital demand SR
0.12 -
0.11 -0.04 -0.02 0.02 0.12 0.00 -0.38 0.03 0.15 0.44 0.75 0.60 -0.15 -0.20 -
0.05 -0.25 -0.12 -0.12 0.04 0.07 LR
0.22 -
0.15 -0.03 0.03 0.04 0.22 0.03 -0.36 0.14 0.27 0.49 1.29 0.85 -0.20 -0.27 -
0.04 -0.44 -0.20 -0.23 0.07 0.15 Skilled labour demand SR
0.14 -
0.33 -0.18 -0.09 -
0.09 0.12 -0.11 -0.44 0.05 0.12 0.40 1.08 0.78 -0.38 -0.49 -
0.20 -0.64 -0.38 -0.38 -0.04 0.03 LR
0.09 -
0.27 -0.16 -0.09 -
0.09 0.09 -0.11 -0.49 0.02 0.15 0.52 1.23 0.71 -0.33 -0.40 -
0.18 -0.58 -0.33 -0.37 -0.05 0.03 Unskilled labour demand SR
0.11 -
0.34 -0.20 -0.09 -
0.09 0.11 -0.14 -0.45 0.04 0.09 0.42 1.07 0.76 -0.40 -0.52 -
0.20 -0.67 -0.40 -0.41 -0.05 0.00
NA
MA
3
LR 0.09
-0.30 -0.18 -0.12
-0.11 0.07 -0.12 -0.51 -0.02 0.12 0.49 1.22 0.69 -0.34 -0.42
-0.20 -0.59 -0.36 -0.38 -0.09 0.00
Source: Calculated from NAMA simulation results PDDY = Paddy; GRNS = Grains; COMC = Commercial Crops; LIVS = Livestock; FORS = Forestry; RICE = Rice; FOOD = Other food; LEAT = Leather; JTEX = Jute textile; YARN = Yarn; TEXT = Textile; WRMG = Woven ready-made garments; KRMG = Knit readymade garments; CHEM= chemicals and fertilizer; PETR = petroleum; OIND= other industries; CEMT = Cement; STEL = Steel; MACH machinery; CNST= construction; SERV= services. SR and LR refer to years 2006 and 2020 respectively.

Annex Table 5.4: Effects on Income and Welfare (percentage deviation from the BAU path) Variable Rural Households Urban Households
Year Landless Marginal farmer
Small farmer
Large farmer
Non- Agricultural
Illiterate
Low educati
on
Med educati
on
High educati
on Income SR 1.12 1.10 1.08 1.04 1.10 1.10 1.08 1.08 1.06
LR 1.23 1.19 1.17 1.14 1.19 1.21 1.19 1.17 1.16
CPI SR 0.86 0.86 0.86 0.86 0.86 0.86 0.86 0.88 0.88
LR 0.89 0.89 0.89 0.89 0.89 0.91 0.91 0.93 0.93
EVs SR 0.26 0.22 0.19 0.09 0.20 0.22 0.19 0.15 0.07
NA
MA
1
LR 0.32 0.28 0.22 0.13 0.26 0.28 0.24 0.19 0.07
Income SR 0.94 0.93 0.91 0.88 0.93 0.93 0.91 0.91 0.90
LR 1.04 1.01 0.99 0.96 1.01 1.02 1.01 0.99 0.98
CPI SR 0.72 0.72 0.72 0.72 0.72 0.72 0.72 0.74 0.74
LR 0.76 0.76 0.76 0.76 0.76 0.77 0.77 0.79 0.79
EVs SR 0.22 0.19 0.16 0.08 0.17 0.19 0.16 0.13 0.06
NA
MA
2
LR 0.27 0.24 0.19 0.11 0.22 0.24 0.20 0.16 0.06
Income SR 0.74 0.73 0.72 0.70 0.73 0.73 0.72 0.72 0.71
LR 0.85 0.83 0.81 0.79 0.83 0.84 0.83 0.81 0.80
CPI SR 0.57 0.57 0.57 0.57 0.57 0.57 0.57 0.58 0.58
LR 0.62 0.62 0.62 0.62 0.62 0.63 0.63 0.65 0.65
EVs SR 0.17 0.15 0.13 0.06 0.13 0.15 0.13 0.10 0.05
NA
MA
3
LR 0.22 0.20 0.16 0.09 0.18 0.20 0.16 0.13 0.05 Source: Calculated from NAMA simulation results Note: SR and LR refer to years 2006 and 2020 respectively.
EV measures the welfare of the household

Annex Table 5.5: Poverty in the BAU Scenario, and the Effects of different NAMA s on Household Poverty (percentage deviation from the BAU path)
Rural Households Urban Households
Scenarios Poverty Index
Year Landless Marginal farmer
Small farmer
Large farmer
Non Agricultura
l
Total Rural
Illiterate Low education
Medium education
High education
Total Urban
P0 2000 73.61 64.22 47.93 23.04 45.52 51.52 70.72 30.51 7.74 0.00 39.11 SR 69.32 55.31 41.81 18.21 41.11 46.33 65.52 26.63 6.03 0.00 35.53 LR 39.81 28.61 15.81 6.02 19.02 22.42 38.731 11.32 1.41 0.00 19.02
P1 2000 23.01 17.22 11.32 4.82 12.32 14.13 22.34 7.52 1.52 0.00 11.44 SR 19.92 14.43 9.03 3.81 10.33 11.84 19.42 6.14 1.23 0.00 9.82 LR 8.11 4.91 2.61 0.73 3.52 4.21 8.51 1.74 0.44 0.00 3.91
P2 2000 9.21 6.31 3.73 1.42 4.54 5.22 9.31 2.51 0.52 0.00 4.53 SR 7.52 5.02 2.92 1.04 3.61 4.23 7.74 1.93 0.41 0.00 3.72
BA
U S
cena
rio
LR 2.52 1.33 0.71 0.10 1.02 1.24 2.83 0.41 0.11 0.00 1.32 P0 SR -0.13 -0.11 -0.09 -0.05 -0.10 -0.10 -0.11 -0.09 -0.07 0.00 -0.09
LR -0.15 -0.14 -0.11 -0.06 -0.13 -0.12 -0.14 -0.12 -0.08 0.00 -0.11 P1 SR -0.05 -0.04 -0.04 -0.02 -0.04 -0.04 -0.04 -0.04 -0.03 0.00 -0.04
LR -0.06 -0.06 -0.04 -0.03 -0.05 -0.05 -0.06 -0.05 -0.03 0.00 -0.05 P2 SR -0.02 -0.01 -0.01 -0.01 -0.01 -0.01 -0.01 -0.01 -0.01 0.00 -0.01 N
AM
A 1
LR -0.02 -0.02 -0.01 -0.01 -0.02 -0.02 -0.02 -0.02 -0.01 0.00 -0.02 P0 SR -0.11 -0.09 -0.08 -0.04 -0.08 -0.09 -0.09 -0.08 -0.06 0.00 -0.08
LR -0.13 -0.11 -0.09 -0.05 -0.11 -0.10 -0.11 -0.10 -0.07 0.00 -0.09 P1 SR -0.04 -0.04 -0.03 -0.02 -0.03 -0.03 -0.04 -0.03 -0.02 0.00 -0.03
LR -0.05 -0.05 -0.04 -0.02 -0.04 -0.04 -0.05 -0.04 -0.03 0.00 -0.04 P2 SR -0.02 -0.01 -0.01 -0.01 -0.01 -0.01 -0.01 -0.01 -0.01 0.00 -0.01 N
AM
A 2
LR -0.02 -0.02 -0.01 -0.01 -0.02 -0.01 -0.02 -0.01 -0.01 0.00 -0.01 P0 SR -0.09 -0.07 -0.06 -0.03 -0.06 -0.07 -0.07 -0.06 -0.05 0.00 -0.06
LR -0.11 -0.09 -0.07 -0.04 -0.09 -0.08 -0.09 -0.08 -0.06 0.00 -0.07 P1 SR -0.03 -0.03 -0.02 -0.02 -0.02 -0.02 -0.03 -0.02 -0.02 0.00 -0.02
LR -0.04 -0.04 -0.03 -0.02 -0.03 -0.03 -0.04 -0.03 -0.02 0.00 -0.03 P2 SR -0.02 -0.01 -0.01 -0.01 -0.01 -0.01 -0.01 -0.01 -0.01 0.00 -0.01 N
AM
A 3
LR -0.02 -0.02 -0.01 -0.01 -0.02 -0.01 -0.02 -0.01 -0.01 0.00 -0.01
Source: Calculated from the HIES 2000 and NAMA simulation results Note: SR and LR refer to years 2006 and 2020 respectively. P0 is the poverty headcount ratio (percentage of poor); P1 is the poverty gap (depth); and P2 is the squared poverty gap (severity).
CHAPTER SIX
Selim Raihan and Abdur Razzaque SAFTA and other Regional Trading Arrangements (RTAs) in South Asia: The Stakes of Bangladesh
6.1. Introduction Recently, there has been increased interest in regional economic integration in South Asia. And with the stalemate of the WTO negotiations, it is expected that the interest in regional trading arrangements will increase. A first step in this direction came in 1995 when the SAARC Preferential Trading Arrangement (SAPTA) was signed. In early 2004, the SAARC member countries agreed to form a South Asian Free Trade Area (SAFTA). The SAFTA is a parallel initiative to the multilateral trade liberalisation commitments of SAARC member countries. SAFTA has come into force from 1 July 2006, with the aim of boosting trade among the seven SAARC members. Apart from SAFTA, Bangladesh has been involved in other initiatives for regional integration or bilateral preferential trading arrangements. Examples are BIMSTEC, the Generalized System of Trade Preferences (GSTP) negotiations, negotiations for Bangladesh’s bilateral trade agreements with other South Asian countries (e.g. India, Pakistan), or with country outside the region (e.g. the USA).
S A F T A A N D O T H E R R E G I O N A L T R A D I N G A R R A N G E M E N T S ( R T A S ) I N
S O U T H A S I A : T H E S T A K E S O F B A N G L A D E S H
137There have been some strong arguments for the regional economic
integration in South Asia, as this integration is thought to generate significant intraregional trade and welfare gains for the South Asian countries. However, critics have pointed out that the potential benefits from the SAFTA and other regional trading arrangements in South Asia are little as there are limited complementarities in the region; and also major trading partners of the individual South Asian countries are located in the West. It is also alleged that an RTA in South Asia will lead to substantial trade diversion than trade creation for some of the member countries and it may work as a stumbling bloc to multilateral trade liberalisation. There are also significant concerns among the stockholders in Bangladesh about the prospects of SAFTA and different bilateral FTAs involving Bangladesh, and their possible impacts on the economy. Given the aforementioned discussion, it is therefore imperative to examine the impacts of the SAFTA and some other proposed FTA on the economy of Bangladesh.
Against backdrop of the aforementioned discussion, this chapter evaluates SAFTA agreements as well as negotiations on different regional and bilateral agreements in which Bangladesh is taking part. Furthermore, this chapter, using the global general equilibrium model (the GTAP model), explores the welfare implications of SAFTA for the economy of Bangladesh. The structure of this paper is as follows: in Sections 6.2, 6.3, 6.4 and 6.5 the issues involving SAFTA, BIMSTEC, and FTAs of Bangladesh with India, Pakistan and the USA are analysed. In Section 6.6 some stylized facts about the inter-regional trade in South Asia are presented. Section 6.7 analyses the theoretical propositions on the welfare effects of regional trading arrangements (RTA). In Section 6.8 the GTAP model is used to examine the trade creation and trade diversion effects of SAFTA for the member countries general and Bangladesh in particular. Finally Section 6.9 concludes. 6.2. The South Asian Free Trade Area (SAFTA) South Asian Association for Regional Cooperation (SAARC) was, formally setup in 1985 following a proposal by the government of Bangladesh in 1980. However the issues of economic cooperation were deliberately kept outside its purview. Initially SAARC's activities was
W T O A N D R E G I O N A L T R A D E N E G O T I A T I O N O U T C O M E S : Q U A N T I T A T I V E
A S S E S S M E N T S O F P O T E N T I A L I M P L I C A T I O N S O N B A N G L A D E S H
138 confined to nine ``non-controversial'' areas of regional cooperation - transport, communication, science and technology, education, culture, health, population, sports and arts. During the early 1990s there was a surge in regional arrangements in the world. Out of 109 regional Agreements notified to GATT from 1947 to the end of 1994, 33 were notified between 1990 and 1994. The experience of the growth and consolidation of various regional blocks brought to fore the realisation that core economic areas need to be brought within the scope of SAARC activities if the objective of bringing about accelerated social and economic development in the region through mutual cooperation was to materialize. Based on the recommendation of SAARC study on Trade, Manufactures and services the Committee on Economic Cooperation was set up, and the Sixth Summit of Heads of the states or Governments declared their commitment to initiate cooperation in economic areas initially in trade, and agreed to formulate an agreement on an institutional framework for trade liberalisation among themselves. Thus a framework agreement on South Asian Preferential Trading Arrangement (SAPTA) was finalised and signed in 1993 in the Seventh Summit held in Dhaka in 1993. The SAPTA Agreement came into force in December 1995 after the conclusion of First Round of negotiations in April 1995. Since then three other rounds were concluded and tariff concessions were exchanged on around 5000 products. However, there had been no substantial trade under SAPTA.
The idea of creating a free trade area in South Asia was mooted in the 19th session of SAARC Ministerial Council held in December 1995 after SAPTA came into force, and a group of expert was formed to develop a work programme for moving from SAPTA to SAFTA. However, the Group could not come with any tangible outscore. Later during the 10th SARRC summit the Head of the SAARC states/Governments had decided to enter into a free trade area in the SAARC region. Accordingly the summit directed to establish a Committee of Experts and directed the Committee to draft a comprehensive treaty on SAFTA by 2001. The Committee of Experts first met in August 1999 but it took four years to reach an agreement on SAFTA. The Agreement was signed on 6 January 2004 during the 12th SAARC Summit.
The Agreement on SAFTA was signed without any agreement on the sensitive lists, rules of origin, mechanism for compensation of revenue
S A F T A A N D O T H E R R E G I O N A L T R A D I N G A R R A N G E M E N T S ( R T A S ) I N
S O U T H A S I A : T H E S T A K E S O F B A N G L A D E S H
139losses for the least developed countries and areas for technical assistance for LDCs. However, the Summit directed to continue the work of the Committee of Experts to conclude negotiation on these issues in order to operationalise SAFTA from 1 January 2006. The Committee of Experts concluded negotiations in December 2005 and SAFTA came into force on 1 January 2006. However, there was a delay in commencement of trade liberalisation programme due to procedural requirement for ratification of the Agreement. It was therefore agreed that tariff reduction programme would commence on 1 July 2006. At the same time it was agreed that time frame for reduction of tariff would remain unchanged. 6.2.1. Salient Features of the Agreement on SAFTA The Agreement on SAFTA has seven core elements:
• Trade liberalisation Programme • Rules of Origin • Institutional Arrangements • Revenue Compensation Mechanism • Technical Assistance for LDCs • Safeguard Measures • Consultations and Dispute Settlement Procedures
6.2.1.1. Trade Liberalisation Programme
As per Article 7 of the Agreement, tariffs on all products except the products under sensitive lists would be reduced to 0-5 percent within time frames agreed for LDCs and non- LDCs. The Agreement stipulates that SAFTA Committee of Experts would review non-tariff barriers in its regular meeting with a view to eliminating them or making them non-restrictive.
The Agreement provides different timeframe for tariff reduction by LDCs and non-LDCs. Moreover, non-LDCs are required to reduce their tariffs for the products of LDCs within shorter period. Their tariffs applied on 1 January 2006 should be reduced to 0-5 percent among themselves within seven years (with one extra year for Sri Lanka) (table 6.1).
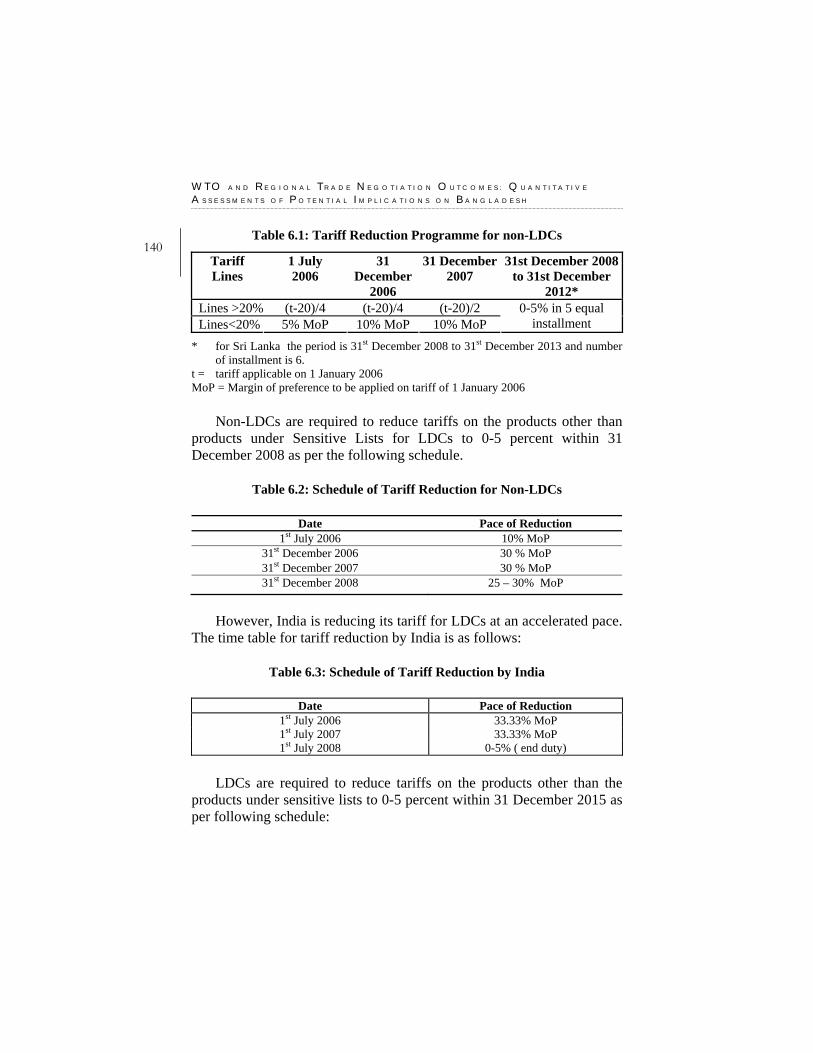
W T O A N D R E G I O N A L T R A D E N E G O T I A T I O N O U T C O M E S : Q U A N T I T A T I V E
A S S E S S M E N T S O F P O T E N T I A L I M P L I C A T I O N S O N B A N G L A D E S H
140 Table 6.1: Tariff Reduction Programme for non-LDCs
Tariff Lines
1 July 2006
31 December
2006
31 December 2007
31st December 2008 to 31st December
2012* Lines >20% (t-20)/4 (t-20)/4 (t-20)/2 Lines<20% 5% MoP 10% MoP 10% MoP
0-5% in 5 equal installment
* for Sri Lanka the period is 31st December 2008 to 31st December 2013 and number of installment is 6.
t = tariff applicable on 1 January 2006 MoP = Margin of preference to be applied on tariff of 1 January 2006
Non-LDCs are required to reduce tariffs on the products other than
products under Sensitive Lists for LDCs to 0-5 percent within 31 December 2008 as per the following schedule.
Table 6.2: Schedule of Tariff Reduction for Non-LDCs
Date Pace of Reduction 1st July 2006 10% MoP
31st December 2006 30 % MoP 31st December 2007 30 % MoP 31st December 2008 25 – 30% MoP
However, India is reducing its tariff for LDCs at an accelerated pace.
The time table for tariff reduction by India is as follows:
Table 6.3: Schedule of Tariff Reduction by India
Date Pace of Reduction 1st July 2006 33.33% MoP 1st July 2007 33.33% MoP 1st July 2008 0-5% ( end duty)
LDCs are required to reduce tariffs on the products other than the
products under sensitive lists to 0-5 percent within 31 December 2015 as per following schedule:
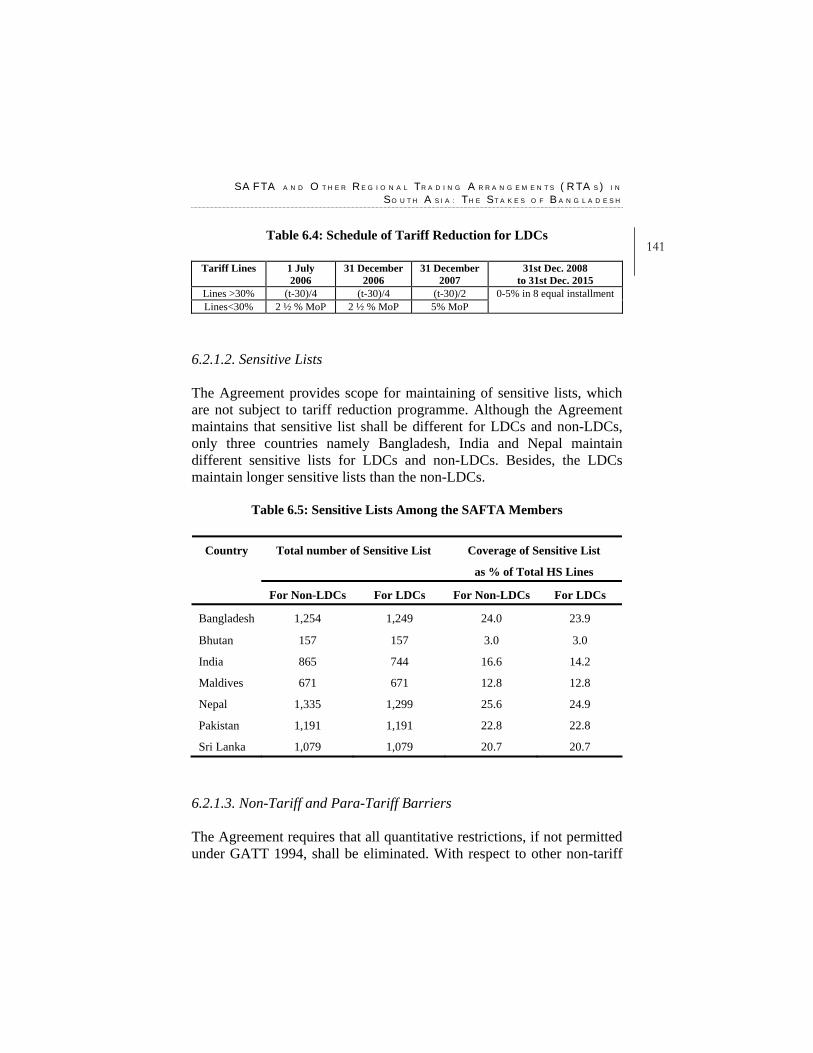
S A F T A A N D O T H E R R E G I O N A L T R A D I N G A R R A N G E M E N T S ( R T A S ) I N
S O U T H A S I A : T H E S T A K E S O F B A N G L A D E S H
141Table 6.4: Schedule of Tariff Reduction for LDCs
Tariff Lines 1 July
2006 31 December
2006 31 December
2007 31st Dec. 2008
to 31st Dec. 2015 Lines >30% (t-30)/4 (t-30)/4 (t-30)/2 Lines<30% 2 ½ % MoP 2 ½ % MoP 5% MoP
0-5% in 8 equal installment
6.2.1.2. Sensitive Lists The Agreement provides scope for maintaining of sensitive lists, which are not subject to tariff reduction programme. Although the Agreement maintains that sensitive list shall be different for LDCs and non-LDCs, only three countries namely Bangladesh, India and Nepal maintain different sensitive lists for LDCs and non-LDCs. Besides, the LDCs maintain longer sensitive lists than the non-LDCs.
Table 6.5: Sensitive Lists Among the SAFTA Members
Total number of Sensitive List Coverage of Sensitive List
as % of Total HS Lines
Country
For Non-LDCs For LDCs For Non-LDCs For LDCs
Bangladesh 1,254 1,249 24.0 23.9
Bhutan 157 157 3.0 3.0
India 865 744 16.6 14.2
Maldives 671 671 12.8 12.8
Nepal 1,335 1,299 25.6 24.9
Pakistan 1,191 1,191 22.8 22.8
Sri Lanka 1,079 1,079 20.7 20.7
6.2.1.3. Non-Tariff and Para-Tariff Barriers The Agreement requires that all quantitative restrictions, if not permitted under GATT 1994, shall be eliminated. With respect to other non-tariff
W T O A N D R E G I O N A L T R A D E N E G O T I A T I O N O U T C O M E S : Q U A N T I T A T I V E
A S S E S S M E N T S O F P O T E N T I A L I M P L I C A T I O N S O N B A N G L A D E S H
142 measures and para-tariff measures the Agreement requires that the countries notify the measures to SAARC Secretariat on an annual basis, and SAFTA Committee of Experts (COE) review the non-tariff and para-tariff barriers in its regular meeting with a view to making recommendation for their elimination or making them non-restrictive. The Agreement also requires that “The initial notification shall be made within three months from the date of coming into force of the Agreement and the COE shall review the notifications in its first meeting and take appropriate decisions”. In order to implement commitment of this provisions a sub-group on non-tariff measures has already been established. 6.2.1.4. Rules of Origin
Rules of origin are one of the most important aspects of any free trade area. The Rules of Origin agreed under SAFTA are general in nature (i.e. one criterion for all products) barring 1991 products for which product specific rules are applied. Thus, SAFTA Rules of Origin requires that in order to enjoy the preference under SAFTA a product must undergo sufficient processing for changing the tariff heading from the non-originating inputs and for having value of at least 40 percent value addition measures as percentage of fob value. However, value addition requirement is lower for Sri Lanka and LDCs, which is 35 percent and 30 percent respectively. In order to avoid fraudulent practices detailed operational certification procedures have been adopted. 6.2.1.5. Institutional Arrangement
In order to monitor the implementation of SAFTA Agreement two bodies namely SAFTA Ministerial Council and Committee of Experts have been established. SAFTA Ministerial Council (SMC), comprising commerce/trade minister of member countries, is the highest decision making body of SAFTA. The Council shall meet once in a year or more often. SMC will be supported by the SAFTA Committee of Experts, comprising senior trade officials of member countries, which will meet once in every six months.
S A F T A A N D O T H E R R E G I O N A L T R A D I N G A R R A N G E M E N T S ( R T A S ) I N
S O U T H A S I A : T H E S T A K E S O F B A N G L A D E S H
1436.2.1.6. Mechanism for Compensation of Revenue loss
A mechanism has been established to compensate the revenue loss to be incurred by the LDCs due to reduction of tariffs. The compensation will be in cash and partial: maximum five percent of the customs duty collected from SAARC import in 2005. Compensation will be available for four years only (for Maldives compensation will be available for six years).
6.2.1.7. Technical Assistance for LDCs
There are provisions for technical assistance for LDCs at their request. Areas of technical assistance, as agreed upon, are as follows:
• Capacity building (Trade related) • Development and improvement of tax policy and instruments • Customs procedures related measures • Legislative and policy related measures, and assistance for
improvement of national capacity • Studies on trade related physical infrastructural development,
improvement of banking sector, and development of export financing
6.2.1.8. Safeguard Measures
In order to protect domestic industry from possible injury due to increased preferential import, the Agreement provided scope for partial or full withdrawal of preference granted under SAFTA for a period of maximum three years. Safeguard measures cannot be applied against the product of LDCs if share of import from an LDC of the product concerned in total import of importing country is less than five percent.
W T O A N D R E G I O N A L T R A D E N E G O T I A T I O N O U T C O M E S : Q U A N T I T A T I V E
A S S E S S M E N T S O F P O T E N T I A L I M P L I C A T I O N S O N B A N G L A D E S H
144 6.2.1.9. Consultations and Dispute Settlement Procedures
There is a specific article on dispute settlement mechanism with specific time table. Bilateral consultation shall be held within 30 days upon a request made by any member. If dispute cannot be settled through bilateral consultation, the matter will be referred to the COE for its recommendation within 60 days. The COE may consult with a panel of experts for peer review. Any decision of the COE can be appealed to SMC for its decision within 60 days. The decision of the SMC will be the final. 6.3. Bay of Bengal Initiatives on Multi-Sectoral Technical and
Economic Cooperation (BIMSTEC) The idea of establishing Bangladesh-India-Thailand-Sri Lanka Economic Cooperation was first initiated by Thailand in 1994 to explore economic cooperation on a sub regional basis involving contiguous countries of South and South East Asia surrounding the Bay of Bengal. It was formally launched as BIST-EC (Bangladesh-India-Sri Lanka-Thailand Economic Cooperation) on 6 June 1997 in Bangkok with the adoption of the Bangkok declaration. In a special ministerial meeting, held in Bangkok on 22 December 1997, Myanmar was accorded full membership of the group, and following the Myanmar’s entry it was renamed as BIMST-EC (Bangladesh-India-Myanmar-Sri Lanka-Thailand Economic Cooperation). At the Ministerial meeting held in February 2004, Bhutan and Nepal were welcomed as new members. Subsequently, the Grouping was renamed as “Bay of Bengal Initiatives on Multi-Sectoral Technical and Economic Cooperation (BIMSTEC).
Unlike SAARC, BIMSTEC was established to promote economic cooperation in the region. Accordingly, during the second Ministerial meeting, member countries identified six areas of cooperation namely trade and investment, technology, transport and communication, fisheries, energy and tourism. Idea of identifying these sectors was to enhance cooperation in these sectors through identification and implementation of specific cooperation projects. From the beginning of the initiation of BIMSTEC, stress was given to the active participation of the private sector, and accordingly private sector representatives also participated actively in the sectoral committees.

S A F T A A N D O T H E R R E G I O N A L T R A D I N G A R R A N G E M E N T S ( R T A S ) I N
S O U T H A S I A : T H E S T A K E S O F B A N G L A D E S H
145Despite the fact that BIMSTEC was primarily established for
promoting economic cooperation in the region, member countries adopted a step-by-step approach to establish a free trade area in the region. Trade/economic ministers at their second meeting, held in April 2000 in New Delhi, established an Inter-Governmental group with a mandate to prepare a concept paper on possible approaches towards a free trade area. As per recommendation of the Inter-Government Group, third trade/economic ministers meeting established a Group of Experts (GOE), which recommended adopting a negative list approach for moving towards a free trade area in the region. Later, the 4th BIMSTEC trade/economic ministers meeting, held in Colombo on 7th March 2003, decided to establish a Group of Experts led by Sri Lanka to draft the Framework Agreement of the BIMSTEC FTA.
The GOE met four times and finalized a draft framework Agreement on BIMSTEC FTA in December 2003, which was subsequently adopted by the Senior Trade/Economic official meeting and signed by all member countries except Bangladesh during the first BIMSTEC Summit, held in February 2004. Bangladesh signed the Agreement on 25 June 2004. The Agreement came into force on 30 June 2004. 6.3.1. Core Elements of the Framework Agreement Unlike SAFTA, the Framework Agreement on BIMSTEC FTA covers trade in service and investment in addition to trade in goods. However, the framework only fixes the timeframe for tariff liberalisation in trade in goods, and requires member countries to enter into negotiations on various issues of trade in goods, trade in services and investment through a positive list approach; and other areas of economic cooperation. For this purpose it requires the establishment of Trade Negotiating Committee. Thus, the Framework Agreement is only a “Mother Agreement” which sets the road map for a building block approach to a Free Trade Area.
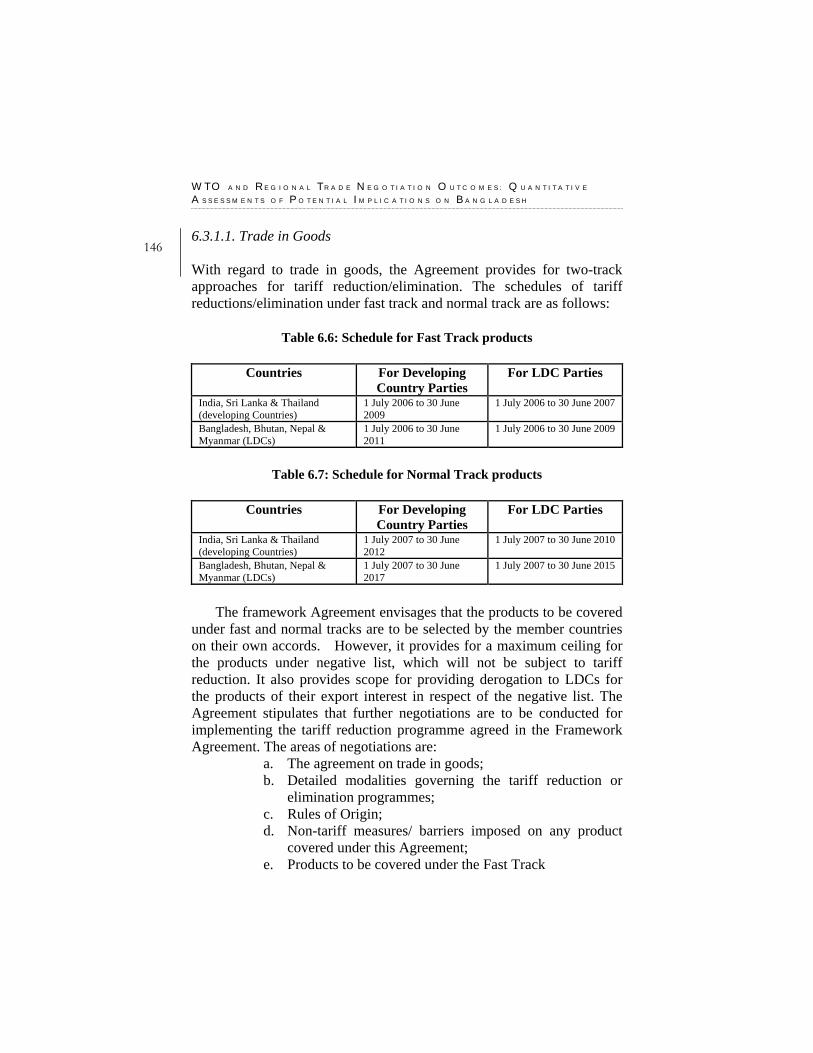
W T O A N D R E G I O N A L T R A D E N E G O T I A T I O N O U T C O M E S : Q U A N T I T A T I V E
A S S E S S M E N T S O F P O T E N T I A L I M P L I C A T I O N S O N B A N G L A D E S H
146 6.3.1.1. Trade in Goods With regard to trade in goods, the Agreement provides for two-track approaches for tariff reduction/elimination. The schedules of tariff reductions/elimination under fast track and normal track are as follows:
Table 6.6: Schedule for Fast Track products
Countries For Developing Country Parties
For LDC Parties
India, Sri Lanka & Thailand (developing Countries)
1 July 2006 to 30 June 2009
1 July 2006 to 30 June 2007
Bangladesh, Bhutan, Nepal & Myanmar (LDCs)
1 July 2006 to 30 June 2011
1 July 2006 to 30 June 2009
Table 6.7: Schedule for Normal Track products
Countries For Developing
Country Parties For LDC Parties
India, Sri Lanka & Thailand (developing Countries)
1 July 2007 to 30 June 2012
1 July 2007 to 30 June 2010
Bangladesh, Bhutan, Nepal & Myanmar (LDCs)
1 July 2007 to 30 June 2017
1 July 2007 to 30 June 2015
The framework Agreement envisages that the products to be covered
under fast and normal tracks are to be selected by the member countries on their own accords. However, it provides for a maximum ceiling for the products under negative list, which will not be subject to tariff reduction. It also provides scope for providing derogation to LDCs for the products of their export interest in respect of the negative list. The Agreement stipulates that further negotiations are to be conducted for implementing the tariff reduction programme agreed in the Framework Agreement. The areas of negotiations are:
a. The agreement on trade in goods; b. Detailed modalities governing the tariff reduction or
elimination programmes; c. Rules of Origin; d. Non-tariff measures/ barriers imposed on any product
covered under this Agreement; e. Products to be covered under the Fast Track

S A F T A A N D O T H E R R E G I O N A L T R A D I N G A R R A N G E M E N T S ( R T A S ) I N
S O U T H A S I A : T H E S T A K E S O F B A N G L A D E S H
147f. Products to be covered under the Normal Track g. Products coverage under the Negative Lists; h. Detailed procedures for safeguards based on GATT
principles;
The Agreement envisaged that negotiations on the aforesaid areas were to be conducted during the period between July 2004 and December 2005 so that tariff reduction/elimination programme could commence on 1 July 2006. 6.3.1.2. Trade in Services and Investment The Framework Agreement provides for entering into negotiations to progressively liberalise trade in services with substantial sectoral coverage through a Positive List approach with a view to progressively eliminating substantially all discrimination between or among the parties, and/or prohibition of new or more discriminatory measures. Besides, The Agreement also provides for arrangements to promote and protect investments, progressively liberalise investment regimes and strengthen cooperation for facilitating investment in tandem with liberalisation of trade in goods and services. The Framework Agreement envisaged that negotiations on trade in services and investment would commence in 2005 and would be concluded by 2007. However, the identification of the sectors of services and investments and the pace of liberalisation should be finalised for implementation subsequently in accordance with the timeframes to be mutually agreed upon; by taking into account the sensitive sectors of the parties, and with special and differential treatment and flexibility for the LDC parties. 6.3.1.3. Dispute Settlement Mechanism The Agreement provided for detailed dispute settlement procures and mechanism to be negotiated and concluded by December 2005. However, no significant progress has been made to date.
W T O A N D R E G I O N A L T R A D E N E G O T I A T I O N O U T C O M E S : Q U A N T I T A T I V E
A S S E S S M E N T S O F P O T E N T I A L I M P L I C A T I O N S O N B A N G L A D E S H
148 6.3.1.4. Institutional Arrangement The agreement establishes the institutional arrangement for conducting negotiations to make the Agreement operational. For this purpose, it establishes Trade Negotiating Committee for conducting negotiations, which reports to the BIMSTEC erade/ economic ministers through the Senior Trade and Economic Officials Meeting on the progress and outcome of its negotiations. 6.3.2. Current Sate of Negotiations on BIMSTEC As per the Framework Agreement, Trade Negotiating Committee (TNC) has been established under the chairmanship of Thailand. The TNC had its first meeting in September 2004. As of June 2006 the TNC met 11 times. However, the TNC could not reach agreements on issues required to be settled for commencing the tariff reduction programme from 1 July 2006. As a result, it is obvious that tariff reduction programme could not commence on the agreed date. As of June 2006, the TNC agreed on draft text of the Agreement on Trade in Goods. It was also agreed that tariffs on the products under the fast track approach would be eliminated, while the tariffs under the normal track will be reduced to 0-5 percent. Although the member countries are free to select the products for reducing the tariffs within the range of 0 and 5 percent, they are required to specify the tariffs to be applied at the end of the implementation period in the schedules of concessions. The members are yet to reach consensus on Rules of Oigin, size of the negative list, minimum number of products to be covered under the fast track approach, safeguard mechanism etc.
The TNC has already initiated negotiations on Trade in Services and Investment, which are still at the preliminary stage. It seems that full fledged negotiations on these issues would commence after concluding the negotiations on trade in goods.
S A F T A A N D O T H E R R E G I O N A L T R A D I N G A R R A N G E M E N T S ( R T A S ) I N
S O U T H A S I A : T H E S T A K E S O F B A N G L A D E S H
1496.4. Bangladesh’s Negotiations on Bilateral FTAs with India,
Pakistan and the USA The indicator of bilateral trade between Bangladesh and India has been showing deficit position of Bangladesh for over the years. There is also considerable incidence of informal trade between India and Bangladesh as a consequence of trade restrictions on the free flow of goods. The volume of unofficial exports to Bangladesh from India is reportedly in the range of US$ 350 million to US$ 500 million every year.
With a view to strengthen the intra-regional economic cooperation and the development of national economics at the meetings of the business people of India and Bangladesh as well as at the joint meetings of the policy makers of these two countries, the need to establish and promote free trade arrangements between India and Bangladesh has been highlighted in recent years. The expected benefits of such a proposed FTA between India and Bangladesh include the duty free entry for all goods, except those included in a short negotiated negative list, as well as the elimination of all non-tariff barriers in a time-bound framework. From the Bangladesh perspective, it is argued that an assured access to the large Indian market within a long-term contractual framework will enable Bangladesh to create export capacity for even those products in which it has potential competitive advantage, but which currently do not figure in the export basket. It is also hoped that such assured access would result in an enlarged flow of foreign private capital for investment towards building export capacity in Bangladesh. Furthermore, such an FTA can provide for measures for deeper integration, such as freeing of trade in services, free flow of investments, trade facilitation, harmonisation and mutual recognition of standard and coordination of macro-economic policies. Besides these, such an FTA is likely to improve the overall competitiveness of the Bangladesh economy through access to the marketing network, skill and technology of Indian manufacturers and trading partners. It is, however, important to note that no significant progress has been made with respect to the FTA between Bangladesh and India. Non-tariff barrier appears to be one of the major impediments to cut the trade deficit with India. There is a need for regular dialogue on the standoff issues existing between the two countries to boost bilateral trade.
W T O A N D R E G I O N A L T R A D E N E G O T I A T I O N O U T C O M E S : Q U A N T I T A T I V E
A S S E S S M E N T S O F P O T E N T I A L I M P L I C A T I O N S O N B A N G L A D E S H
150 There is also an ongoing negotiation between Bangladesh and
Pakistan to establish an FTA between these two countries in order to foster bilateral trade and economic cooperation. The FTA is expected to spur business and trade between these two countries. In the trade negotiations the need of raising of trade to US$ 1 billion between the two countries has been highlighted. It is also stressed that trade between the two countries was being hampered due to absence of direct shipping line between Chittagong and Karachi. Pakistan has thus proposed to open bilateral shipping services to promote bilateral trade. Pakistan has also proposed to invest in Bangladesh in vertical integration of the country’s textile sector.
Bangladesh and the USA is also in the process of signing a Trade and Investment Framework Agreement (TIFA). The agreement is about to establish a "US-Bangladesh Council" on trade and investment issues. This council will establish different working groups and will identify and work toward the removal of impediments to trade and investment flows. It also aims for adequate and effective protection and enforcement of Intellectual Property Rights and labour laws and improving the observance internationally recognised core labour standards. However, there have been several criticisms on TIFA. Though the interests of these two countries are different in WTO trade negotiations, the short-term objective of this agreement is about "strengthening cooperative efforts to complete successfully the Doha Development Agenda". It is feared that this binding will undermine Bangladesh’s role in the LDC initiatives in the WTO multilateral negotiations. 6.5. Inter-Regional Trade in South Asia: Some Stylized Facts Table 6.8 suggests that intra-regional imports among the South Asian countries as a share of their world imports is very low, only 4.45 percent. However, there are differences among individual countries in South Asia in this regard. For example, India’s total imports from other South Asian countries is only 0.86 percent of her total imports from all over the world. Nepal’s share in this regard is the highest in South Asia, as Nepal is heavily dependent on India for her imports. Bangladesh’s share is 20.3 percent, which is primarily imports from India. Figure 6.1 shows that
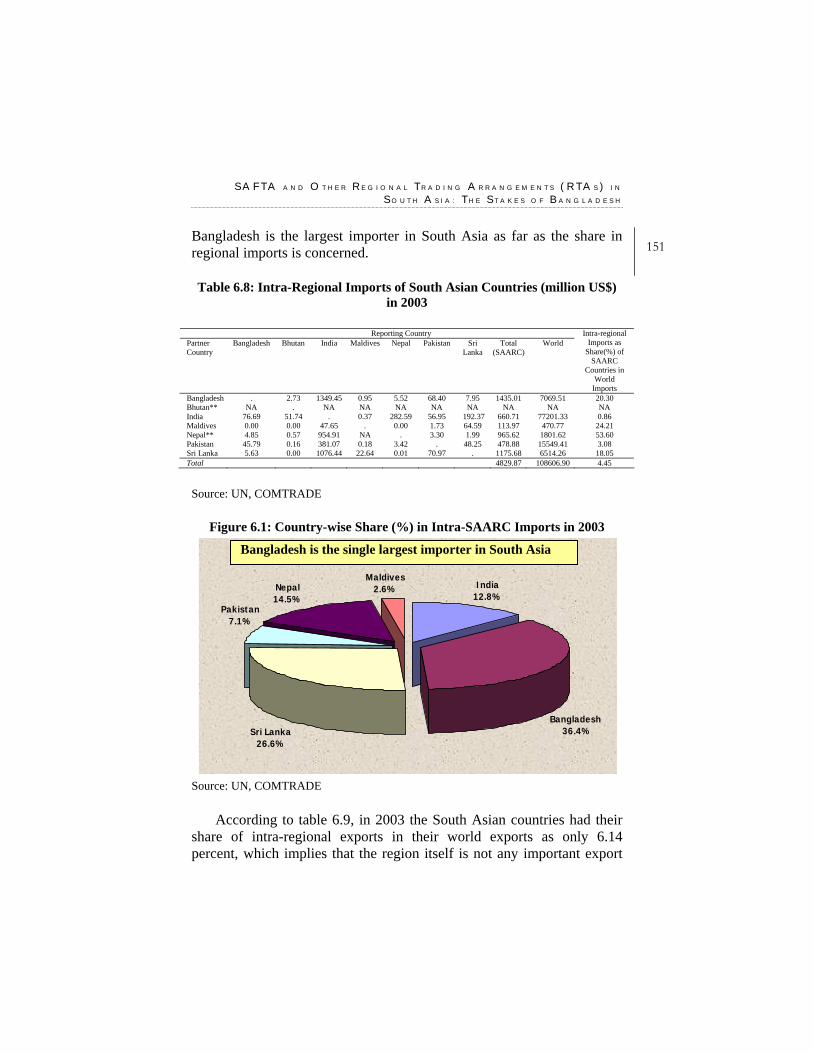
S A F T A A N D O T H E R R E G I O N A L T R A D I N G A R R A N G E M E N T S ( R T A S ) I N
S O U T H A S I A : T H E S T A K E S O F B A N G L A D E S H
151Bangladesh is the largest importer in South Asia as far as the share in regional imports is concerned. Table 6.8: Intra-Regional Imports of South Asian Countries (million US$)
in 2003
Reporting Country Partner Country
Bangladesh Bhutan India Maldives Nepal Pakistan Sri Lanka
Total (SAARC)
World Intra-regional
Imports as Share(%) of
SAARC Countries in
World Imports
Bangladesh . 2.73 1349.45 0.95 5.52 68.40 7.95 1435.01 7069.51 20.30 Bhutan** NA . NA NA NA NA NA NA NA NA India 76.69 51.74 . 0.37 282.59 56.95 192.37 660.71 77201.33 0.86 Maldives 0.00 0.00 47.65 . 0.00 1.73 64.59 113.97 470.77 24.21 Nepal** 4.85 0.57 954.91 NA . 3.30 1.99 965.62 1801.62 53.60 Pakistan 45.79 0.16 381.07 0.18 3.42 . 48.25 478.88 15549.41 3.08 Sri Lanka 5.63 0.00 1076.44 22.64 0.01 70.97 . 1175.68 6514.26 18.05 Total 4829.87 108606.90 4.45
Source: UN, COMTRADE
Figure 6.1: Country-wise Share (%) in Intra-SAARC Imports in 2003
Source: UN, COMTRADE
According to table 6.9, in 2003 the South Asian countries had their share of intra-regional exports in their world exports as only 6.14 percent, which implies that the region itself is not any important export
Maldives2.6% India
12.8%Nepal14.5%
Pakistan7.1%
Sri Lanka26.6%
Bangladesh 36.4%
Bangladesh is the single largest importer in South Asia
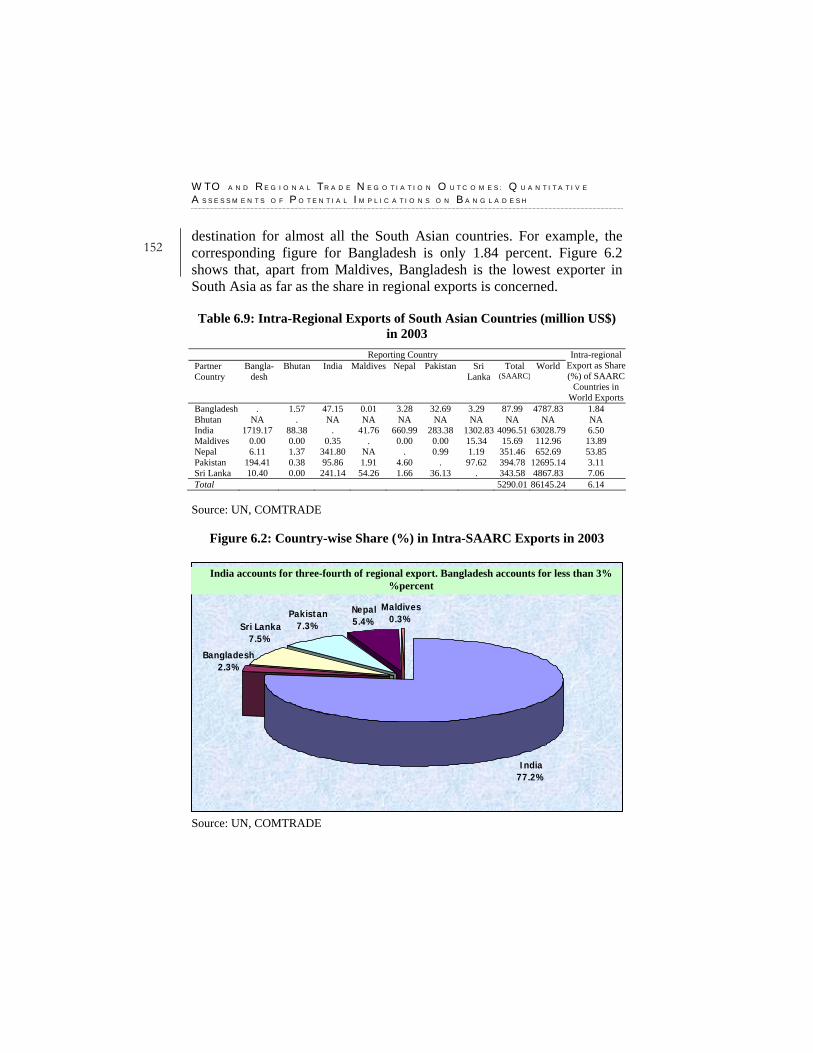
W T O A N D R E G I O N A L T R A D E N E G O T I A T I O N O U T C O M E S : Q U A N T I T A T I V E
A S S E S S M E N T S O F P O T E N T I A L I M P L I C A T I O N S O N B A N G L A D E S H
152 destination for almost all the South Asian countries. For example, the corresponding figure for Bangladesh is only 1.84 percent. Figure 6.2 shows that, apart from Maldives, Bangladesh is the lowest exporter in South Asia as far as the share in regional exports is concerned.
Table 6.9: Intra-Regional Exports of South Asian Countries (million US$) in 2003
Reporting Country Partner Country
Bangla-desh
Bhutan India Maldives Nepal Pakistan Sri Lanka
Total (SAARC)
World Intra-regional
Export as Share(%) of SAARC
Countries in World Exports
Bangladesh . 1.57 47.15 0.01 3.28 32.69 3.29 87.99 4787.83 1.84 Bhutan NA . NA NA NA NA NA NA NA NA India 1719.17 88.38 . 41.76 660.99 283.38 1302.83 4096.51 63028.79 6.50 Maldives 0.00 0.00 0.35 . 0.00 0.00 15.34 15.69 112.96 13.89 Nepal 6.11 1.37 341.80 NA . 0.99 1.19 351.46 652.69 53.85 Pakistan 194.41 0.38 95.86 1.91 4.60 . 97.62 394.78 12695.14 3.11 Sri Lanka 10.40 0.00 241.14 54.26 1.66 36.13 . 343.58 4867.83 7.06 Total 5290.01 86145.24 6.14
Source: UN, COMTRADE
Figure 6.2: Country-wise Share (%) in Intra-SAARC Exports in 2003 Source: UN, COMTRADE
Maldives0.3%
India77.2%
Nepal5.4%
Pakistan7.3%Sri Lanka
7.5%
Bangladesh 2.3%
India accounts for three-fourth of regional export. Bangladesh accounts for less than 3% %percent
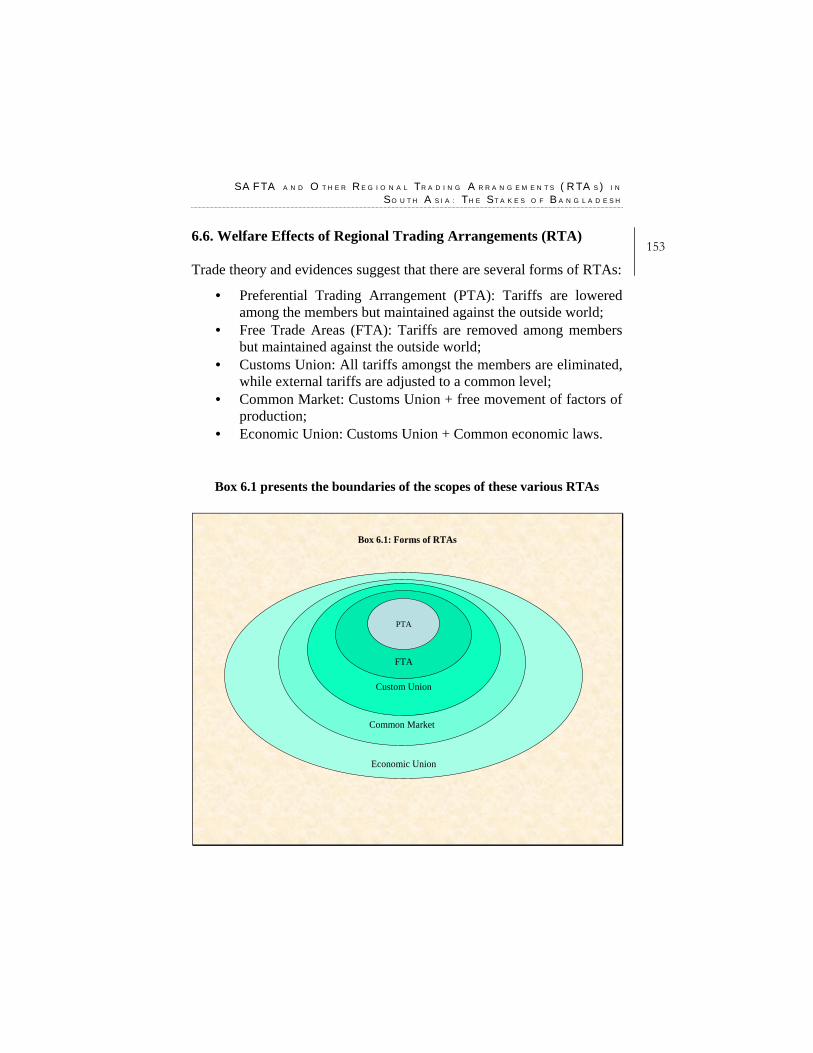
S A F T A A N D O T H E R R E G I O N A L T R A D I N G A R R A N G E M E N T S ( R T A S ) I N
S O U T H A S I A : T H E S T A K E S O F B A N G L A D E S H
1536.6. Welfare Effects of Regional Trading Arrangements (RTA) Trade theory and evidences suggest that there are several forms of RTAs:
• Preferential Trading Arrangement (PTA): Tariffs are lowered among the members but maintained against the outside world;
• Free Trade Areas (FTA): Tariffs are removed among members but maintained against the outside world;
• Customs Union: All tariffs amongst the members are eliminated, while external tariffs are adjusted to a common level;
• Common Market: Customs Union + free movement of factors of production;
• Economic Union: Customs Union + Common economic laws.
Box 6.1 presents the boundaries of the scopes of these various RTAs
Economic Union
Common Market
Custom Union
FTA
Box 6.1: Forms of RTAs
PTA
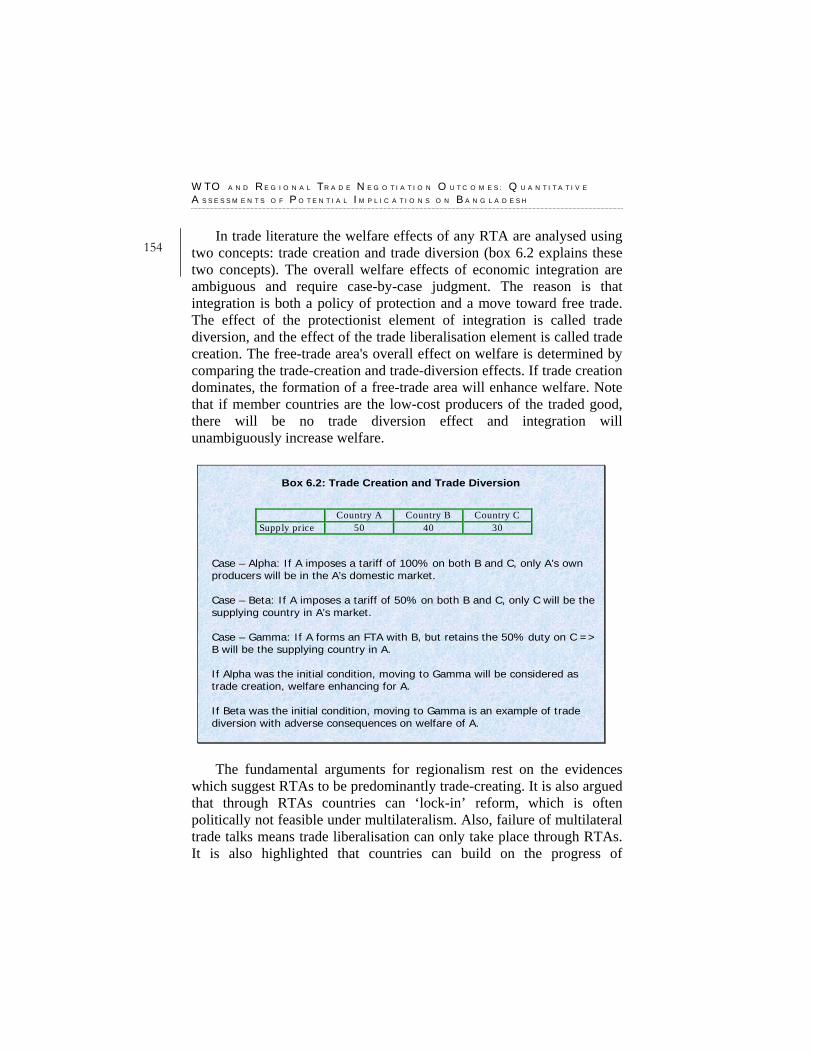
W T O A N D R E G I O N A L T R A D E N E G O T I A T I O N O U T C O M E S : Q U A N T I T A T I V E
A S S E S S M E N T S O F P O T E N T I A L I M P L I C A T I O N S O N B A N G L A D E S H
154 In trade literature the welfare effects of any RTA are analysed using
two concepts: trade creation and trade diversion (box 6.2 explains these two concepts). The overall welfare effects of economic integration are ambiguous and require case-by-case judgment. The reason is that integration is both a policy of protection and a move toward free trade. The effect of the protectionist element of integration is called trade diversion, and the effect of the trade liberalisation element is called trade creation. The free-trade area's overall effect on welfare is determined by comparing the trade-creation and trade-diversion effects. If trade creation dominates, the formation of a free-trade area will enhance welfare. Note that if member countries are the low-cost producers of the traded good, there will be no trade diversion effect and integration will unambiguously increase welfare.
Box 6.2: Trade Creation and Trade Diversion
Country A Country B Country C Supply price 50 40 30
Case – Alpha: If A imposes a tariff of 100% on both B and C, only A’s own producers will be in the A’s domestic market.
Case – Beta: If A imposes a tariff of 50% on both B and C, only C will be the supplying country in A’s market.
Case – Gamma: If A forms an FTA with B, but retains the 50% duty on C => B will be the supplying country in A.
If Alpha was the initial condition, moving to Gamma will be considered as trade creation, welfare enhancing for A.
If Beta was the initial condition, moving to Gamma is an example of trade diversion with adverse consequences on welfare of A.
The fundamental arguments for regionalism rest on the evidences
which suggest RTAs to be predominantly trade-creating. It is also argued that through RTAs countries can ‘lock-in’ reform, which is often politically not feasible under multilateralism. Also, failure of multilateral trade talks means trade liberalisation can only take place through RTAs. It is also highlighted that countries can build on the progress of
S A F T A A N D O T H E R R E G I O N A L T R A D I N G A R R A N G E M E N T S ( R T A S ) I N
S O U T H A S I A : T H E S T A K E S O F B A N G L A D E S H
155regionalism and can ultimately move toward a freer trade regime on the whole.
There are, however, some critical arguments against formation of any RTA. It is alleged that through RTA the spirit of multilateralism is undermined. Also, the ‘spaghetti bowl’ effect can emerge because of many complicated simultaneous RTA negotiations. There is also the possibility of the discrimination against the excluded countries, and as a result, this may lead to terms of trade shock for them. Even LDCs could be seriously discriminated against. It is also argued that the world might be divided into a few protectionist blocs. Also, protectionists might accept RTAs to oppose further multilateral liberalisation. It is further put forward that resources in trade ministries are limited. Therefore, too much involvement in RTA negotiations may distract attention from multilateral liberalisation.
In general, there are some agreements among the economists about the pre-conditions for home-country welfare expansion. For example the home country could gain if there are - (i) high level of the home country’s tariffs prior to the agreement; (ii) high tariff level of the contemplated partner; (iii) high economic size of the partner; (iv) high share of the partner in providing the home country’s imports; (v) low ratio of imports from the rest of the world to the home country’s aggregate economic activity; (vi) relative prices in the partner’s economy close to the rest of the world; and (vii) structures of partners’ economic activities close to the rest of the world.
6.7. Trade Creation and Trade Diversion Effects under SAFTA: Estimates using the GTAP Model
Studies based on the partial equilibrium gravity model to estimate the welfare gains from RTAs are methodologically flawed. The left hand side of the gravity equation is the bilateral trade not welfare. Also, the impact of the RTA is captured by introducing the dummy variables in the equation, which is a very weak methodology. Furthermore, gravity models are partial equilibrium analysis, therefore, they fail to take into consideration the inter-sectoral and inter-regional linkage effects. Therefore, gravity models can not actually estimate the trade creation and trade diversion impacts of RTAs.
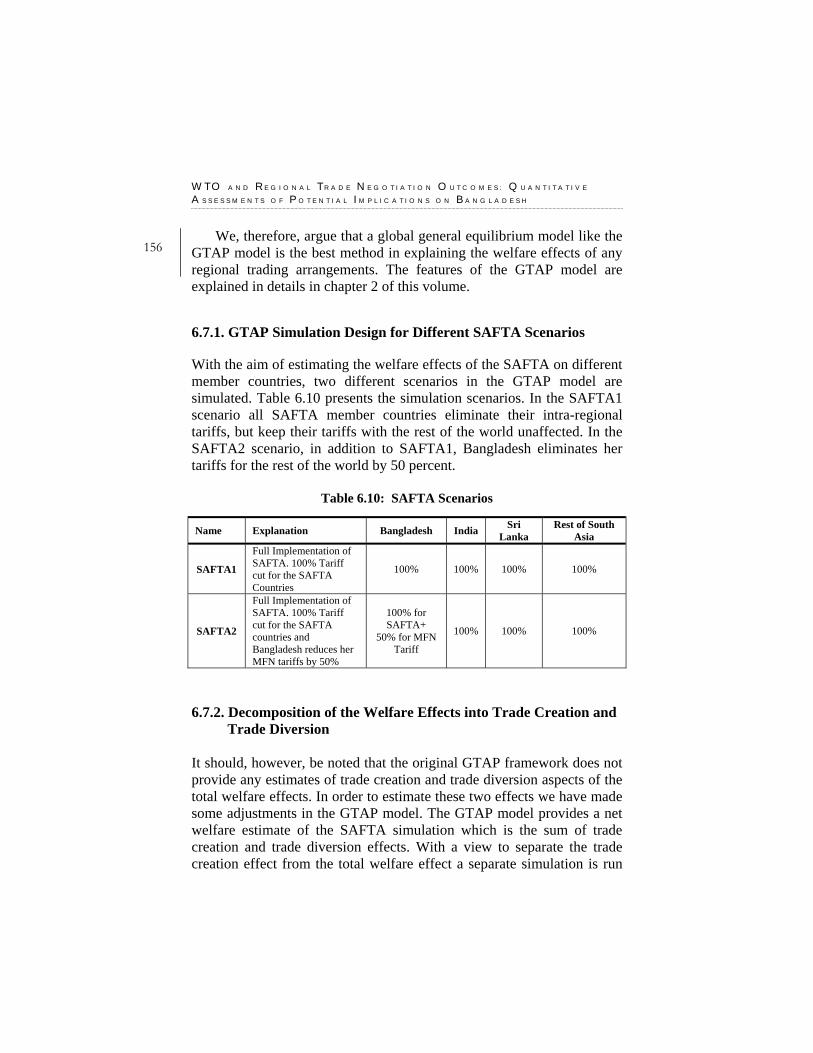
W T O A N D R E G I O N A L T R A D E N E G O T I A T I O N O U T C O M E S : Q U A N T I T A T I V E
A S S E S S M E N T S O F P O T E N T I A L I M P L I C A T I O N S O N B A N G L A D E S H
156 We, therefore, argue that a global general equilibrium model like the
GTAP model is the best method in explaining the welfare effects of any regional trading arrangements. The features of the GTAP model are explained in details in chapter 2 of this volume. 6.7.1. GTAP Simulation Design for Different SAFTA Scenarios With the aim of estimating the welfare effects of the SAFTA on different member countries, two different scenarios in the GTAP model are simulated. Table 6.10 presents the simulation scenarios. In the SAFTA1 scenario all SAFTA member countries eliminate their intra-regional tariffs, but keep their tariffs with the rest of the world unaffected. In the SAFTA2 scenario, in addition to SAFTA1, Bangladesh eliminates her tariffs for the rest of the world by 50 percent.
Table 6.10: SAFTA Scenarios
Name Explanation Bangladesh India Sri Lanka
Rest of South Asia
SAFTA1
Full Implementation of SAFTA. 100% Tariff cut for the SAFTA Countries
100% 100% 100% 100%
SAFTA2
Full Implementation of SAFTA. 100% Tariff cut for the SAFTA countries and Bangladesh reduces her MFN tariffs by 50%
100% for SAFTA+
50% for MFN Tariff
100% 100% 100%
6.7.2. Decomposition of the Welfare Effects into Trade Creation and
Trade Diversion It should, however, be noted that the original GTAP framework does not provide any estimates of trade creation and trade diversion aspects of the total welfare effects. In order to estimate these two effects we have made some adjustments in the GTAP model. The GTAP model provides a net welfare estimate of the SAFTA simulation which is the sum of trade creation and trade diversion effects. With a view to separate the trade creation effect from the total welfare effect a separate simulation is run
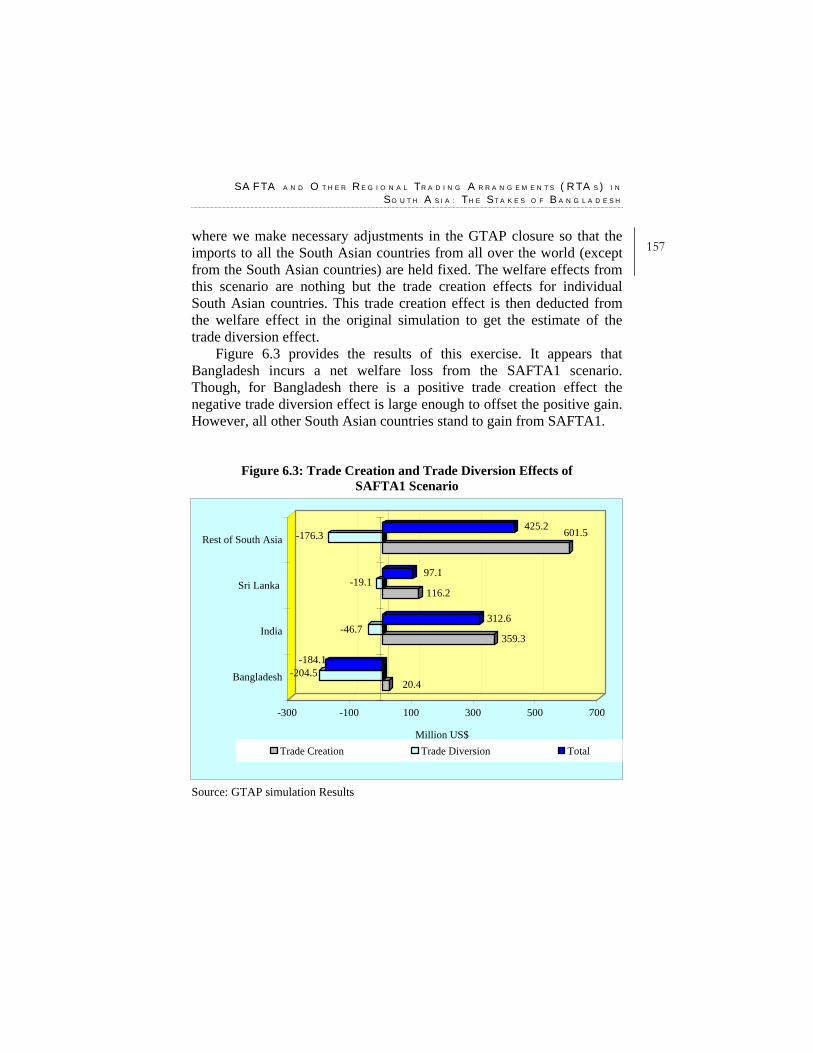
S A F T A A N D O T H E R R E G I O N A L T R A D I N G A R R A N G E M E N T S ( R T A S ) I N
S O U T H A S I A : T H E S T A K E S O F B A N G L A D E S H
157where we make necessary adjustments in the GTAP closure so that the imports to all the South Asian countries from all over the world (except from the South Asian countries) are held fixed. The welfare effects from this scenario are nothing but the trade creation effects for individual South Asian countries. This trade creation effect is then deducted from the welfare effect in the original simulation to get the estimate of the trade diversion effect.
Figure 6.3 provides the results of this exercise. It appears that Bangladesh incurs a net welfare loss from the SAFTA1 scenario. Though, for Bangladesh there is a positive trade creation effect the negative trade diversion effect is large enough to offset the positive gain. However, all other South Asian countries stand to gain from SAFTA1.
Figure 6.3: Trade Creation and Trade Diversion Effects of SAFTA1 Scenario
20.4-204.5
-184.1
359.3-46.7
312.6
116.2-19.1
97.1
601.5-176.3425.2
-300 -100 100 300 500 700
Million US$
Bangladesh
India
Sri Lanka
Rest of South Asia
Trade Creation Trade Diversion Total
Source: GTAP simulation Results
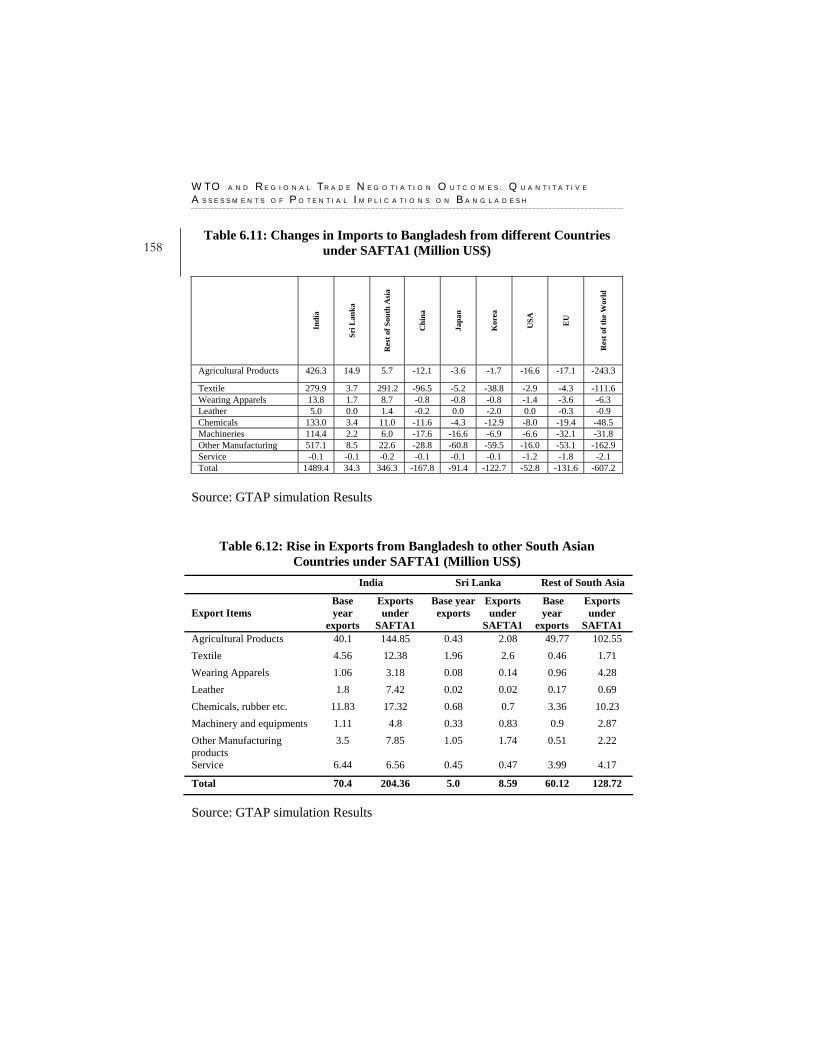
W T O A N D R E G I O N A L T R A D E N E G O T I A T I O N O U T C O M E S : Q U A N T I T A T I V E
A S S E S S M E N T S O F P O T E N T I A L I M P L I C A T I O N S O N B A N G L A D E S H
158 Table 6.11: Changes in Imports to Bangladesh from different Countries
under SAFTA1 (Million US$)
Indi
a
Sri L
anka
Res
t of S
outh
Asi
a
Chi
na
Japa
n
Kor
ea
USA
EU
Res
t of t
he W
orld
Agricultural Products 426.3 14.9 5.7 -12.1 -3.6 -1.7 -16.6 -17.1 -243.3
Textile 279.9 3.7 291.2 -96.5 -5.2 -38.8 -2.9 -4.3 -111.6 Wearing Apparels 13.8 1.7 8.7 -0.8 -0.8 -0.8 -1.4 -3.6 -6.3 Leather 5.0 0.0 1.4 -0.2 0.0 -2.0 0.0 -0.3 -0.9 Chemicals 133.0 3.4 11.0 -11.6 -4.3 -12.9 -8.0 -19.4 -48.5 Machineries 114.4 2.2 6.0 -17.6 -16.6 -6.9 -6.6 -32.1 -31.8 Other Manufacturing 517.1 8.5 22.6 -28.8 -60.8 -59.5 -16.0 -53.1 -162.9 Service -0.1 -0.1 -0.2 -0.1 -0.1 -0.1 -1.2 -1.8 -2.1 Total 1489.4 34.3 346.3 -167.8 -91.4 -122.7 -52.8 -131.6 -607.2
Source: GTAP simulation Results
Table 6.12: Rise in Exports from Bangladesh to other South Asian Countries under SAFTA1 (Million US$)
India Sri Lanka Rest of South Asia
Export Items Base year
exports
Exports under
SAFTA1
Base year exports
Exports under
SAFTA1
Base year
exports
Exports under
SAFTA1 Agricultural Products 40.1 144.85 0.43 2.08 49.77 102.55 Textile 4.56 12.38 1.96 2.6 0.46 1.71 Wearing Apparels 1.06 3.18 0.08 0.14 0.96 4.28 Leather 1.8 7.42 0.02 0.02 0.17 0.69 Chemicals, rubber etc. 11.83 17.32 0.68 0.7 3.36 10.23 Machinery and equipments 1.11 4.8 0.33 0.83 0.9 2.87 Other Manufacturing products
3.5 7.85 1.05 1.74 0.51 2.22
Service 6.44 6.56 0.45 0.47 3.99 4.17
Total 70.4 204.36 5.0 8.59 60.12 128.72
Source: GTAP simulation Results
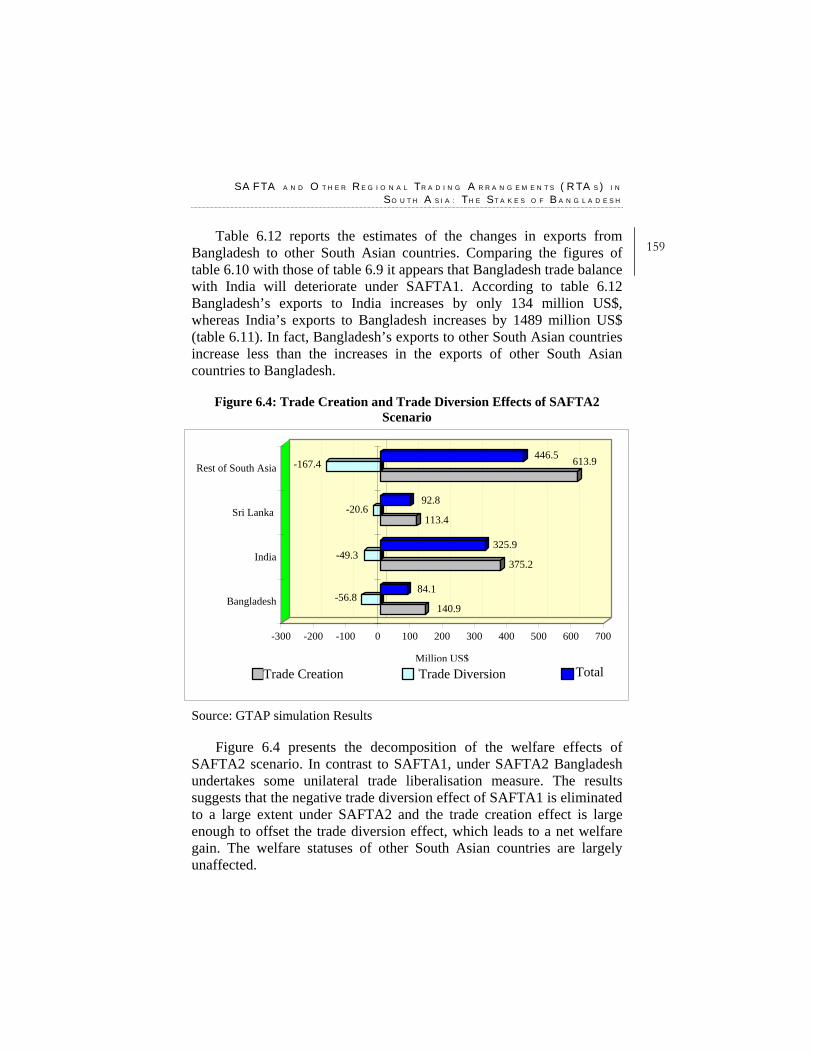
S A F T A A N D O T H E R R E G I O N A L T R A D I N G A R R A N G E M E N T S ( R T A S ) I N
S O U T H A S I A : T H E S T A K E S O F B A N G L A D E S H
159Table 6.12 reports the estimates of the changes in exports from
Bangladesh to other South Asian countries. Comparing the figures of table 6.10 with those of table 6.9 it appears that Bangladesh trade balance with India will deteriorate under SAFTA1. According to table 6.12 Bangladesh’s exports to India increases by only 134 million US$, whereas India’s exports to Bangladesh increases by 1489 million US$ (table 6.11). In fact, Bangladesh’s exports to other South Asian countries increase less than the increases in the exports of other South Asian countries to Bangladesh.
Figure 6.4: Trade Creation and Trade Diversion Effects of SAFTA2 Scenario
140.9-56.8
84.1
375.2-49.3
325.9
113.4-20.6
92.8
613.9-167.4446.5
-300 -200 -100 0 100 200 300 400 500 600 700
Million US$
Bangladesh
India
Sri Lanka
Rest of South Asia
Trade Creation Trade Diversion Total
Source: GTAP simulation Results
Figure 6.4 presents the decomposition of the welfare effects of SAFTA2 scenario. In contrast to SAFTA1, under SAFTA2 Bangladesh undertakes some unilateral trade liberalisation measure. The results suggests that the negative trade diversion effect of SAFTA1 is eliminated to a large extent under SAFTA2 and the trade creation effect is large enough to offset the trade diversion effect, which leads to a net welfare gain. The welfare statuses of other South Asian countries are largely unaffected.
Trade Creation Total Trade Diversion
W T O A N D R E G I O N A L T R A D E N E G O T I A T I O N O U T C O M E S : Q U A N T I T A T I V E
A S S E S S M E N T S O F P O T E N T I A L I M P L I C A T I O N S O N B A N G L A D E S H
160 6.8. Conclusion This paper has examined the features and prospects of different regional integration and bilateral FTAs in South Asia involving Bangladesh. It appears that among the RTA initiatives only the SAFTA has become operationalised. With respect to different bilateral FTAs no significant progress has been achieved so far.
This paper has also estimated the trade creation and trade diversion aspects of the total welfare effects of SAFTA scenarios. It appears that a full implementation of SAFTA will lead to welfare gains for India, Sri Lanka and rest of South Asian countries, though Bangladesh suffers from a welfare loss. Bangladesh’s welfare loss is mainly driven by the large negative trade diversion effect. Simulation results also suggest that the negative trade diversion effect can be undermined by some associated unilateral trade liberalisation measure. Also, Bangladesh will have to raise her export share into the Indian market substantially in order to increase welfare through positive terms of trade effect. Export diversification in this regard is very important. Technical assistance to Bangladesh and other South Asian LDCs to diversify their export basket can be a vital agenda to make SAFTA effective. It should also be noted that the Special and Different Treatments for the LDCs under SAFTA are not sufficient, especially maintaining the sensitive list for some of the critical products by India will not help Bangladesh and other LDCs to increase their export shares in the Indian market.
CHAPTER SEVEN
Abdur Razzaque and Selim Raihan Two Years after MFA Phase Out: Concerns for Bangladesh
7.1. Bangladesh’s Apparel Exports: Looking Backward in Order to
Look Forward For Bangladesh there has possibly been nothing more spectacular than the growth of its export sector. In the decade of the 1980s, Bangladesh’s exports doubled from US$ 0.9 billion to US$ 1.8 billion, which in the next decade increased three-folds to cross US$ 5 billion on its way to over US$ 10 billion within the next six years (Figure 7.1a). This apparently impressive performance has been single-handedly driven by the apparel export sector alone that has witnessed its share in total exports rising from virtually nothing in 1980 to 75 percent in 2006 (Figure 7.1b). From a base of US$ 0.6 billion in 1990, exports of apparels – more popularly known in Bangladesh as readymade garments (RMG) – on average had grown at an annual rate of about 19 percent to reach US$ 7.9 billion in 2006. The comparable growth rates for non-RMG exports and GDP had been 8 and 5 percent, respectively. Given the
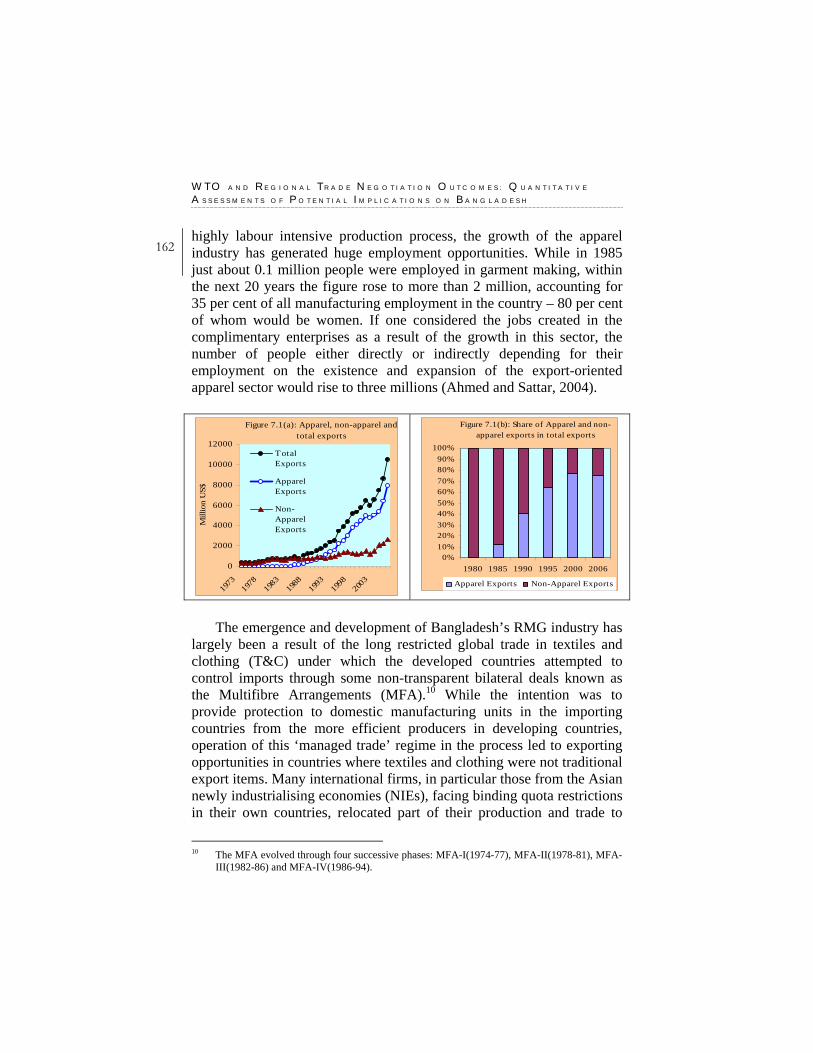
W T O A N D R E G I O N A L T R A D E N E G O T I A T I O N O U T C O M E S : Q U A N T I T A T I V E
A S S E S S M E N T S O F P O T E N T I A L I M P L I C A T I O N S O N B A N G L A D E S H
162 highly labour intensive production process, the growth of the apparel industry has generated huge employment opportunities. While in 1985 just about 0.1 million people were employed in garment making, within the next 20 years the figure rose to more than 2 million, accounting for 35 per cent of all manufacturing employment in the country – 80 per cent of whom would be women. If one considered the jobs created in the complimentary enterprises as a result of the growth in this sector, the number of people either directly or indirectly depending for their employment on the existence and expansion of the export-oriented apparel sector would rise to three millions (Ahmed and Sattar, 2004).
Figure 7.1(a): Apparel, non-apparel and total exports
0
2000
4000
6000
8000
10000
12000
1973
1978
1983
1988
1993
1998
2003
Mill
ion
US$
TotalExports
ApparelExports
Non-ApparelExports
Figure 7.1(b): Share of Apparel and non-apparel exports in total exports
0%10%20%30%40%50%60%70%80%90%
100%
1980 1985 1990 1995 2000 2006
Apparel Exports Non-Apparel Exports
The emergence and development of Bangladesh’s RMG industry has largely been a result of the long restricted global trade in textiles and clothing (T&C) under which the developed countries attempted to control imports through some non-transparent bilateral deals known as the Multifibre Arrangements (MFA).10 While the intention was to provide protection to domestic manufacturing units in the importing countries from the more efficient producers in developing countries, operation of this ‘managed trade’ regime in the process led to exporting opportunities in countries where textiles and clothing were not traditional export items. Many international firms, in particular those from the Asian newly industrialising economies (NIEs), facing binding quota restrictions in their own countries, relocated part of their production and trade to
10 The MFA evolved through four successive phases: MFA-I(1974-77), MFA-II(1978-81), MFA-
III(1982-86) and MFA-IV(1986-94).
T W O Y E A R S A F T E R M F A P H A S E O U T : C O N C E R N S F O R B A N G L A D E S H
163other relatively poor developing countries including Bangladesh. As the process of production was labour intensive in nature, especially in the production of apparels, the availability of cheap and easily trainable labour in these countries facilitated the growth and development of the sector. The restricted global trade regime therefore ensured a de facto reserved market status for the new suppliers and gave them some time to develop and learn the skills required in the production and marketing. In addition to quota-protected export markets, Bangladesh’s apparel industry has also been greatly benefited from a generous Generalized Systems of Preference (GSP) facility that allowed duty-free and quota-free market access for T&C products of LDCs to the European Union (EU).11
Apart from a favourable international trade environment, the growth of the RMG industry in the country coincided with Bangladesh’s changing trade policy regime, providing the much needed policy support to the export sector. Untill the early 1980s Bangladesh followed a very rigid import-substituting trade regime. This generated a highly distorted incentive structure resulting in widespread allocative and productive inefficiencies, which not only inhibited the prospect for growth but also led to a policy induced anti-export bias thus undermining the potential for export growth. In the face of some serious macroeconomic imbalances and stagnating export performance, Bangladesh had to undertake the policy of reforms for stabilisation and structural adjustment. This policy reversal introduced generous promotional measures for exports so that the erstwhile bias against the export-oriented investment could be reduced significantly. Important export-promotion schemes included, inter alia, allowing exporters to open letter of credit (L/Cs) for the required imports of raw materials against their export L/Cs (popularly known as the back-to-back L/Cs), bank credit at a subsidised rate of interest, duty free import of machinery, providing intermediate inputs at world price either by bonded warehouse or by duty draw back facilities, cash subsidies, and exemption from value-added and other
11 However, not all apparel exports are eligible for duty-free access to the EU market.
Duty-free access is preconditioned by the fulfilment of EU rules of Origin (ROO). In the case of apparels, EU ROO specify that LDCs must undertake two-stage domestic value addition before taking the advantage of duty-free access. For a woven shirt, this would imply that the fabrics used in its make should be locally produced while for a knitwear product the used yarn should be of domestic origin.
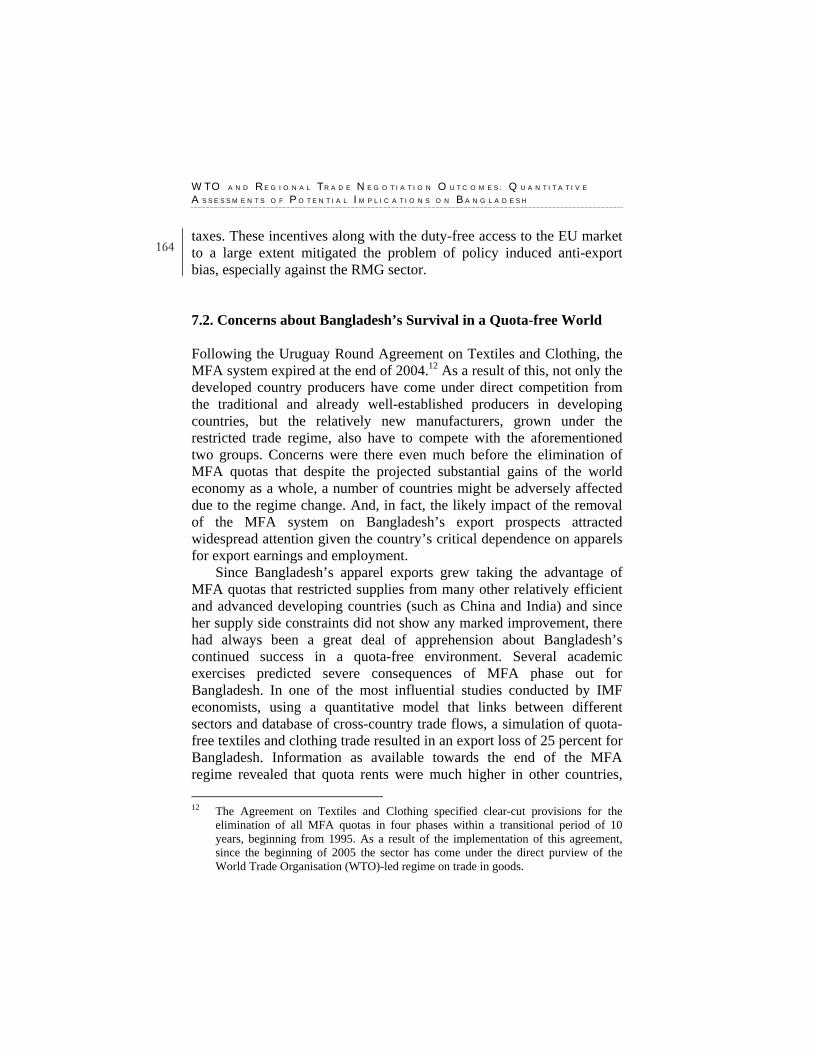
W T O A N D R E G I O N A L T R A D E N E G O T I A T I O N O U T C O M E S : Q U A N T I T A T I V E
A S S E S S M E N T S O F P O T E N T I A L I M P L I C A T I O N S O N B A N G L A D E S H
164 taxes. These incentives along with the duty-free access to the EU market to a large extent mitigated the problem of policy induced anti-export bias, especially against the RMG sector. 7.2. Concerns about Bangladesh’s Survival in a Quota-free World Following the Uruguay Round Agreement on Textiles and Clothing, the MFA system expired at the end of 2004.12 As a result of this, not only the developed country producers have come under direct competition from the traditional and already well-established producers in developing countries, but the relatively new manufacturers, grown under the restricted trade regime, also have to compete with the aforementioned two groups. Concerns were there even much before the elimination of MFA quotas that despite the projected substantial gains of the world economy as a whole, a number of countries might be adversely affected due to the regime change. And, in fact, the likely impact of the removal of the MFA system on Bangladesh’s export prospects attracted widespread attention given the country’s critical dependence on apparels for export earnings and employment.
Since Bangladesh’s apparel exports grew taking the advantage of MFA quotas that restricted supplies from many other relatively efficient and advanced developing countries (such as China and India) and since her supply side constraints did not show any marked improvement, there had always been a great deal of apprehension about Bangladesh’s continued success in a quota-free environment. Several academic exercises predicted severe consequences of MFA phase out for Bangladesh. In one of the most influential studies conducted by IMF economists, using a quantitative model that links between different sectors and database of cross-country trade flows, a simulation of quota-free textiles and clothing trade resulted in an export loss of 25 percent for Bangladesh. Information as available towards the end of the MFA regime revealed that quota rents were much higher in other countries, 12 The Agreement on Textiles and Clothing specified clear-cut provisions for the
elimination of all MFA quotas in four phases within a transitional period of 10 years, beginning from 1995. As a result of the implementation of this agreement, since the beginning of 2005 the sector has come under the direct purview of the World Trade Organisation (WTO)-led regime on trade in goods.

T W O Y E A R S A F T E R M F A P H A S E O U T : C O N C E R N S F O R B A N G L A D E S H
165and particularly in China and India, in comparison with those of Bangladesh.13 This would imply that MFA quotas were more restrictive in other countries and Bangladesh’s main competitors would be able to withhold much higher price-cuts, i.e. they were more competitive than Bangladesh.14 7.3. Actual Export Performance after the MFA Phase-Out Against all grim predictions of academic exercises, Bangladesh has so far managed to have fared better. Data provided by the Export Promotion Bureau (EPB) of Bangladesh show that while in the fiscal year of 2003-04 (i.e. July 2003-June 2004) export receipts from RMG stood at US$7.6 billion, in the following fiscal year of 2004-05, comprising the first six months of the quota-free regime, similar exports rose by more than US$ 1.0 billion, registering a growth of about 19 percent (see figure 7.2 and figure 7.3). The growth rate recorded for 2005-06 was even higher at 23.5 percent with the receipts from apparel exports reaching US$ 7.9 billion. Therefore, between July 2004 and June 2006, Bangladesh’s RMG exports have increased by US$2.5 billion. It is in this backdrop, many analysts consider Bangladesh as a winner in the post-MFA world, dubbing the apprehensions associated with quota abolition as unrealistic and hyped-up to dramatize the end of the previous system. However, a close analysis of export trends and events, that have taken place since the expiry of the MFA, would suggest that an optimistic scenario needs to be guarded against other factors that might ultimately determine Bangladesh’s export prospect in a quota-free world.
13 Under the MFA, in order to export, a firm in a quota constrained country had to
purchase a quota and the price of a quota per unit of exports was then equivalent in its impact to an export tax of the same magnitude. The more restrictive a quota is, the higher the quota rent will be.
14 Useful discussions on this are available in Razzaque (2005).
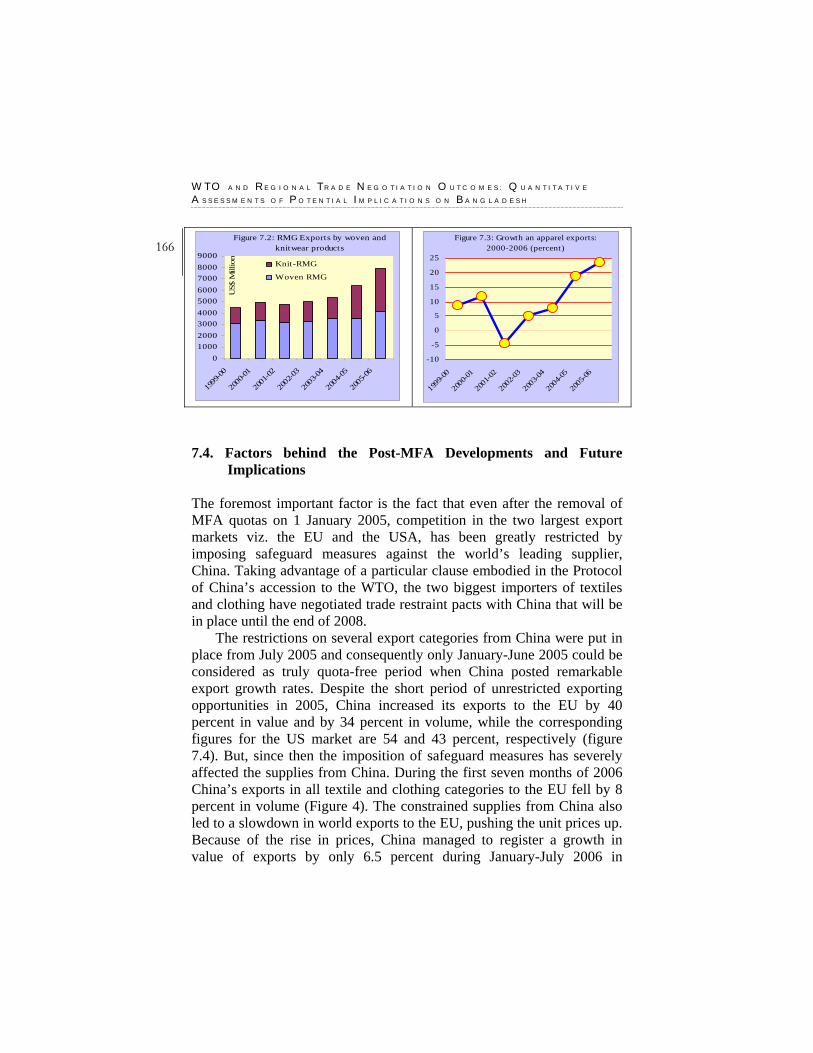
W T O A N D R E G I O N A L T R A D E N E G O T I A T I O N O U T C O M E S : Q U A N T I T A T I V E
A S S E S S M E N T S O F P O T E N T I A L I M P L I C A T I O N S O N B A N G L A D E S H
166 Figure 7.2: RMG Exports by woven and
knitwear products
0100020003000400050006000700080009000
1999
-00
2000
-01
2001
-02
2002
-03
2003
-04
2004
-05
2005
-06
US$
Mill
ion
Knit-RMG
Woven RMG
Figure 7.3: Growth an apparel exports: 2000-2006 (percent)
-10
-5
0
5
10
15
20
25
1999
-00
2000
-01
2001
-02
2002
-03
2003
-04
2004
-05
2005
-06
7.4. Factors behind the Post-MFA Developments and Future Implications
The foremost important factor is the fact that even after the removal of MFA quotas on 1 January 2005, competition in the two largest export markets viz. the EU and the USA, has been greatly restricted by imposing safeguard measures against the world’s leading supplier, China. Taking advantage of a particular clause embodied in the Protocol of China’s accession to the WTO, the two biggest importers of textiles and clothing have negotiated trade restraint pacts with China that will be in place until the end of 2008.
The restrictions on several export categories from China were put in place from July 2005 and consequently only January-June 2005 could be considered as truly quota-free period when China posted remarkable export growth rates. Despite the short period of unrestricted exporting opportunities in 2005, China increased its exports to the EU by 40 percent in value and by 34 percent in volume, while the corresponding figures for the US market are 54 and 43 percent, respectively (figure 7.4). But, since then the imposition of safeguard measures has severely affected the supplies from China. During the first seven months of 2006 China’s exports in all textile and clothing categories to the EU fell by 8 percent in volume (Figure 4). The constrained supplies from China also led to a slowdown in world exports to the EU, pushing the unit prices up. Because of the rise in prices, China managed to register a growth in value of exports by only 6.5 percent during January-July 2006 in
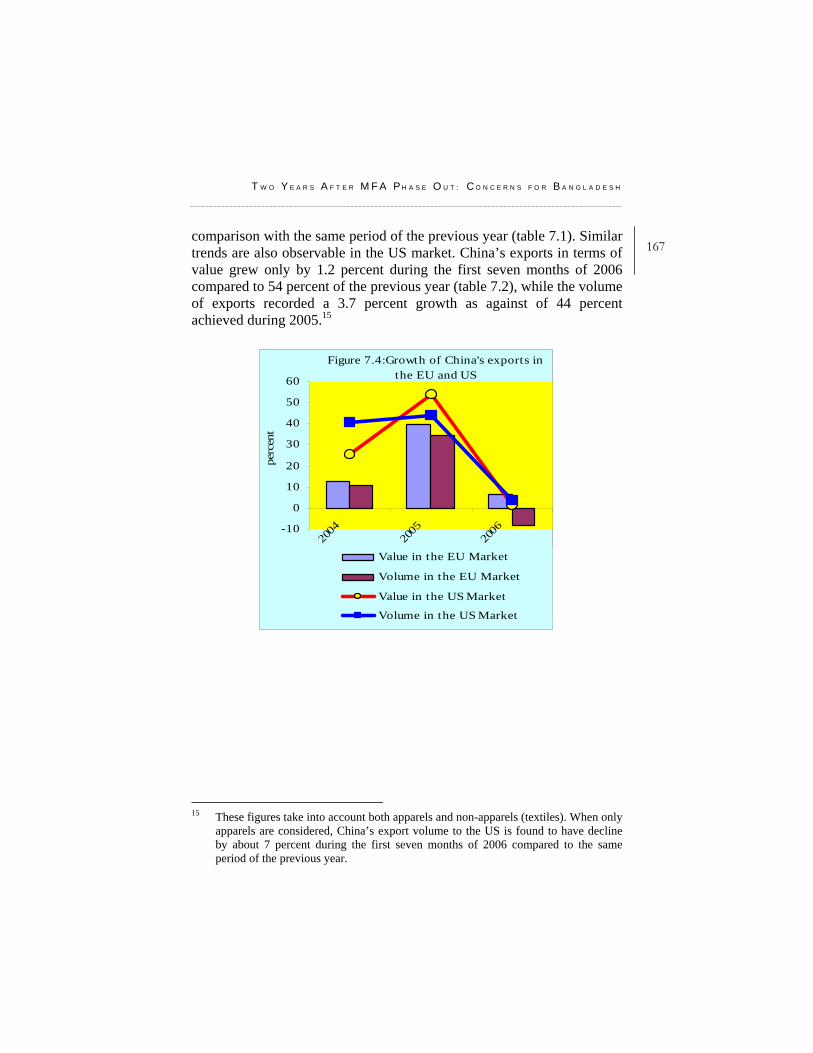
T W O Y E A R S A F T E R M F A P H A S E O U T : C O N C E R N S F O R B A N G L A D E S H
167comparison with the same period of the previous year (table 7.1). Similar trends are also observable in the US market. China’s exports in terms of value grew only by 1.2 percent during the first seven months of 2006 compared to 54 percent of the previous year (table 7.2), while the volume of exports recorded a 3.7 percent growth as against of 44 percent achieved during 2005.15
Figure 7.4:Growth of China's exports in the EU and US
-10
0
10
20
30
40
50
60
2004
2005
2006
perc
ent
Value in the EU Market
Volume in the EU Market
Value in the US Market
Volume in the US Market
15 These figures take into account both apparels and non-apparels (textiles). When only
apparels are considered, China’s export volume to the US is found to have decline by about 7 percent during the first seven months of 2006 compared to the same period of the previous year.
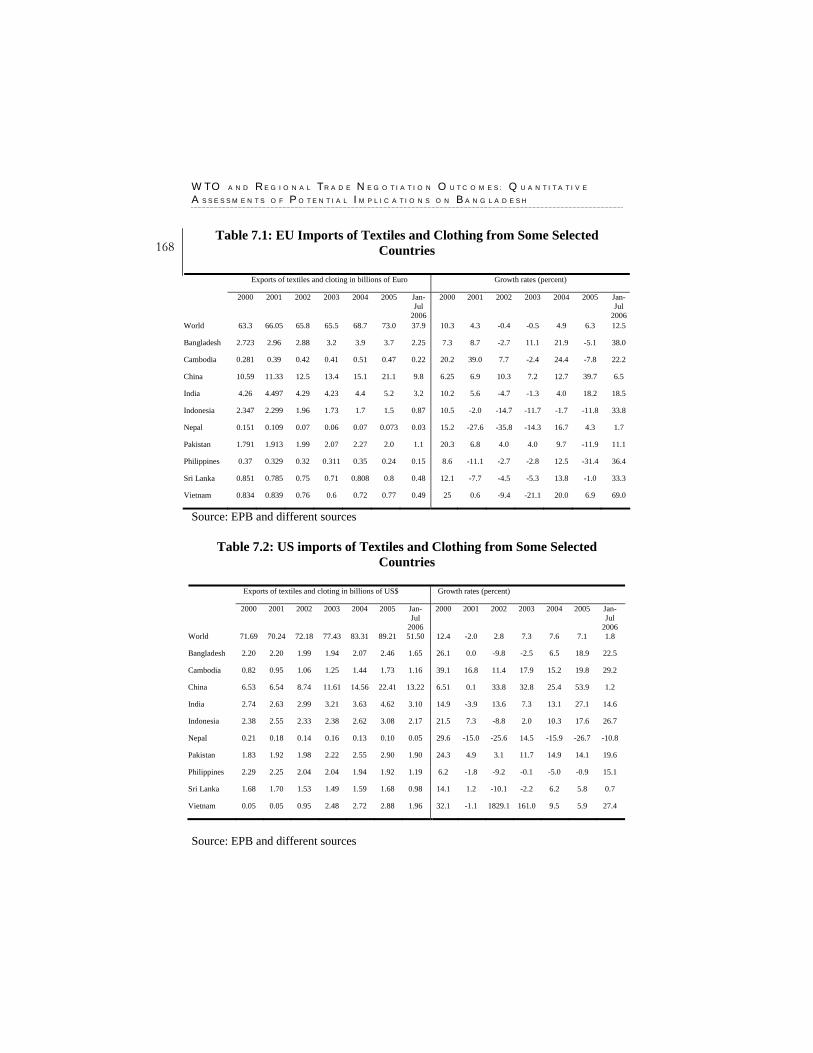
W T O A N D R E G I O N A L T R A D E N E G O T I A T I O N O U T C O M E S : Q U A N T I T A T I V E
A S S E S S M E N T S O F P O T E N T I A L I M P L I C A T I O N S O N B A N G L A D E S H
168 Table 7.1: EU Imports of Textiles and Clothing from Some Selected
Countries
Exports of textiles and cloting in billions of Euro Growth rates (percent)
2000 2001 2002 2003 2004 2005 Jan-Jul
2006
2000 2001 2002 2003 2004 2005 Jan- Jul
2006 World 63.3 66.05 65.8 65.5 68.7 73.0 37.9 10.3 4.3 -0.4 -0.5 4.9 6.3 12.5
Bangladesh 2.723 2.96 2.88 3.2 3.9 3.7 2.25 7.3 8.7 -2.7 11.1 21.9 -5.1 38.0
Cambodia 0.281 0.39 0.42 0.41 0.51 0.47 0.22 20.2 39.0 7.7 -2.4 24.4 -7.8 22.2
China 10.59 11.33 12.5 13.4 15.1 21.1 9.8 6.25 6.9 10.3 7.2 12.7 39.7 6.5
India 4.26 4.497 4.29 4.23 4.4 5.2 3.2 10.2 5.6 -4.7 -1.3 4.0 18.2 18.5
Indonesia 2.347 2.299 1.96 1.73 1.7 1.5 0.87 10.5 -2.0 -14.7 -11.7 -1.7 -11.8 33.8
Nepal 0.151 0.109 0.07 0.06 0.07 0.073 0.03 15.2 -27.6 -35.8 -14.3 16.7 4.3 1.7
Pakistan 1.791 1.913 1.99 2.07 2.27 2.0 1.1 20.3 6.8 4.0 4.0 9.7 -11.9 11.1
Philippines 0.37 0.329 0.32 0.311 0.35 0.24 0.15 8.6 -11.1 -2.7 -2.8 12.5 -31.4 36.4
Sri Lanka 0.851 0.785 0.75 0.71 0.808 0.8 0.48 12.1 -7.7 -4.5 -5.3 13.8 -1.0 33.3
Vietnam 0.834 0.839 0.76 0.6 0.72 0.77 0.49 25 0.6 -9.4 -21.1 20.0 6.9 69.0
Source: EPB and different sources
Table 7.2: US imports of Textiles and Clothing from Some Selected Countries
Exports of textiles and cloting in billions of US$ Growth rates (percent)
2000 2001 2002 2003 2004 2005 Jan- Jul
2006
2000 2001 2002 2003 2004 2005 Jan- Jul
2006 World 71.69 70.24 72.18 77.43 83.31 89.21 51.50 12.4 -2.0 2.8 7.3 7.6 7.1 1.8
Bangladesh 2.20 2.20 1.99 1.94 2.07 2.46 1.65 26.1 0.0 -9.8 -2.5 6.5 18.9 22.5
Cambodia 0.82 0.95 1.06 1.25 1.44 1.73 1.16 39.1 16.8 11.4 17.9 15.2 19.8 29.2
China 6.53 6.54 8.74 11.61 14.56 22.41 13.22 6.51 0.1 33.8 32.8 25.4 53.9 1.2
India 2.74 2.63 2.99 3.21 3.63 4.62 3.10 14.9 -3.9 13.6 7.3 13.1 27.1 14.6
Indonesia 2.38 2.55 2.33 2.38 2.62 3.08 2.17 21.5 7.3 -8.8 2.0 10.3 17.6 26.7
Nepal 0.21 0.18 0.14 0.16 0.13 0.10 0.05 29.6 -15.0 -25.6 14.5 -15.9 -26.7 -10.8
Pakistan 1.83 1.92 1.98 2.22 2.55 2.90 1.90 24.3 4.9 3.1 11.7 14.9 14.1 19.6
Philippines 2.29 2.25 2.04 2.04 1.94 1.92 1.19 6.2 -1.8 -9.2 -0.1 -5.0 -0.9 15.1
Sri Lanka 1.68 1.70 1.53 1.49 1.59 1.68 0.98 14.1 1.2 -10.1 -2.2 6.2 5.8 0.7
Vietnam 0.05 0.05 0.95 2.48 2.72 2.88 1.96 32.1 -1.1 1829.1 161.0 9.5 5.9 27.4
Source: EPB and different sources
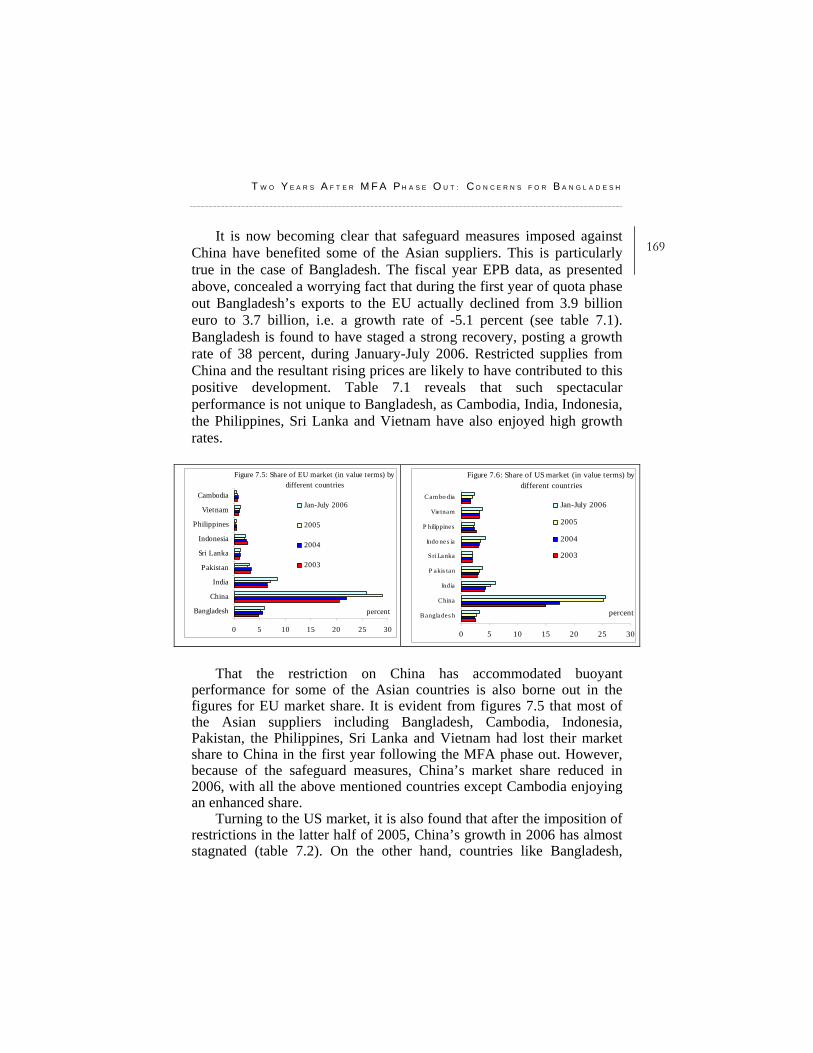
T W O Y E A R S A F T E R M F A P H A S E O U T : C O N C E R N S F O R B A N G L A D E S H
169It is now becoming clear that safeguard measures imposed against
China have benefited some of the Asian suppliers. This is particularly true in the case of Bangladesh. The fiscal year EPB data, as presented above, concealed a worrying fact that during the first year of quota phase out Bangladesh’s exports to the EU actually declined from 3.9 billion euro to 3.7 billion, i.e. a growth rate of -5.1 percent (see table 7.1). Bangladesh is found to have staged a strong recovery, posting a growth rate of 38 percent, during January-July 2006. Restricted supplies from China and the resultant rising prices are likely to have contributed to this positive development. Table 7.1 reveals that such spectacular performance is not unique to Bangladesh, as Cambodia, India, Indonesia, the Philippines, Sri Lanka and Vietnam have also enjoyed high growth rates.
Figure 7.5: Share of EU market (in value terms) by different countries
0 5 10 15 20 25 30
Bangladesh
China
India
Pakistan
Sri Lanka
Indonesia
Philippines
Vietnam
Cambodia
percent
Jan-July 2006
2005
2004
2003
Figure 7.6: Share of US market (in value terms) by different countries
0 5 10 15 20 25 30
Banglades h
China
India
P akis tan
Sri Lanka
Indo nes ia
P hilippines
Vie tnam
Cambo dia
percent
Jan-July 2006
2005
2004
2003
That the restriction on China has accommodated buoyant
performance for some of the Asian countries is also borne out in the figures for EU market share. It is evident from figures 7.5 that most of the Asian suppliers including Bangladesh, Cambodia, Indonesia, Pakistan, the Philippines, Sri Lanka and Vietnam had lost their market share to China in the first year following the MFA phase out. However, because of the safeguard measures, China’s market share reduced in 2006, with all the above mentioned countries except Cambodia enjoying an enhanced share.
Turning to the US market, it is also found that after the imposition of restrictions in the latter half of 2005, China’s growth in 2006 has almost stagnated (table 7.2). On the other hand, countries like Bangladesh,
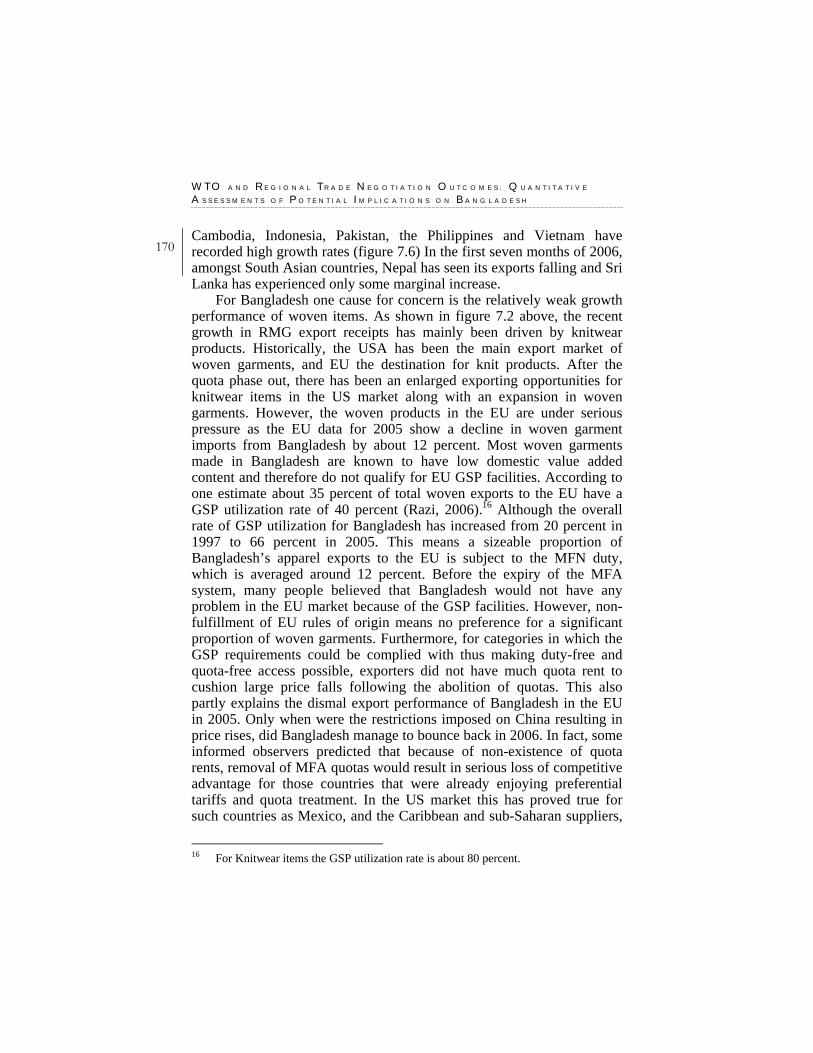
W T O A N D R E G I O N A L T R A D E N E G O T I A T I O N O U T C O M E S : Q U A N T I T A T I V E
A S S E S S M E N T S O F P O T E N T I A L I M P L I C A T I O N S O N B A N G L A D E S H
170 Cambodia, Indonesia, Pakistan, the Philippines and Vietnam have recorded high growth rates (figure 7.6) In the first seven months of 2006, amongst South Asian countries, Nepal has seen its exports falling and Sri Lanka has experienced only some marginal increase.
For Bangladesh one cause for concern is the relatively weak growth performance of woven items. As shown in figure 7.2 above, the recent growth in RMG export receipts has mainly been driven by knitwear products. Historically, the USA has been the main export market of woven garments, and EU the destination for knit products. After the quota phase out, there has been an enlarged exporting opportunities for knitwear items in the US market along with an expansion in woven garments. However, the woven products in the EU are under serious pressure as the EU data for 2005 show a decline in woven garment imports from Bangladesh by about 12 percent. Most woven garments made in Bangladesh are known to have low domestic value added content and therefore do not qualify for EU GSP facilities. According to one estimate about 35 percent of total woven exports to the EU have a GSP utilization rate of 40 percent (Razi, 2006).16 Although the overall rate of GSP utilization for Bangladesh has increased from 20 percent in 1997 to 66 percent in 2005. This means a sizeable proportion of Bangladesh’s apparel exports to the EU is subject to the MFN duty, which is averaged around 12 percent. Before the expiry of the MFA system, many people believed that Bangladesh would not have any problem in the EU market because of the GSP facilities. However, non-fulfillment of EU rules of origin means no preference for a significant proportion of woven garments. Furthermore, for categories in which the GSP requirements could be complied with thus making duty-free and quota-free access possible, exporters did not have much quota rent to cushion large price falls following the abolition of quotas. This also partly explains the dismal export performance of Bangladesh in the EU in 2005. Only when were the restrictions imposed on China resulting in price rises, did Bangladesh manage to bounce back in 2006. In fact, some informed observers predicted that because of non-existence of quota rents, removal of MFA quotas would result in serious loss of competitive advantage for those countries that were already enjoying preferential tariffs and quota treatment. In the US market this has proved true for such countries as Mexico, and the Caribbean and sub-Saharan suppliers,
16 For Knitwear items the GSP utilization rate is about 80 percent.
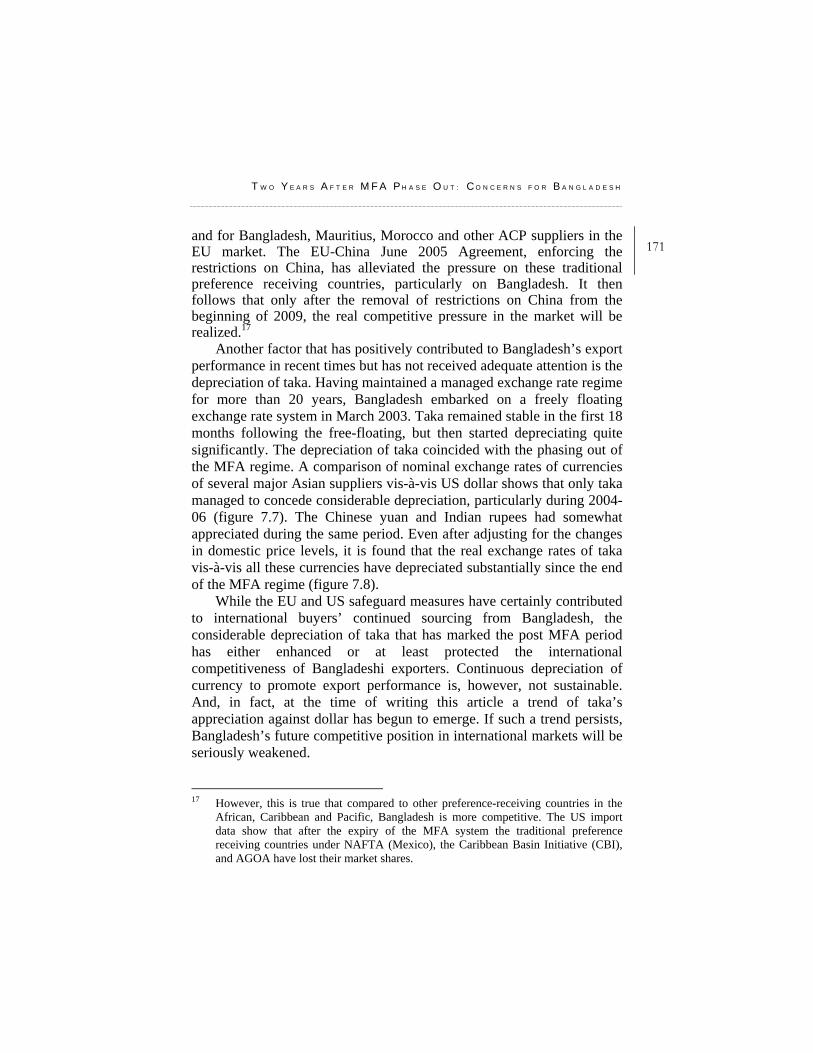
T W O Y E A R S A F T E R M F A P H A S E O U T : C O N C E R N S F O R B A N G L A D E S H
171and for Bangladesh, Mauritius, Morocco and other ACP suppliers in the EU market. The EU-China June 2005 Agreement, enforcing the restrictions on China, has alleviated the pressure on these traditional preference receiving countries, particularly on Bangladesh. It then follows that only after the removal of restrictions on China from the beginning of 2009, the real competitive pressure in the market will be realized.17
Another factor that has positively contributed to Bangladesh’s export performance in recent times but has not received adequate attention is the depreciation of taka. Having maintained a managed exchange rate regime for more than 20 years, Bangladesh embarked on a freely floating exchange rate system in March 2003. Taka remained stable in the first 18 months following the free-floating, but then started depreciating quite significantly. The depreciation of taka coincided with the phasing out of the MFA regime. A comparison of nominal exchange rates of currencies of several major Asian suppliers vis-à-vis US dollar shows that only taka managed to concede considerable depreciation, particularly during 2004-06 (figure 7.7). The Chinese yuan and Indian rupees had somewhat appreciated during the same period. Even after adjusting for the changes in domestic price levels, it is found that the real exchange rates of taka vis-à-vis all these currencies have depreciated substantially since the end of the MFA regime (figure 7.8).
While the EU and US safeguard measures have certainly contributed to international buyers’ continued sourcing from Bangladesh, the considerable depreciation of taka that has marked the post MFA period has either enhanced or at least protected the international competitiveness of Bangladeshi exporters. Continuous depreciation of currency to promote export performance is, however, not sustainable. And, in fact, at the time of writing this article a trend of taka’s appreciation against dollar has begun to emerge. If such a trend persists, Bangladesh’s future competitive position in international markets will be seriously weakened. 17 However, this is true that compared to other preference-receiving countries in the
African, Caribbean and Pacific, Bangladesh is more competitive. The US import data show that after the expiry of the MFA system the traditional preference receiving countries under NAFTA (Mexico), the Caribbean Basin Initiative (CBI), and AGOA have lost their market shares.
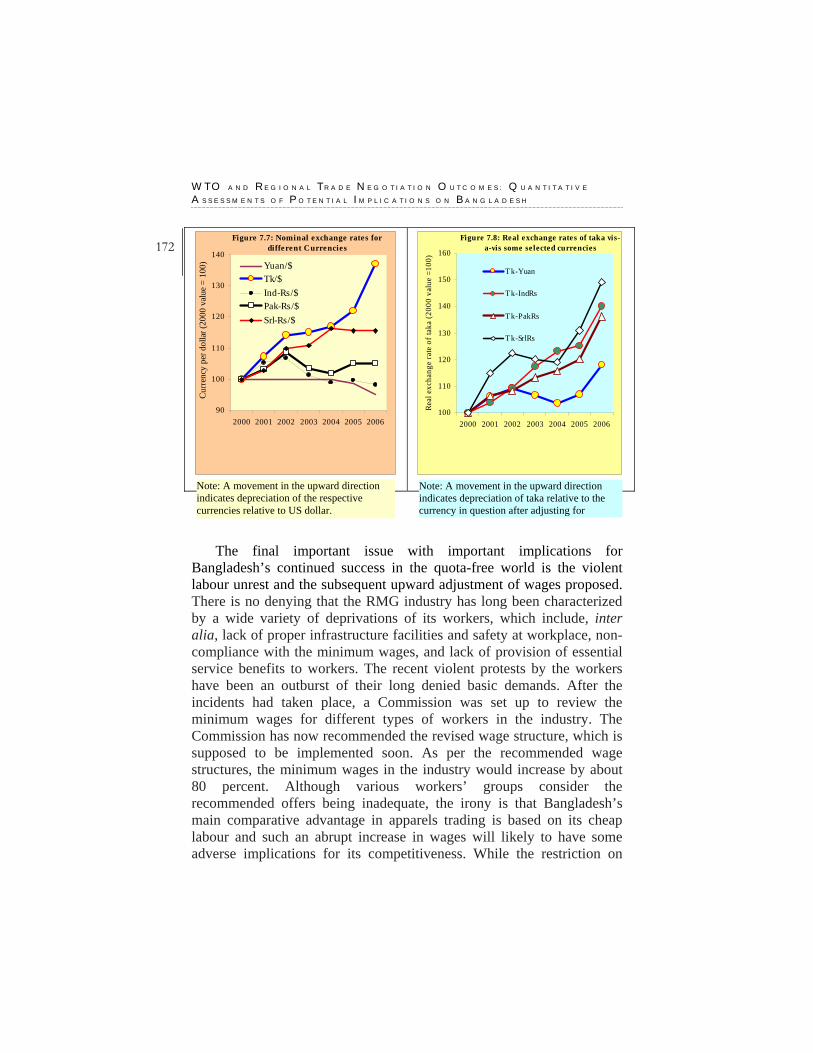
W T O A N D R E G I O N A L T R A D E N E G O T I A T I O N O U T C O M E S : Q U A N T I T A T I V E
A S S E S S M E N T S O F P O T E N T I A L I M P L I C A T I O N S O N B A N G L A D E S H
172 Figure 7.7: Nominal exchange rates for
different Currencies
90
100
110
120
130
140
2000 2001 2002 2003 2004 2005 2006
Cur
renc
y pe
r dol
lar (
2000
val
ue =
100
) Yuan/$Tk/$Ind-Rs/$Pak-Rs/$Srl-Rs/$
Figure 7.8: Real exchange rates of taka vis-a-vis some selected currencies
100
110
120
130
140
150
160
2000 2001 2002 2003 2004 2005 2006Re
al e
xcha
nge
rate
of t
aka
(200
0 va
lue
=100
)
Tk-Yuan
Tk-IndRs
Tk-PakRs
Tk-SrlRs
The final important issue with important implications for
Bangladesh’s continued success in the quota-free world is the violent labour unrest and the subsequent upward adjustment of wages proposed. There is no denying that the RMG industry has long been characterized by a wide variety of deprivations of its workers, which include, inter alia, lack of proper infrastructure facilities and safety at workplace, non-compliance with the minimum wages, and lack of provision of essential service benefits to workers. The recent violent protests by the workers have been an outburst of their long denied basic demands. After the incidents had taken place, a Commission was set up to review the minimum wages for different types of workers in the industry. The Commission has now recommended the revised wage structure, which is supposed to be implemented soon. As per the recommended wage structures, the minimum wages in the industry would increase by about 80 percent. Although various workers’ groups consider the recommended offers being inadequate, the irony is that Bangladesh’s main comparative advantage in apparels trading is based on its cheap labour and such an abrupt increase in wages will likely to have some adverse implications for its competitiveness. While the restriction on
Note: A movement in the upward direction indicates depreciation of the respective currencies relative to US dollar.
Note: A movement in the upward direction indicates depreciation of taka relative to the currency in question after adjusting for

T W O Y E A R S A F T E R M F A P H A S E O U T : C O N C E R N S F O R B A N G L A D E S H
173China until the end of 2008, will give Bangladesh some time for adjustment so that the rise in labour costs can be outweighed by other cost-reducing measures. Apart from labour issues, political unrests, which are often manifested in country-wide strikes and blockades, frequent power outages, inefficient ports and inland transportation, and high costs of doing business, will all have important bearing on the country’s continued export success. 7.5. MFA Phase Out: A Blessing for Bangladesh? Despite Bangladesh’s posting some robust export growth rates in the first 18 months following the quota phase out, there are credible reasons to believe that the safeguard measures imposed on China both by the EU and US have critically supported the country’s achieving such an impressive performance. Removal of all restrictions from China, which is to take effect from the very beginning of 2009, would definitely lead to a much more challenging situation. Only in the first six months of 2005 China was allowed to export freely and Bangladesh eventually saw its exports for that year declining in the EU market. Although no such trend could be observed in the US market, Bangladesh was found to have performed much better after the quantitative limits had been slapped on China. There is a high similarity between export items of Bangladesh and China in the US market and consequently free trade in that market will potentially open up a fierce competition between these two suppliers.18 It might be that the previously existing quota rents had helped Bangladesh keep afloat in the US market before quantitative limits were imposed on China. On the other hand, the quota-free access to the EU market even before the expiry of the quota regime dissipated all quota rents for Bangladesh, making it unable to cushion the price fall that marked the transition to post-MFA period causing export receipts to decline. In this backdrop, there are genuine concerns to suppose that in a truly free trade situation China would pose formidable challenge to Bangladesh and other suppliers.
18 The evidence of high similarity between the export products of Bangladesh and
China has been provided in Mlachila and Yang (2004)
W T O A N D R E G I O N A L T R A D E N E G O T I A T I O N O U T C O M E S : Q U A N T I T A T I V E
A S S E S S M E N T S O F P O T E N T I A L I M P L I C A T I O N S O N B A N G L A D E S H
174 During the transition to quota-free trade regime, Bangladesh’s
exporters have also benefited from a depreciated exchange rate, which is unlikely to continue for an indefinite period. Furthermore, the recently proposed wage hike in the garment industry will surely erode some competitive margin. Supply side bottlenecks aggravated by destructive political unrest and excessive cost of doing business are always major causes for concern and failure to make improvements in these areas will only undermine the export prospect under a real restriction-free clothing trade regime. In fine, a quota-free world with restricted supplies from the world’s most efficient producer has been a blessing for Bangladesh for its exporters to stage a stunning performance, which, however, might turn into a short episode before the real free-trade situation being installed in about two years from now.
There are, however, few reasons to hope that China’s impact on Bangladesh export may not be as severe as projected. Firstly, The EU and the US can make use of other general as well as China specific trade remedy measures to block the surge of imports from China. While the possibility of the imposition of anti-dumping duties on Chinese exports cannot be ruled out, there are two other China specific trade remedy measures, included in China’s Protocol of Accession to the WTO. Second, until 2013, it is possible for the WTO members to impose “selective” safeguard against any Chinese exports that cause “market disruption.” Third, until 2016, it is possible to use “non-market economy” criteria against China to calculate “dumping margin” in the process of anti-dumping investigation, which inflates the dumping margin, subjecting the Chinese imports to a higher anti-dumping duty. And finally, China is in the process of outgrowing its comparative advantage in T&C sector in general. It is likely to focus more on export of value added T&C, machineries, electrical equipments and electronic products in which it has comparative advantages.
CHAPTER EIGHT
Selim Raihan and Rabeya Khatoon
WTO’s “Aid for Trade”: Issues and Concerns
8.1. Introduction International aid circulating from the developed to the developing and least developed countries is not new. Along with its other bilateral and multilateral characteristics, there is a common ideology that international assistance comes with some development strategies, designed by the developed country experts in most of the cases. However, in international trade negotiations under WTO talks, a new concept of Aid for Trade (AfT) has been incorporated in the Hong Kong Ministerial Declaration for the first time, as a special and committed assistance aimed at fostering trade. AfT has an initial objective of helping specially the LDCs and also the developing countries to maximise the benefits from enhanced market access as well as to minimise the costs of trade liberalisation. This new part of negotiation is subject to a relatively short time preparation in terms of definition, distinction between provisions for developing and least developed countries, and therefore, reaching agreements under the ongoing Doha Round of negotiations. It can,
W T O A N D R E G I O N A L T R A D E N E G O T I A T I O N O U T C O M E S : Q U A N T I T A T I V E
A S S E S S M E N T S O F P O T E N T I A L I M P L I C A T I O N S O N B A N G L A D E S H
176 therefore, be argued that the policy makers in Bangladesh need to understand the dynamics of AfT with a view to reap the maximum benefits out of it. The purpose of this chapter is thus to provide an overview of the issues related to AfT, which can have important implications for Bangladesh. 8.2. Negotiations on Aid for Trade Going beyond the trade theory implications, different country experiences suggest that trade liberalisation alone cannot act for growth and development. Especially for the LDCs, lack of trade related infrastructure facilities and deficiency of knowledge on market access potentials deprive them from gaining through greater openness. In a recent study, it has been estimated that in terms of economic welfare gains, full merchandise trade liberalisation, along with removal of domestic supports, will result in US$ 141 billion increase in the income of developing and least developed countries (New farmer and Nowak, 2006). However, to reap this benefit, the countries are badly in need of international assistance for trade negotiations and capacity building.
On the other hand, the costs of trade liberalisation in terms of, for example, preference erosion, impact of increased food price for net food importing countries, adjustment costs during economic policy changes with resource reallocation and impacts on shaping national development policies, signifies the need for assistance for the developing and least developed countries. The first meeting after the formation of WTO addressed the issue and from 1997, there was an initiative for strengthening LDCs’ trade capacities known as the Integrated Framework (IF) for Trade-Related Technical Assistance to the Least Developed Countries supported by six donors, the IMF, ITC, UNCTAD, UNDP, the World Bank and the WTO, with OECD/DAC as observer. Although the amount of aid for trade-related technical assistance and capacity building has increased significantly from the beginning of the Doha development round in 2001 (see, figure 8.1), at the end stage, to make it really pro-developmental, the Hong Kong Ministerial Declaration included AfT as a formal clause in article 57.
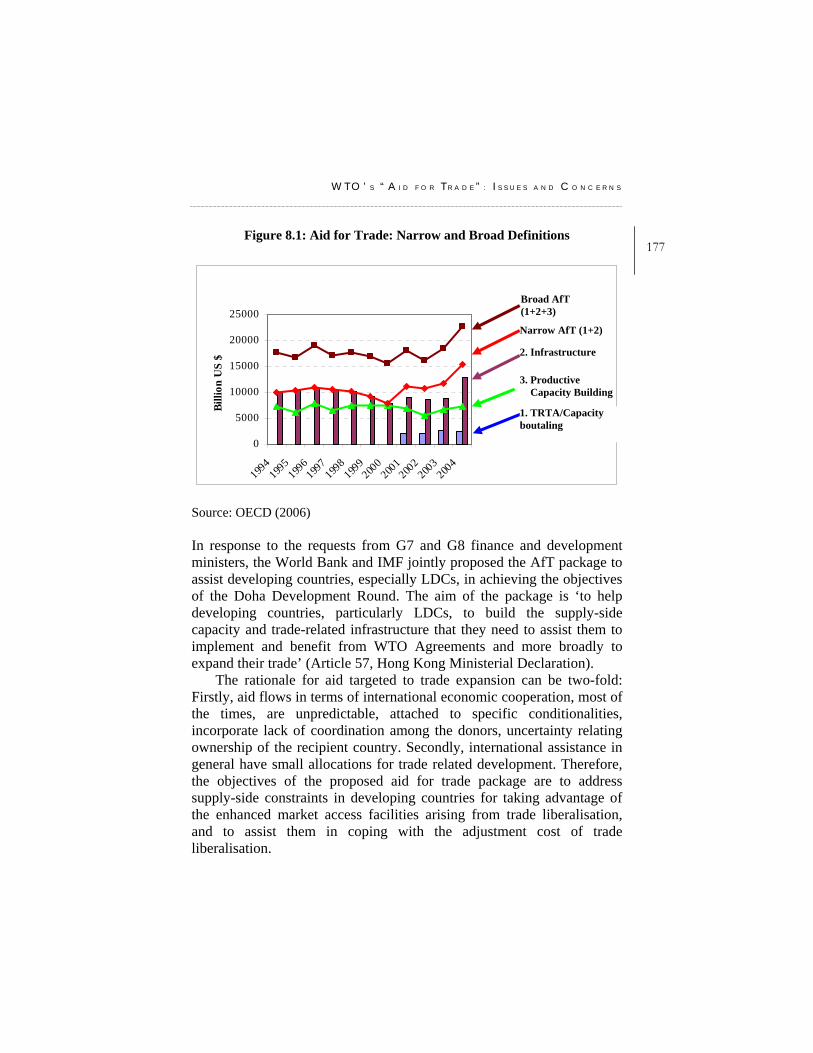
W T O ’ S “ A I D F O R T R A D E ” : I S S U E S A N D C O N C E R N S
177Figure 8.1: Aid for Trade: Narrow and Broad Definitions
0
5000
10000
15000
20000
25000
1994
1995
1996
1997
1998
1999
2000
2001
2002
2003
2004
Billi
on U
S $
Source: OECD (2006) In response to the requests from G7 and G8 finance and development ministers, the World Bank and IMF jointly proposed the AfT package to assist developing countries, especially LDCs, in achieving the objectives of the Doha Development Round. The aim of the package is ‘to help developing countries, particularly LDCs, to build the supply-side capacity and trade-related infrastructure that they need to assist them to implement and benefit from WTO Agreements and more broadly to expand their trade’ (Article 57, Hong Kong Ministerial Declaration).
The rationale for aid targeted to trade expansion can be two-fold: Firstly, aid flows in terms of international economic cooperation, most of the times, are unpredictable, attached to specific conditionalities, incorporate lack of coordination among the donors, uncertainty relating ownership of the recipient country. Secondly, international assistance in general have small allocations for trade related development. Therefore, the objectives of the proposed aid for trade package are to address supply-side constraints in developing countries for taking advantage of the enhanced market access facilities arising from trade liberalisation, and to assist them in coping with the adjustment cost of trade liberalisation.
Broad AfT (1+2+3)
Narrow AfT (1+2)
2. Infrastructure
3. Productive Capacity Building
1. TRTA/Capacity boutaling
W T O A N D R E G I O N A L T R A D E N E G O T I A T I O N O U T C O M E S : Q U A N T I T A T I V E
A S S E S S M E N T S O F P O T E N T I A L I M P L I C A T I O N S O N B A N G L A D E S H
178 8.3. The Current Status and the Achievements The director general of WTO formed the Task Force for operationalising AfT in February 2006 with 13 member countries/regions to provide recommendations to the WTO general council by July 2006. The objectives of the task force were to examine the scope of existing AfT, outstanding needs or gaps, the kind of delivery mechanisms needed to address those gaps, and how AfT can contribute to the development dimension of the Doha Round. The Task Force was set for encouraging concrete and result oriented proposals and communications form different international agencies and country groups in response to the written questions sent by the Task Force.
The report submitted by the Task Force placed recommendations for shaping and operationalising the AfT program processed through strengthening ‘demand’ and ‘response’ from the recipients and donors. The report explicitly mentioned that sectors to be considered under the AfT program should be included in the national development agenda of the country, such as PRSP. Therefore, the recommendations include recipient countries to mainstream trade related aspects separately in their development strategies. The countries are suggested to form National Aid for Trade Committee to work for identifying national priority programmes and projects and evaluate the total AfT program, and to incorporate the private sector, besides the public sector, in the development works and initiatives relating greater trade openness. Besides the country level suggestions, the report placed some regional (including sub-regional and cross-border) and global balancing strategies between the demands and responses of AfT. According to the report, AfT should target for enhanced regional integration; there should be initiatives for regional needs assessment and the possibility of establishing Regional AfT committee can also be explored. Construction of a global database and the provision for multilateral channels for AfT are highlighted in the report too. All these require assigning responsibility to specific authorities.
In terms of defining AfT, there are four pillars that have been set out: • Pillar 1: Capacity building to address supply constraints One of the major problems the developing and least developed countries face in utilising the preferential market access in developed countries is
W T O ’ S “ A I D F O R T R A D E ” : I S S U E S A N D C O N C E R N S
179lack of supply-side capacity. In most of the cases, their technical and industrial capacity does not support the qualitative and quantitative requirements set by international importers. The suggestions and negotiations of AfT extend the scope of providing financial support to not only these supply side capacity building initiatives, but also for facilitating the trade in services, rules and dispute settlement. • Pillar 2: Trade related infrastructure The problem of lack of infrastructure facilities is acute for the LDCs involving poor transportation, port and customs, and storage facilities, along with power supply and communication system. The marketing and distribution facilities are far from satisfactory level and therefore needs assistance for improved trade integration. • Pillar 3: Trade system costs: adjustment and implementation Trade liberalisation results in adjustment and implementation costs for the shift of competitive advantage and sectoral composition of the economy. • Pillar 4: Trade policy development and participation in rules-
making AfT scopes and contents so far include assisting diagnostic work, investment lending (larger investment operations), technical assistance and budget support, trade integration mechanism and integrated framework, impact and needs assessment, improving trade related global public goods, e.g. trade databases, analytical tools etc. and ensuring country ownership of trade strategy.
8.4. The Concerns over Aid for Trade Aid for Trade has reached a common consensus in terms of its necessity and rationale in assisting pro-development trade liberalisation. However, in terms of agreements concerning the size of the fund, the source and channel of provision and differentiating between developing and least
W T O A N D R E G I O N A L T R A D E N E G O T I A T I O N O U T C O M E S : Q U A N T I T A T I V E
A S S E S S M E N T S O F P O T E N T I A L I M P L I C A T I O N S O N B A N G L A D E S H
180 developed countries, little or no progress has been made. There should be proper needs assessment for suggesting on the size of the fund. Enhanced integrated framework approach or, ‘add on’ to the multilateral donor agencies assistance can act as the process of management of the fund.
Additionally, the Task Force report identified some gaps concerning Aid for Trade. The challenges include low attention to trade and therefore lack of mainstreaming trade in national development agenda, lack of ownership of aid at the country level, lack of accountability in distributive management-bureaucratic inefficiencies in general, lack of predictability of donor response, limited adsorptive capacity of the developing countries and lack of assessing adjustment costs, and over all, information and monitoring deficiencies, and uneven country coverage. 8.5. Policy Implications and Conclusion Aid for Trade should be incorporated in the national growth and development agenda of a country to act effectively on its goal, rather than being implemented separately. For this, mainstreaming of trade in national development agenda is very important.
In broader sense, there are three determinants of export performance: domestic productive capacity, trade related infrastructure including transport and storage facilities and effective market access. AfT can work for enhancing the first two, and therefore, providing assistance for capacity building in market access negotiations. Balance of payments problems can be tackled by gradual improvement of productive efficiency which will help reducing import dependence.
Different donor agencies have different rules and regulations regarding funding. There is a need for coordination, based on some common rules, to bring them altogether to contribute to a stable and predictable source of Aid for Trade.
Aid for Trade as a development agenda, is aimed to reduce poverty which cannot be achieved without more and better employment generation. Therefore, the programme should explicitly include employment dimension to act as pro-poor.
A study by Cordella and Ulku (2004) in assessing the effectiveness of AfT disbursed under the IF program so far found that loans are more efficiently invested for productive purposes than grants except in sectors
W T O ’ S “ A I D F O R T R A D E ” : I S S U E S A N D C O N C E R N S
181like health and education. Further, countries with good policies and a higher absorption capacity benefits most from larger loans, and countries with higher poverty and poor absorption capacity are better off with grants even of a lower amount.
Finally, it can be suggested that the effectiveness of Aid is subject to a better partnership arrangement between the recipient country government and the donor agencies in terms of ownership of funds, alignment with the agendas of the partners and harmonisation in terms of information and simplification along with mutual accountability.
CHAPTER NINE
Abdur Razzaque and Selim Raihan
WTO Negotiations on Trade in Services: The Bangladesh Perspective
9.1. Introduction The service sector now constitutes more then half of Bangladesh’s GDP and is the second largest source of employment in the country. In Bangladesh the growth of the service sector has been faster than the overall GDP growth. Between 1995 and 2003, Bangladesh registered an expansion of services value added by US$ 9 billion.
Remittances sent by nationals working abroad is a significant source of foreign exchange earnings in Bangladesh, implying the importance of labour-based services exports. Currently, the remittances-GDP ratio for Bangladesh is estimated to be about 6 percent. It needs to be mentioned here that a significant proportion of remittances sent to Bangladesh is channelled through the informal mechanism (e.g. hundi) and thus is not included in the official record. The inclusion of remittances sent through the informal channel would further have significantly amplified the importance of remittances in GDP, as there is a general perception that informal sources could comprise 25-50 percent of all money sent by the people working abroad.
W T O N E G O T I A T I O N S O N T R A D E I N S E R V I C E S : T H E B A N G L A D E S H P E R S P E C T I V E
183In general, low-skilled and semi-skilled workers dominate the labour
endowment in Bangladesh. Consequently, the export of services from this country is dominated by mode 4 exports (i.e. movement of natural persons). Currently more than 3 million Bangladeshis are working abroad.
It can be argued that global liberalisation in the service sector, especially allowing temporary movement of natural persons, can have a vital role in the alleviation of poverty in the developing countries in general and in the LDCs in particular. It has been argued that liberalising the movement of natural persons, i.e., by introducing a temporary visa system in rich countries permitting movement of labour up to 3 percent of the total labour force, would increase world incomes by nearly US$ 160 billion (Winters and Walmsley, 2002). However, regarding the liberalisation of the movement of natural persons little progress has been made in the WTO negotiations. The agreements so far achieved at WTO – and in various regional talks like the NAFTA and the EU’s Agreements with East and Central European countries – mostly concerned with relatively highly skilled workers (McCulloch et. al. 2001). McCulloch et. al (2001) argue that when skilled personnel leave a developing country for a developed one, typically their incomes are increased significantly. This contributes to raising the national income of the developing country, but its poverty implication is not so clear. Since skilled workers were initially non-poor, it does not entail direct contribution to poverty alleviation. But, if the higher incomes of these skilled workers lead to greater remittances in the developing country, there could be a positive effect. Furthermore, working abroad may facilitate individuals to acquire greater skills and these benefits would be doubled if they eventually returned home. On the contrary, liberalising the movement of low-and medium-skilled workers from the developing countries to the developed one is a far more secure route to general income growth and poverty alleviation in the developing countries. As because, developed countries are poorly endowed with low-and medium skilled people, the income increase for these people is likely to be proportionately larger and by moving, they also reduce the over-supply of labour at home. Moreover, far more workers would potentially be affected at the less skilled than at the highly skilled end of the spectrum. The upshots of the above discussion point to fact that Bangladesh should concentrate on negotiating for gaining market access of her low and semi-skilled labour in the developed countries.
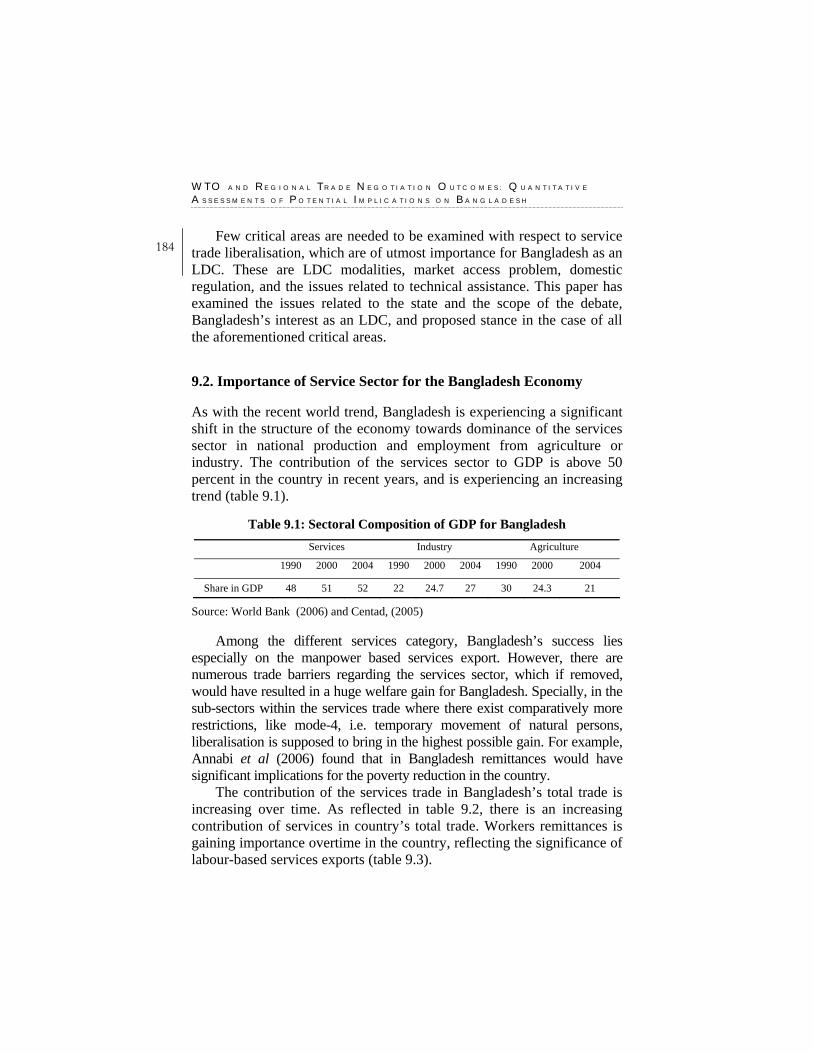
W T O A N D R E G I O N A L T R A D E N E G O T I A T I O N O U T C O M E S : Q U A N T I T A T I V E
A S S E S S M E N T S O F P O T E N T I A L I M P L I C A T I O N S O N B A N G L A D E S H
184 Few critical areas are needed to be examined with respect to service
trade liberalisation, which are of utmost importance for Bangladesh as an LDC. These are LDC modalities, market access problem, domestic regulation, and the issues related to technical assistance. This paper has examined the issues related to the state and the scope of the debate, Bangladesh’s interest as an LDC, and proposed stance in the case of all the aforementioned critical areas. 9.2. Importance of Service Sector for the Bangladesh Economy As with the recent world trend, Bangladesh is experiencing a significant shift in the structure of the economy towards dominance of the services sector in national production and employment from agriculture or industry. The contribution of the services sector to GDP is above 50 percent in the country in recent years, and is experiencing an increasing trend (table 9.1).
Table 9.1: Sectoral Composition of GDP for Bangladesh
Services Industry Agriculture
1990 2000 2004 1990 2000 2004 1990 2000 2004
Share in GDP 48 51 52 22 24.7 27 30 24.3 21
Source: World Bank (2006) and Centad, (2005)
Among the different services category, Bangladesh’s success lies especially on the manpower based services export. However, there are numerous trade barriers regarding the services sector, which if removed, would have resulted in a huge welfare gain for Bangladesh. Specially, in the sub-sectors within the services trade where there exist comparatively more restrictions, like mode-4, i.e. temporary movement of natural persons, liberalisation is supposed to bring in the highest possible gain. For example, Annabi et al (2006) found that in Bangladesh remittances would have significant implications for the poverty reduction in the country.
The contribution of the services trade in Bangladesh’s total trade is increasing over time. As reflected in table 9.2, there is an increasing contribution of services in country’s total trade. Workers remittances is gaining importance overtime in the country, reflecting the significance of labour-based services exports (table 9.3).
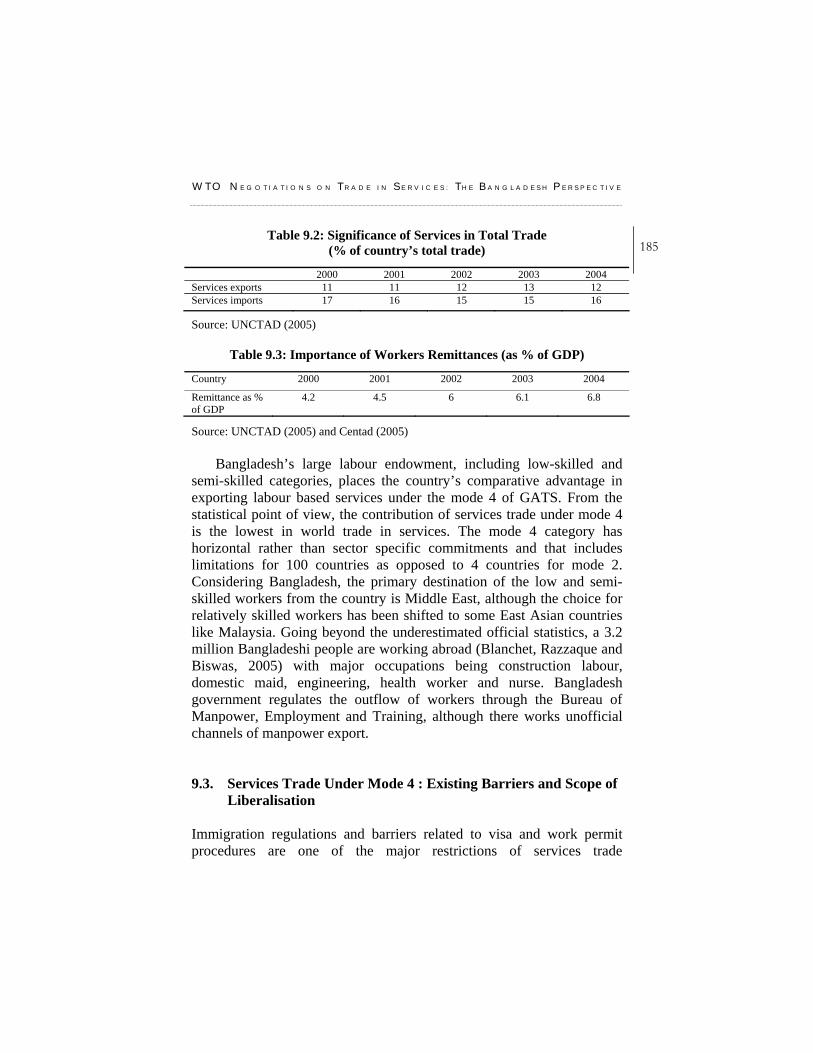
W T O N E G O T I A T I O N S O N T R A D E I N S E R V I C E S : T H E B A N G L A D E S H P E R S P E C T I V E
185Table 9.2: Significance of Services in Total Trade
(% of country’s total trade) 2000 2001 2002 2003 2004 Services exports 11 11 12 13 12 Services imports 17 16 15 15 16
Source: UNCTAD (2005)
Table 9.3: Importance of Workers Remittances (as % of GDP) Country 2000 2001 2002 2003 2004
Remittance as % of GDP
4.2 4.5 6 6.1 6.8
Source: UNCTAD (2005) and Centad (2005)
Bangladesh’s large labour endowment, including low-skilled and semi-skilled categories, places the country’s comparative advantage in exporting labour based services under the mode 4 of GATS. From the statistical point of view, the contribution of services trade under mode 4 is the lowest in world trade in services. The mode 4 category has horizontal rather than sector specific commitments and that includes limitations for 100 countries as opposed to 4 countries for mode 2. Considering Bangladesh, the primary destination of the low and semi-skilled workers from the country is Middle East, although the choice for relatively skilled workers has been shifted to some East Asian countries like Malaysia. Going beyond the underestimated official statistics, a 3.2 million Bangladeshi people are working abroad (Blanchet, Razzaque and Biswas, 2005) with major occupations being construction labour, domestic maid, engineering, health worker and nurse. Bangladesh government regulates the outflow of workers through the Bureau of Manpower, Employment and Training, although there works unofficial channels of manpower export. 9.3. Services Trade Under Mode 4 : Existing Barriers and Scope of
Liberalisation Immigration regulations and barriers related to visa and work permit procedures are one of the major restrictions of services trade
W T O A N D R E G I O N A L T R A D E N E G O T I A T I O N O U T C O M E S : Q U A N T I T A T I V E
A S S E S S M E N T S O F P O T E N T I A L I M P L I C A T I O N S O N B A N G L A D E S H
186 liberalisation, especially under mode 4 of services trade. In most of the cases, no distinction has been made between temporary and permanent movement of workers and the process involves complicated, non-transparent and costly steps through labour market regulations. Even, sometimes temporary workers have to undergo a two-permit entry procedure : one for visa and the other for work permit. The restrictions and regulations get more demanding for the developing and least developed countries due to their existing administrative barriers. Moreover, service trade barriers for developing country suppliers are more binding than for developed country suppliers in each other’s market.
In terms of migration regulations, they are biased towards high skilled workers and it is relatively easier to obtain visa for intracompany transferees and those associated with establishment of commercial presence. In general, movement of low skilled workers is the most restricted one. There are barriers in terms of Economic Needs Test which restricts the market driven process of free movement of natural persons. Lack of clearly established criteria of service providers make the process unpredictable, non-transparent and therefore create arbitrary barriers to mode 4.
The evaluation process of quality and skills of workers in the developing countries and LDCs is considerably underscored. Domestic constraints like lack of uniformity in training and standards within the country upgraded the recognition requirements for the developing and the least developed countries. To assess qualification and skills, some countries apply Mutual Recognition Agreements (MRA) which is mostly used for certified and licensed professionals who already have internationally established standards. There are different testing procedures like USMLE for medical professionals and CGFNS for nursing in the developed countries like USA prior to providing license for job to foreigners.
All stated above act as barriers to service trade liberalisation especially for Bangladesh affecting her areas of comparative advantage. In addition to service categorization and classification problems, commitments under mode 4 is the least in WTO services negotiations and after the incident of nine-eleven, 2001, there is not much scope for considerable liberalisation in this regard.
W T O N E G O T I A T I O N S O N T R A D E I N S E R V I C E S : T H E B A N G L A D E S H P E R S P E C T I V E
1879.4. Review of the Hong Kong Ministerial Outcomes The issue of trade in services is often termed as the least controversial among WTO negotiations. However, because of a sluggish progress achieved in services talks even after the mandated renewed negotiations beginning from 2000, in the July framework members were urged to make ‘high quality of offers’, with a view to ensuring ‘substantive outcome’ particularly in sectors and modes of supply of export interest to developing countries, with special attention to be given to least developed countries. Members were also supposed to ‘aim to achieve’ progressively higher levels of liberalisation with no a priori exclusion of any service sector or mode of supply and to give special attention to sectors and modes of supply of export interest to developing countries.
In the Hong Kong Ministerial Conference, Members had agreed to intensify the negotiations on services ‘with a view to expanding the sectoral and modal coverage of commitments and improving their quality’ (paragraph 27). In this document, the service sector trade negotiations are placed from a development perspective for all the member countries. The declaration specifies special provisions for the developing countries and the LDCs.
Annex C of the Hong Kong Ministerial Declaration provides the guideline for future negotiations with specified objectives to facilitate services trade liberalisation under the four modes of negotiation. There are several interesting features associated with this latest Ministerial Declaration.
• While there is a great deal of controversy about the extent to which the framework for services negotiations cater to the needs of developing countries, LDCs have secured certain important provisions. The Hong Kong Declaration, for the first time, explicitly recognizes that LDCs are not expected to undertake new commitments in services negotiations (paragraph 26). This provision is to protect LDCs from liberalizing sectors where they do not wish to make a commitment.
It should be noted here that the formal exemption of LDCs from undertaking any new commitments may result in lack of interest for LDCs in participating to negotiations and to look for the advantages that they can take being a mere observer. Further, from the basic trade theory suggestions, being reluctant to
W T O A N D R E G I O N A L T R A D E N E G O T I A T I O N O U T C O M E S : Q U A N T I T A T I V E
A S S E S S M E N T S O F P O T E N T I A L I M P L I C A T I O N S O N B A N G L A D E S H
188 liberalise may result in depriving the LDCs from potential welfare gains.
• Members have also committed to developing methods for full and effective implementation of the Modalities for the Special Treatment for LDCs in the negotiations on Trade in Services (LDC modalities) (paragraph 25 and item 3 in Annex C). LDC modalities should therefore be an important instrument and the basis for their participation in services negotiations.
• Members are supposed to develop appropriate mechanisms for according special priority to sectors and modes of supply of export interest to LDCs (item 9 (a) in Annex C). Although this provision is a mere reaffirmation of what is already provided for in the LDC modalities, it reflects members’ commitment to resolve it before 31 July 2006. It may be noted that the concept of special priority in trade in services has not been tested or operationalised. Unlike trade in goods, where under the legal cover of enabling clause developed country members can provide preferential market access to LDCs, there has not been any such mechanism in services trade. The LDC modalities, reaffirmed by the Hong Kong Declaration, provided the LDCs an opportunity to work out a framework so that they receive special preference in market access of their services and service suppliers.
However, there is no such initiative from the developed country members to consider the special priority sectors and LDC modes of supply. A more careful reading reveals that the development initiatives relating market access are either objectives for commitments or, procedural under the request-offer approach. There lacks LDC initiatives to prepare a negotiable ground and it is quite reasonable that without proper technical assistance from the developed countries LDCs will not be able to come out identifying areas most important for negotiation for them within such a short time frame.
In the ongoing WTO discussions, developed countries like, US, EU, Canada, Japan and Norway have indicated their intention for implementing the mechanisms for Special and Differential Treatment for LDCs regarding services. However, LDCs termed this as a vague and insufficient attempt to reach an
W T O N E G O T I A T I O N S O N T R A D E I N S E R V I C E S : T H E B A N G L A D E S H P E R S P E C T I V E
189agreement within the Doha round. Specifically, within the GATS document, there is no special provision for the LDCs like ‘non-reciprocal special priority’, and all the rules have their general applicability under ‘non-discriminatory’ basis with Most Favoured Nation (MFN) treatment. The proposal by Zambia in March 2006 on behalf of LDCs focused on this and highlighted the area of negotiation on mode 4 services trade for LDCs.
• The Declaration has emphasized on assisting LDCs to enable them to identify sectors and modes of supply that represent development priorities (item 9(d) in Annex C). The full and effective implementation of the LDC modalities also calls for providing targeted and effective technical assistance and capacity building for LDCs.
• It has been clearly stated that amongst others the targeted technical assistance should be provided through the WTO secretariat ‘with a view to enabling developing and least-developed countries to participate effectively in the trade negotiations’ (item 10 in Annex C).
• Another important inclusion in the Declaration was the reference to give particular attention to sectors and modes of supply of export interest to developing countries (paragraph 27). The Declaration also urged members for new and improved commitments on the categories of Contractual Services Suppliers, Independent Professionals and Others, de-linked from commercial presence, to reflect inter alia removal or substantial reduction of economic needs tests (item 1(d) in Annex C).
• The Declaration reiterates the scope of appropriate flexibility for individual developing countries as provided for in Article XIX of the GATS. This implies a special consideration that the LDCs can make, to take into account the individual interests of the developing countries while designing negotiation strategies.
• Members have been asked to develop disciplines on domestic regulation as mandated under Article VI: 4 of the GATS before the end of the current round of negotiation and there was a call on members to develop text for adoption.
• Members in the Hong Kong Ministerial agreed to pursue plurilateral approach to request-offer negotiations in addition to the traditional bilateral approach to negotiations. Plurilateral
W T O A N D R E G I O N A L T R A D E N E G O T I A T I O N O U T C O M E S : Q U A N T I T A T I V E
A S S E S S M E N T S O F P O T E N T I A L I M P L I C A T I O N S O N B A N G L A D E S H
190 requests will be addressed directly from the demandeurs to other members to whom these are made. The Secretariat is not systematically informed of such requests or their content. Exchanges in those meetings are strictly private, unless otherwise provided for by participants. As stipulated in the Hong Kong Ministerial Declaration, members will organize such meetings with a view to facilitating the participation of all members, taking into account the limited capacity of developing countries and small delegations.
• The Declaration specifically set a timeline for submission of the revised offers by the members within 31 July 2006 and for final draft schedules by 31 October 2006.
Additionally, commitments have been set to reduce the MFN
exemption list and to set duration for the remaining ones. There has been a call for setting timelines and mandates on rule-making regarding emergency safeguard measures, government procurement and balance of payment considerations and developing a working definition of subsidies in services for enhancing necessary exchange of information on multilateral basis.
After the Hong Kong Ministerial, plurilateral meetings took place (27 March-7 April, 2006) to discuss and negotiate the requests. Available information suggests that 22 collective requests had been placed and discussed between demandeurs and demandees. Of these 16 were sector specific, 3 were related to modes of supply (including mode 4), and the final 3 were concerned about the elimination or reduction of existing exemptions from MFN treatment (ICTSD, 2006). Amongst the developed countries, Japan had participated in 13 requests, while the EU and US joined in 12. Hong Kong, from the developing world, has shown the strongest offensive interest in services trade participating in 11 requests followed by Mexico (10), Singapore (9), and Chile (8). The plurilateral requests on mode 4 involved a highest number of 15 developing countries and none of the LDCs had received any plurilateral request, which is consistent with the Hong Kong Declaration that they are not expected to undertake new commitments.
W T O N E G O T I A T I O N S O N T R A D E I N S E R V I C E S : T H E B A N G L A D E S H P E R S P E C T I V E
1919.5. Bangladesh’s Position on Hong Kong Ministerial Issues At the Hong Kong Ministerial Conference, the text on services (Annex C) was vigorously opposed by many civil society groups. Doubts and skepticisms were expressed particularly about the new plurilateral approach of negotiations. It is being feared that this new approach will erode the existing flexibilities under GATS and eventually leads to binding commitments by developing countries. Another concern was related to opening up of essential services such as water, energy, etc.
Given the features discussed above, the focus of the present study is on the developmental elements in services negotiations from the perspectives of Bangladesh. Here some issues of specific interest are presented to fulfill this objective. 9.5.1. LDC Modalities: Implementation Progress The issues under consideration: One of the most important developments at Hong Kong Ministerial was the decision to pursue towards full and effective implementation of the modalities for the special treatment for LDCs in trade in services. It means developing methods for effective implementation of the LDC modalities, including assisting LDCs to enable them to identify sectors and modes of supply that represent development priorities. The declaration has set out specific timeline for developing appropriate mechanisms regarding this, but there has not been any attempt made to meet the deadline of 31st July 2006.
State and scope of the debate: In Annex C: 9(a) of the Hong Kong Ministerial declaration, it has been clearly written that members ‘shall’ develop mechanisms for according ‘special priority’ to ‘sectors and modes of supply of interest to LDCs’. And as of 11(e), there has been set a binding timeline of 31st July 2006 for members to complete the requirements. Providing effective access of LDC services and services suppliers in the developed country markets, strengthening of their domestic services capacity, efficiency and competitiveness through access to services technology on a commercial basis, providing information on ‘registration, recognition and obtaining of professional qualifications’- all these were committed in the GATS article IV and followed up in LDC modalities and Hong Kong Ministerial declarations for implementation purposes.
W T O A N D R E G I O N A L T R A D E N E G O T I A T I O N O U T C O M E S : Q U A N T I T A T I V E
A S S E S S M E N T S O F P O T E N T I A L I M P L I C A T I O N S O N B A N G L A D E S H
192 In comparison to the goods market provisions for Special and
Differential Treatment (S&DT) for LDCs, there is no such arrangement made under GATS negotiations as the achievements and documentations regarding the services trade focus on the developed countries having developing countries under special considerations, and LDCs exempted. According to the GATS document, the rules and commitments made will be applicable for all the members as a whole on an MFN basis. The implementation of LDC modalities with S&DT provisions like goods market was one of the commitments of Hong Kong Declaration.
Bangladesh’s interest and proposed stance: Considering sectors and/or modes of supply of special interest of LDCs, there is a growing importance of temporary movement of natural persons under mode 4. The growth of the services exports of LDCs on the whole, and of Bangladesh in particular, is concentrated in this area with a large pool of low and semi-skilled labour force. Workers remittance is a significant portion of GDP of these countries and its upward trend helps reducing their dependence on foreign aid. However, this area of services trade is the most restrictive one having horizontal commitments rather than sector specific and almost in all cases exhibit the ‘unbound’ note in the negotiation list. As with the progress made in Hong Kong Ministerial declaration, there was a hope for some negotiations towards mode 4 liberalisation, but still there is no development in implementation procedures.
There is not much difference in terms of commitments made by the developed and developing countries so far regarding modes of supply. However, most of the developing countries have their commitments in the modes 1 and 3, while a lesser extent for mode 2. Further, there arise distinctions in terms of the number of commitments made by the Uruguay round members and the members joined afterwards: it has been observed that new members undertook broader commitments.
On the whole, the Bangladesh’s policy stance should focus on negotiations relating the ‘non-reciprocal’ mode 4 liberalisation, separation of temporary from permanent movements of natural persons, and to go for plurilateral negotiations with the developing countries to place the request for multiple entry GATS visa. Further, there should be requests for provisions to bring uniformity in definition of service personnel and to increase coverage.
W T O N E G O T I A T I O N S O N T R A D E I N S E R V I C E S : T H E B A N G L A D E S H P E R S P E C T I V E
1939.5.2. Market Access for LDCs The issues under consideration: LDC modalities call for giving special priority to providing effective market access in sectors and modes of supply of export interest to LDCs (paragraph 6 of LDC modalities). It has been explored in many studies that of the four modes of supply, the mode 4 is the most important one for the developing and the less developed countries. However, market access under mode 4 is the most limited, and still there has not been much progress achieved.
State and scope of the debate: A number of proposals have been placed relating the liberalisation of labour market; although the basic causes of limitation includes the administrative barriers relating immigration policies, quota on visas, mutual recognition of qualifications of the workers. Besides, barriers like economic needs tests or the local needs test also constraint the movement of labour from the developing countries and LDCs.
It is noteworthy that unlike the goods market, where increased market access is used to mean increased tariff cut, market access in the services sector is much complicated and requires special consideration. Therefore, the progress in terms of negotiation process, rather than specified ‘substances’ cannot be underscored.
Bangladesh’s interest and proposed stance: The Service Provider Visa (SPV) proposal placed for greater market access incorporates short term company visits, short term visits to fulfill contracts either as part of juridical entities or independently, and does not cover employment based movement. Further, the emphasis of negotiation in the high skilled and at least minimally qualified persons neglects Bangladesh and many other LDCs comparative advantage. However, this will serve the developing countries like India, not the LDCs like Bangladesh. Therefore, Bangladesh, along with LDCs, should prepare for submitting proposals highlighting the sectors of their interest for consideration of the negotiators focusing on issues like, inclusion of the less skilled under contractual service suppliers under a new sub-category, addressing definitional and classification issues, non-uniform enforcement issues regarding SPV and to develop a revised model schedule to incorporate lower skill categories of service providers. At the same time, Bangladesh and other LDCs should take into consideration the need for (and costs of) commitments to liberalise their own markets in response to their requests
W T O A N D R E G I O N A L T R A D E N E G O T I A T I O N O U T C O M E S : Q U A N T I T A T I V E
A S S E S S M E N T S O F P O T E N T I A L I M P L I C A T I O N S O N B A N G L A D E S H
194 to other countries. Therefore, LDCs may seek for the special provisions under LDC modalities, in terms of ‘non-reciprocal treatment’. 9.5.3. Technical Assistance The issues under consideration: In the Hong Kong Declaration and in GATS agreement, special emphasis has been given on the targeted technical assistance with a view to enabling developing and least developed countries to participate effectively in the negotiations.
State and scope of the debate: It is recognised from the outcome of negotiations on telecommunications that technical assistance benefits countries to come up with specific negotiation schedules. For the developing countries and especially for the LDCs, there lies much importance of the proposed direct technical assistance program for negotiations by five intergovernmental agencies incorporating WTO secretariat itself, UNCTAD, International Trade Center (ITC), the World Bank and International Telecommunication Union (ITU).
Bangladesh’s interest and proposed stance: The complications relating services trade negotiations call for Bangladesh and other LDCs to know ways to deal with intricate matters associated with specific details of various provisions. It is also important for policy makers to be able to assess the potential implications arising out of certain provisions. Furthermore, taking effective participation in services trade may require enacting the necessary domestic regulations in place. All these will require technical assistance to LDCs and their effective utilization. 9.5.4. Domestic Regulations The issues under consideration: In the GATS document and in the Annex C of the Hong Kong Ministerial declaration members have been specifically asked to develop discipline on domestic regulation. There was a timeline set out for members to come up with text for adoption at the end of the current Doha round by December 2006. A consolidated draft text of disciplines was issued on 10 July 2006. The draft paper proposed disciplines to be applicable for all services trade wherever binding liberalisation commitment was made. With respect to the
W T O N E G O T I A T I O N S O N T R A D E I N S E R V I C E S : T H E B A N G L A D E S H P E R S P E C T I V E
195necessity test, the paper considered the opposition from a number of members.
State and scope of the debate: Domestic regulation has its importance in protecting national policy objectives with a reservation of not to be applied as a means for undue trade restrictions. To give some impetus on the need for domestic regulation the followings can be highlighted. First of all, regulation can protect consumers through ensuring quality and appropriateness of services in the midst of wide range of providers under progressive services trade liberalisation. At the same time, regulatory measures can be applied to limit anti-competitive practices that may arise from market penetration by dominant foreign firms. Further, there is a rising concern about repatriation of profits which may result in serious balance of payments crisis for LDCs. LDC governments can regulate this capital outflow by imposing restrictions, like investing in the local securities market, as a measure against potential balance of payments shocks. Moreover, the measures of domestic regulation should aim at ensuring a healthy environment for capital inflows in terms of attracting foreign direct investment and also offer a friendly mechanism incorporating domestic and foreign service providers.
Members were asked to develop disciplines on domestic regulation as mandated under article VI: 4 of the GATS before December 2006. But, no real progress has been achieved so far. However, in presence of confusions among the developing countries (let alone the LDCs) about the appropriateness of development friendly, or set back strategies, and the need for capacity building in this line to come up with a suitable policy framework, the timeline that was set was unrealistic.
Bangladesh’s interest and proposed stance: As for policy stance, there lies common position for Bangladesh and all the LDCs as to place the need for adequate time to come up with appropriate domestic regulation policies considering the specific economic requirements and at the same time to ensure necessary technical assistance for capacity building in this line. Many LDCs as well as developing countries lack established and well functioning regulatory and institutional frameworks. Bangladesh is looking forward for the possible gains coming from plurilateral negotiations among the developing countries. Therefore, one of the strategies for Bangladesh will be to consider the policy stance and comparative advantageous areas of the developing countries. Further,
W T O A N D R E G I O N A L T R A D E N E G O T I A T I O N O U T C O M E S : Q U A N T I T A T I V E
A S S E S S M E N T S O F P O T E N T I A L I M P L I C A T I O N S O N B A N G L A D E S H
196 there should be considerations regarding ensuring adequate regulatory flexibility for LDCs as well as developing countries and possible future disciplines to promote developing countries and LDCs’ export capacities and opportunities.
The provisions for domestic regulation in GATS article VI: 4 apply horizontally for all sectors. Sector specific priorities, e.g. telecommunications, are the potential ones for future consideration. Additionally, the provisions under article VI: 1, 2 or 3 generate some overlapping with market access and national treatment articles, and therefore may result in disciplines creating legal uncertainty. The quantitative maximum set to limit market access and the qualitative minimum under domestic regulation provisions should be distinguished clearly to avoid such confusions.
According to GATS document (article XIX), the developing countries are allowed with appropriate flexibility in an individual country basis for negotiation. This implies the LDC should consider the country specific interests of the developing countries to take proper policy stance. 9.5.5. LDC Negotiation Strategies: Bangladesh Perspectives The issues under consideration: The development element naturally includes LDCs can take part effectively in the negotiation process. In this respect, the Hong Kong Declaration may have serious implications. When LDCs are not required to undertake new commitments, they may also be reluctant to take part in the discussion and negotiations, since they might consider that anything agreed between demandeurs and demandees ( involving other countries) will be passed on to them on an MFN basis. Therefore, there is a need for LDC negotiation strategies taking into account that how seriously a demandeur’s request would be taken into consideration when the demandeur is not expected to offer anything in return.
State and scope of the debate: Bangladesh opened her domestic markets for specific services categories like banking and financial services, but did not place these as binding commitments in the GATS negotiations from the fear of not being able to control in case of serious balance of payments crisis. Commitments of Bangladesh are only for the telecommunication, travel and tourism services. While asking for further
W T O N E G O T I A T I O N S O N T R A D E I N S E R V I C E S : T H E B A N G L A D E S H P E R S P E C T I V E
197mode 4 liberalisation, placement of such requests may call for similar attempts of liberalisation by them, which is again inconsistent to the Hong Kong Declaration of ‘LDCs not supposed to undertake any new commitments’.
Bangladesh’s interest and proposed stance: Bangladesh may place has requests through plurilatral negotiations. She can make use of the domestic regulation provisions for dealing with balance of payment considerations in offering some liberalisation. 9.5.6. LDCs in Plurilateral Negotiations The issues under consideration: Given that LDCs are not expected to undertake new commitments, potentially making their request unattractive to demandees, there lies a scope for Bangladesh whether she can join with other developing countries in making plurilateral request.
Bangladesh’ss interest and proposed stance: Bangladesh should take into account the individual interests of the countries in this respect, and should seriously consider the provision of the Hong Kong Declaration that developing countries have ‘individual’ flexibilities, besides flexibilities enjoyed as a group, in negotiations. 9.6. Concluding Remarks There is no denying the fact that Bangladesh has important stakes in the negotiations on global liberalisation of the service sector. It is understood that that there are significant reasons for Bangladesh for taking firm position in the WTO negotiations in the case of services trade liberalisation, especially with respect to the mode 4. Bangladesh has large endowment of low and semi-skilled labour, and the remittance incomes from the low and semi skilled labour have significant shares in her national incomes. Few critical issues are explored in this paper with respect to service trade liberalisation, which are relevant for Bangladesh as an LDC. These are LDC modalities, market access problem, domestic regulation, service liberalisation under mode 4 and the technical assistance. It is suggested that on the whole, Bangladesh’s policy stance should focus on negotiations relating the ‘non-reciprocal’ mode 4
W T O A N D R E G I O N A L T R A D E N E G O T I A T I O N O U T C O M E S : Q U A N T I T A T I V E
A S S E S S M E N T S O F P O T E N T I A L I M P L I C A T I O N S O N B A N G L A D E S H
198 liberalisation, separation of temporary from permanent movements of natural persons, and to go for plurilateral negotiations with the developing countries to place the request for multiple entry GATS visa. Further, there should be requests for provisions to bring uniformity in definition of service personnel and to increase coverage. To foster the negotiation under mode 4 market access. Bangladesh, along with other LDCs, should prepare for submitting proposals highlighting the sectors of their interest for consideration of the negotiators focusing on issues like, inclusion of the less skilled under contractual service suppliers under a new sub-category, addressing definitional and classification issues, non-uniform enforcement issues to develop a revised model schedule to incorporate lower skill categories of service providers. Bangladesh and others LDCs may seek for special provisions under LDC modalities, in terms of ‘non-reciprocal treatment’. According to GATS document (article XIX), the developing countries are allowed with appropriate flexibility in an individual country basis for negotiation. This implies Bangladesh and other LDCs should consider the country specific interests of the developing countries to take proper policy stance.
CHAPTER TEN
Abu Eusuf, Mahbub Alam, Mokammel K. Toufique and Rabeya Khatoon
Market Access Problems of Bangladesh’s Export Products: A Study on Some Selected Sub-Sectors
10.1. Introduction This chapter analyses the market access problems of Bangladeshi export products with especial emphasis on some selected sub-sectors, namely the agro-processing, herbal medicine, light engineering, home textiles, jute diversified products, manpower exports and specialised crafts. It is very much evident from the analysis in chapter 3 that, if the existing trade pattern of agricultural commodities of Bangladesh continue to hold, Bangladesh is likely to suffer under different global agricultural trade liberalisation scenarios. It is, however, important to note that in the Industrial Policy 2005, agro-processing industries and the herbal medicine and medicinal plants have been considered as thrust sectors with the aim of increasing their exports and also to diversify the export basket. Nonetheless, the current export shares of these two sub-sectors in total exports are very low. A WTO agricultural reform, however, can open new opportunities. If export subsidies are abolished, the EU will
W T O A N D R E G I O N A L T R A D E N E G O T I A T I O N O U T C O M E S : Q U A N T I T A T I V E
A S S E S S M E N T S O F P O T E N T I A L I M P L I C A T I O N S O N B A N G L A D E S H
200 lose its competitive edge in various markets, and Bangladesh can explore the possibilities to take over these markets, in particular for various agro-processing products. Also, in the cases of light engineering, home textile, jute products and specialized crafts (which are also identified as thrust sectors in the Industrial Policy 2005) there may be increased opportunities for Bangladesh if she can avail full duty-free-quota-free access in the developed countries’ as well as in the advanced developing countries’ markets.
This paper explores the market access problems of seven export-oriented industries in Bangladesh. The outline of this paper is as follows: Section 10.2 analyses the prospect out time of exports from the seven specified thrust sectors in Bangladesh; Section 10.3 examines in details the major market access problems of the export products of Bangladesh in general and of the seven specified sectors in particular; and finally section 10.4 concludes.
10.2. Prospects of Exports from Seven Thrust Sectors 10.2.1. Agro-processing
With respect to the potentials of agro-processing products, agriculture of Bangladesh has not occupied an important place in the external trade yet. The contribution of agriculture to the export earnings even now is not so significant, still the potential of agro processed products is becoming visible now and there are valid reasons as to why this sub-sector should get due attention of the policy makers, trade bodies as well as producers/ exporters. Bangladesh as most of the LDC and net food importing developing countries have conflicting interests on many issues of agricultural negotiations, particularly on food security and market access perspective. The agricultural sector in Bangladesh has advanced a lot in the context of self sufficiency in food grains. Bangladesh is referred to as an agro-based country with her fertile land and favourable weather for agricultural production. Even after the major shift towards garments manufacturing industries in mid 1980s, 62.4 percent of the country’s total national employment concentrates to the agricultural and agro-processing sector alone. The sector accounts a GDP share of 21.75 percent. The agro-processing industry of the country, however, contributes to 12 percent of the agricultural value addition.
M A R K E T A C C E S S P R O B L E M S O F B A N G L A D E S H ’ S E X P O R T P R O D U C T S :
A S T U D Y O N S O M E S E L E C T E D S U B - S E C T O R S
201The contribution of agro-products in the total export earnings has
been around 10-12 percent during the recent years. It is hard to formalise a list of sub-sectors under the agro-processing industry that ranges from crop, vegetables and fruits to poultry, livestock, fisheries and forestry. A narrow down of the list can be made considering the export diversification potentials for Bangladesh that includes the goat meat, fruits and vegetables processing sectors, leather industry and frozen food industry including shrimp processing. In terms of supply of meat, milk and skin products, goat is in the second position in Bangladesh livestock sector. At present, 28 percent of meat, 23 percent of milk and 28 percent of skin are sourced from goat, especially from Black Bengal goat (comprises more than 90 percent of the total goats of Bangladesh) (UNDP, 2005). Bangladesh has an approximate 20 million Black Bengal Goat population that are of best quality among those available in Bangladesh, and West Bengal and Assam in India.
Domestic market analysis for meat reveals that there is a substantial demand for goat meat. An estimate of the Department of Livestock Services shows, for a population of 140 million, total annual demand for meat comes out to be 5.8 million metric tons, while the total availability is only 0.9 million metric tons. From 20 million goats, if we assume to have 10kg meat from each, the total annual supply of goat meat comes out to be 0.2 million metric tons, that results in a huge deficit.
There is an increasing demand for goat meat in the international market in recent years. It has been found that about 63 percent of the red meat consumption throughout the world is from goat meat. World’s top ten importers of goat meat include the USA, China, Kuwait, Hong Kong, Saudi Arabia, Canada, Italy, France, Trinidad and Tobago and Malaysia with an annual amount of imports of about 24 thousand metric tons. Major exporters in this market are Australia, China, Pakistan, France, Ethiopia, New Zealand and India. Bangladesh is the 4th largest goat meat producer.
Besides goat meat, goat leather is manufactured into a wide range of end usages. Italy is the prominent importer of goat skin in terms of annual imports value, and Spain, India, Turkey, China and France together account for 45 percent of the world total imports value in 2001. Goat skin output grew at an annual rate of 4 percent in the developing countries including Bangladesh. As figure 10.1 shows, after a significant drop in 1998, goat skin production of Bangladesh grew at an annual rate
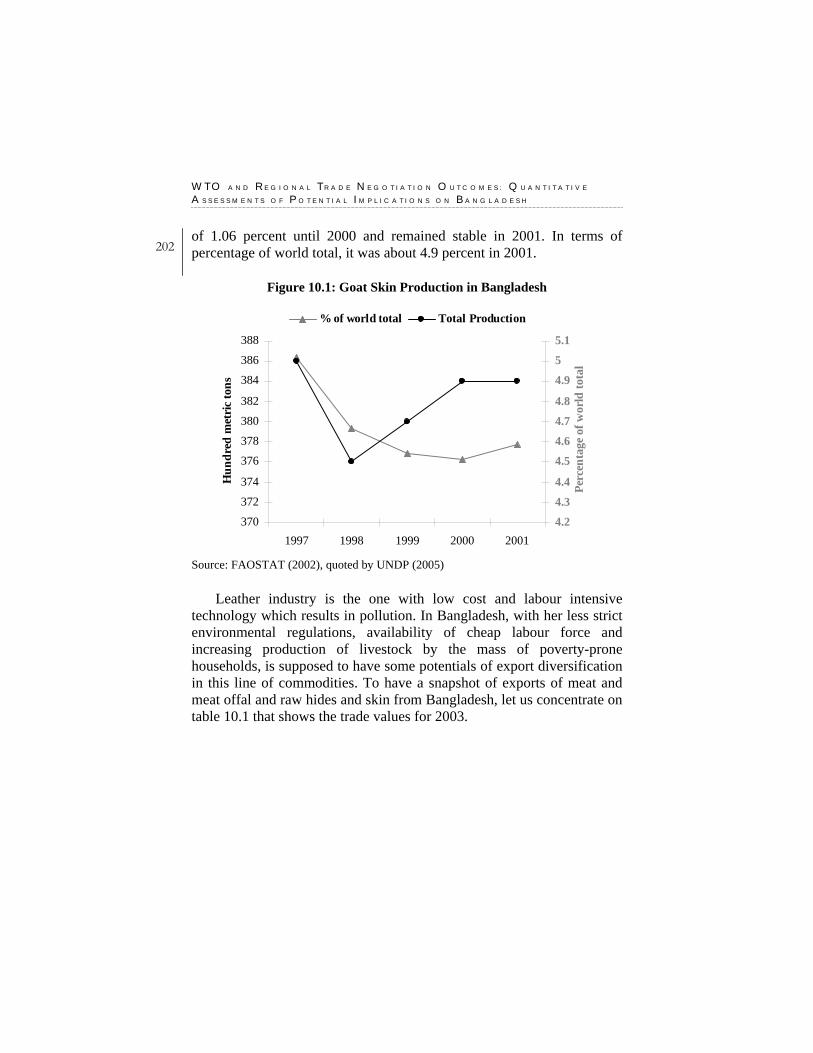
W T O A N D R E G I O N A L T R A D E N E G O T I A T I O N O U T C O M E S : Q U A N T I T A T I V E
A S S E S S M E N T S O F P O T E N T I A L I M P L I C A T I O N S O N B A N G L A D E S H
202 of 1.06 percent until 2000 and remained stable in 2001. In terms of percentage of world total, it was about 4.9 percent in 2001.
Figure 10.1: Goat Skin Production in Bangladesh
370
372
374
376
378
380
382
384
386
388
1997 1998 1999 2000 2001
Hun
dred
met
ric
tons
4.2
4.3
4.4
4.5
4.6
4.7
4.8
4.9
5
5.1
Perc
enta
ge o
f wor
ld to
tal
% of world total Total Production
Source: FAOSTAT (2002), quoted by UNDP (2005)
Leather industry is the one with low cost and labour intensive technology which results in pollution. In Bangladesh, with her less strict environmental regulations, availability of cheap labour force and increasing production of livestock by the mass of poverty-prone households, is supposed to have some potentials of export diversification in this line of commodities. To have a snapshot of exports of meat and meat offal and raw hides and skin from Bangladesh, let us concentrate on table 10.1 that shows the trade values for 2003.
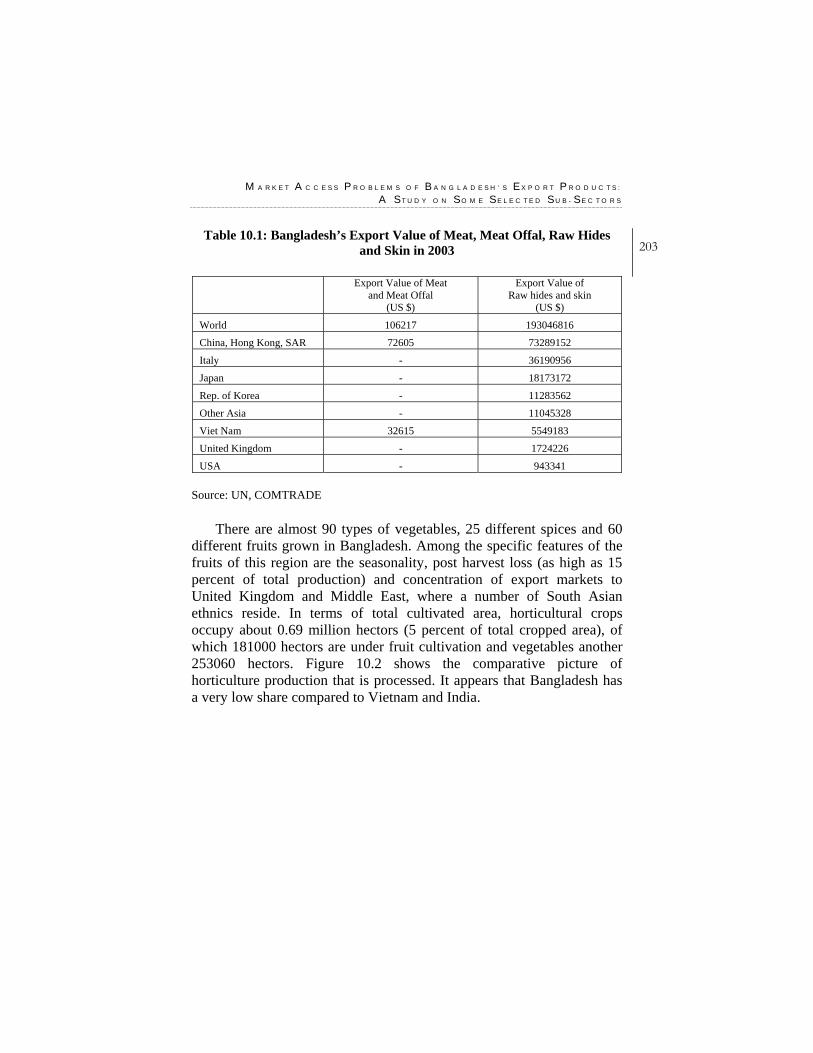
M A R K E T A C C E S S P R O B L E M S O F B A N G L A D E S H ’ S E X P O R T P R O D U C T S :
A S T U D Y O N S O M E S E L E C T E D S U B - S E C T O R S
203Table 10.1: Bangladesh’s Export Value of Meat, Meat Offal, Raw Hides
and Skin in 2003
Export Value of Meat and Meat Offal
(US $)
Export Value of Raw hides and skin
(US $)
World 106217 193046816
China, Hong Kong, SAR 72605 73289152
Italy - 36190956
Japan - 18173172
Rep. of Korea - 11283562
Other Asia - 11045328
Viet Nam 32615 5549183
United Kingdom - 1724226
USA - 943341 Source: UN, COMTRADE
There are almost 90 types of vegetables, 25 different spices and 60
different fruits grown in Bangladesh. Among the specific features of the fruits of this region are the seasonality, post harvest loss (as high as 15 percent of total production) and concentration of export markets to United Kingdom and Middle East, where a number of South Asian ethnics reside. In terms of total cultivated area, horticultural crops occupy about 0.69 million hectors (5 percent of total cropped area), of which 181000 hectors are under fruit cultivation and vegetables another 253060 hectors. Figure 10.2 shows the comparative picture of horticulture production that is processed. It appears that Bangladesh has a very low share compared to Vietnam and India.
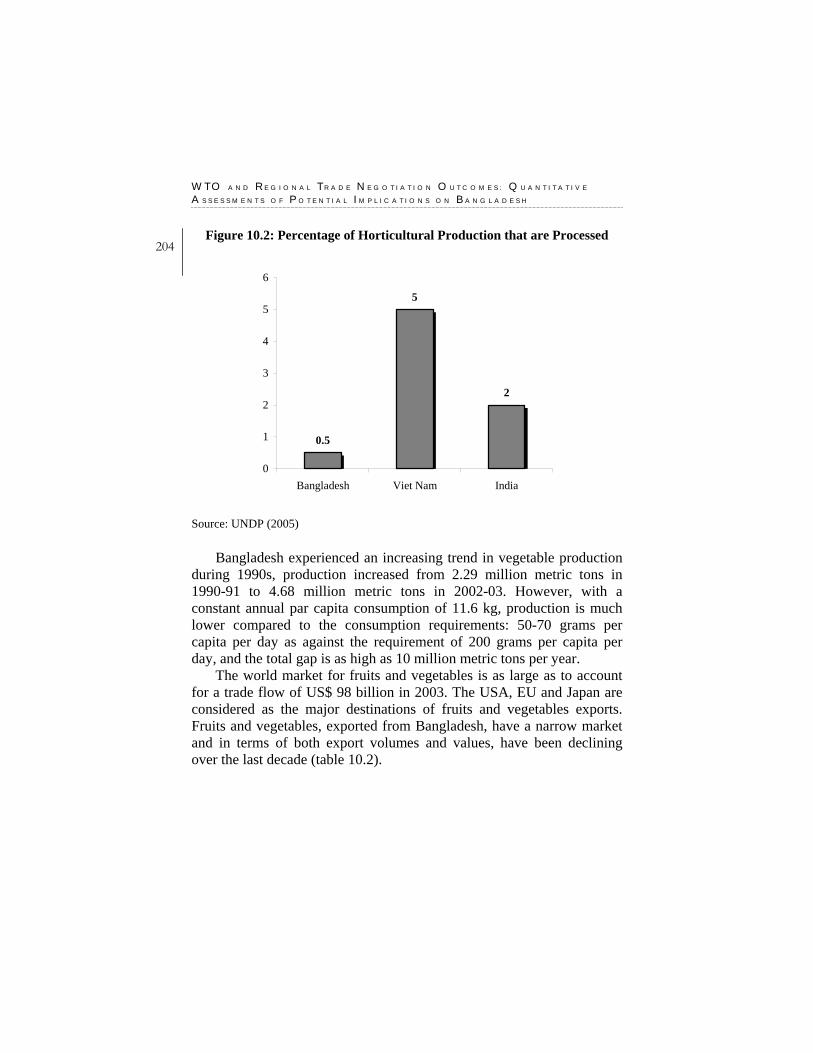
W T O A N D R E G I O N A L T R A D E N E G O T I A T I O N O U T C O M E S : Q U A N T I T A T I V E
A S S E S S M E N T S O F P O T E N T I A L I M P L I C A T I O N S O N B A N G L A D E S H
204 Figure 10.2: Percentage of Horticultural Production that are Processed
0.5
5
2
0
1
2
3
4
5
6
Bangladesh Viet Nam India
Source: UNDP (2005)
Bangladesh experienced an increasing trend in vegetable production during 1990s, production increased from 2.29 million metric tons in 1990-91 to 4.68 million metric tons in 2002-03. However, with a constant annual par capita consumption of 11.6 kg, production is much lower compared to the consumption requirements: 50-70 grams per capita per day as against the requirement of 200 grams per capita per day, and the total gap is as high as 10 million metric tons per year.
The world market for fruits and vegetables is as large as to account for a trade flow of US$ 98 billion in 2003. The USA, EU and Japan are considered as the major destinations of fruits and vegetables exports. Fruits and vegetables, exported from Bangladesh, have a narrow market and in terms of both export volumes and values, have been declining over the last decade (table 10.2).
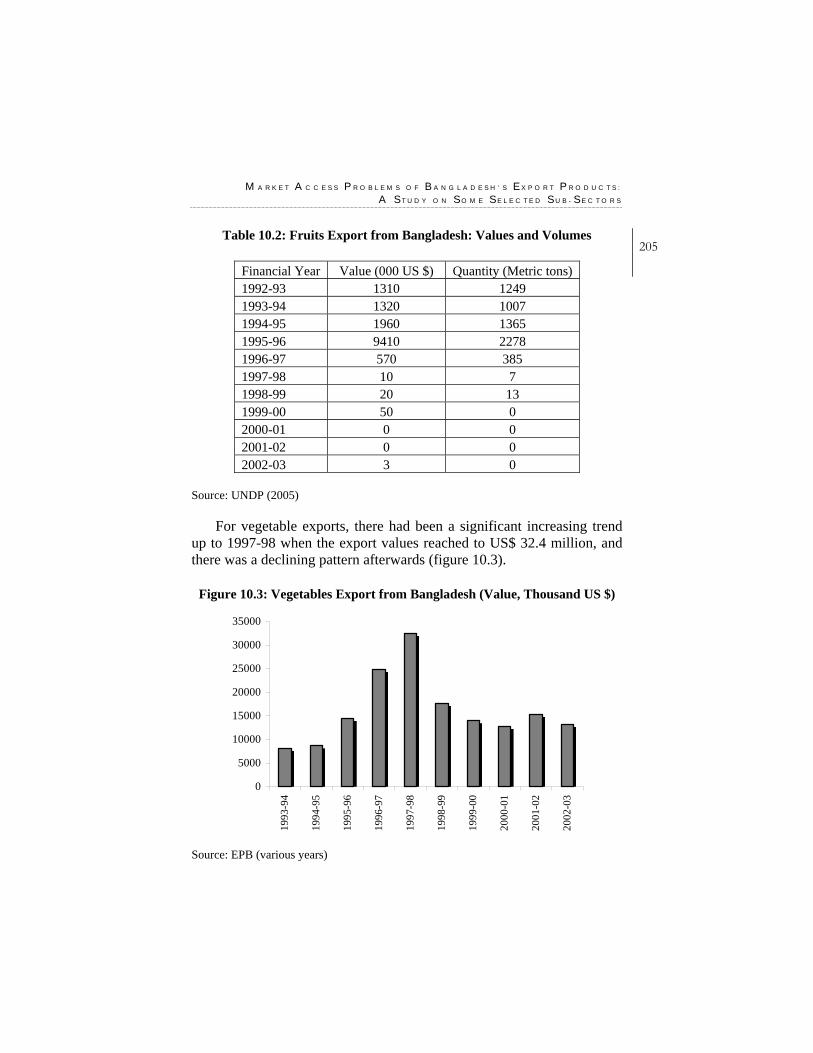
M A R K E T A C C E S S P R O B L E M S O F B A N G L A D E S H ’ S E X P O R T P R O D U C T S :
A S T U D Y O N S O M E S E L E C T E D S U B - S E C T O R S
205Table 10.2: Fruits Export from Bangladesh: Values and Volumes
Financial Year Value (000 US $) Quantity (Metric tons) 1992-93 1310 1249 1993-94 1320 1007 1994-95 1960 1365 1995-96 9410 2278 1996-97 570 385 1997-98 10 7 1998-99 20 13 1999-00 50 0 2000-01 0 0 2001-02 0 0 2002-03 3 0
Source: UNDP (2005)
For vegetable exports, there had been a significant increasing trend up to 1997-98 when the export values reached to US$ 32.4 million, and there was a declining pattern afterwards (figure 10.3).
Figure 10.3: Vegetables Export from Bangladesh (Value, Thousand US $)
0
5000
10000
15000
20000
25000
30000
35000
1993
-94
1994
-95
1995
-96
1996
-97
1997
-98
1998
-99
1999
-00
2000
-01
2001
-02
2002
-03
Source: EPB (various years)
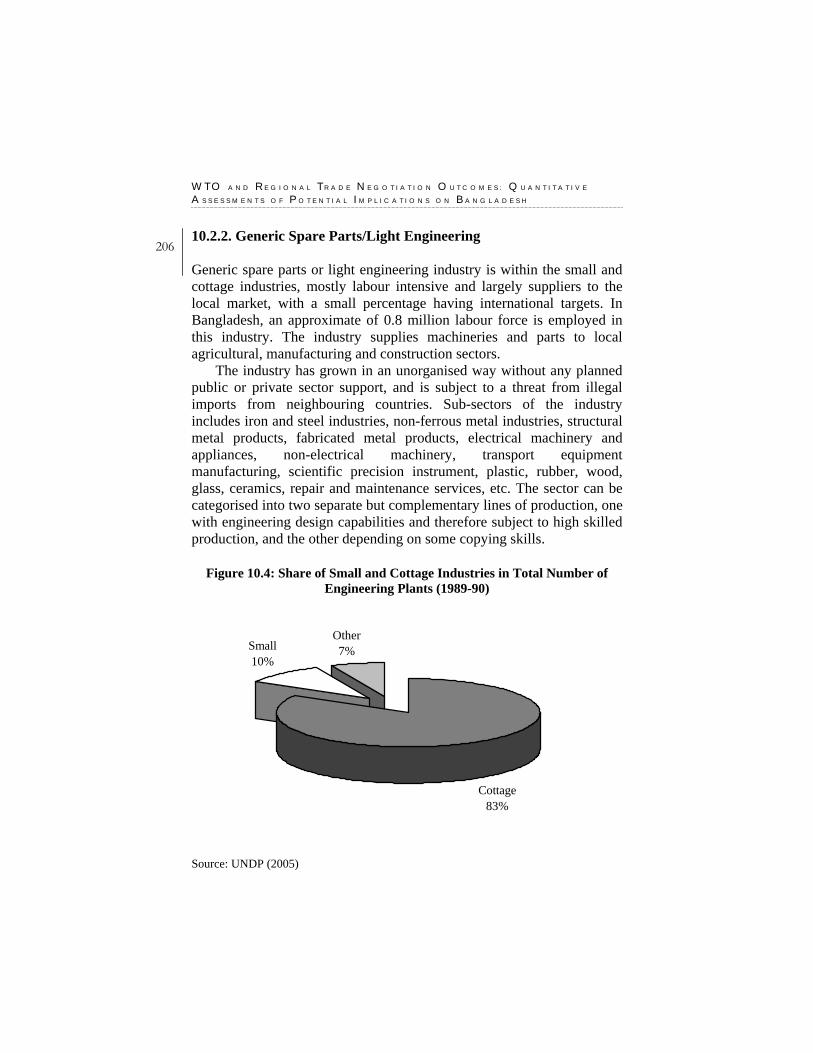
W T O A N D R E G I O N A L T R A D E N E G O T I A T I O N O U T C O M E S : Q U A N T I T A T I V E
A S S E S S M E N T S O F P O T E N T I A L I M P L I C A T I O N S O N B A N G L A D E S H
206 10.2.2. Generic Spare Parts/Light Engineering
Generic spare parts or light engineering industry is within the small and cottage industries, mostly labour intensive and largely suppliers to the local market, with a small percentage having international targets. In Bangladesh, an approximate of 0.8 million labour force is employed in this industry. The industry supplies machineries and parts to local agricultural, manufacturing and construction sectors.
The industry has grown in an unorganised way without any planned public or private sector support, and is subject to a threat from illegal imports from neighbouring countries. Sub-sectors of the industry includes iron and steel industries, non-ferrous metal industries, structural metal products, fabricated metal products, electrical machinery and appliances, non-electrical machinery, transport equipment manufacturing, scientific precision instrument, plastic, rubber, wood, glass, ceramics, repair and maintenance services, etc. The sector can be categorised into two separate but complementary lines of production, one with engineering design capabilities and therefore subject to high skilled production, and the other depending on some copying skills.
Figure 10.4: Share of Small and Cottage Industries in Total Number of Engineering Plants (1989-90)
Cottage83%
Small10%
Other7%
Source: UNDP (2005)
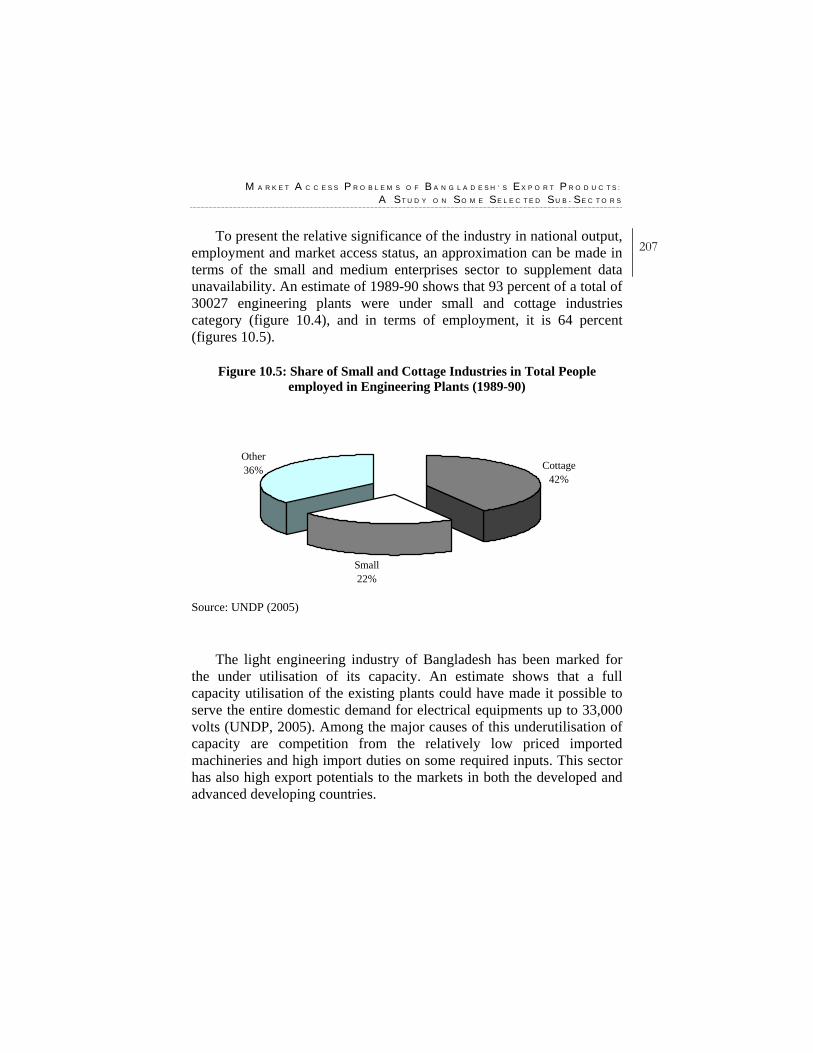
M A R K E T A C C E S S P R O B L E M S O F B A N G L A D E S H ’ S E X P O R T P R O D U C T S :
A S T U D Y O N S O M E S E L E C T E D S U B - S E C T O R S
207To present the relative significance of the industry in national output,
employment and market access status, an approximation can be made in terms of the small and medium enterprises sector to supplement data unavailability. An estimate of 1989-90 shows that 93 percent of a total of 30027 engineering plants were under small and cottage industries category (figure 10.4), and in terms of employment, it is 64 percent (figures 10.5).
Figure 10.5: Share of Small and Cottage Industries in Total People
employed in Engineering Plants (1989-90)
Cottage42%
Small22%
Other36%
Source: UNDP (2005)
The light engineering industry of Bangladesh has been marked for the under utilisation of its capacity. An estimate shows that a full capacity utilisation of the existing plants could have made it possible to serve the entire domestic demand for electrical equipments up to 33,000 volts (UNDP, 2005). Among the major causes of this underutilisation of capacity are competition from the relatively low priced imported machineries and high import duties on some required inputs. This sector has also high export potentials to the markets in both the developed and advanced developing countries.
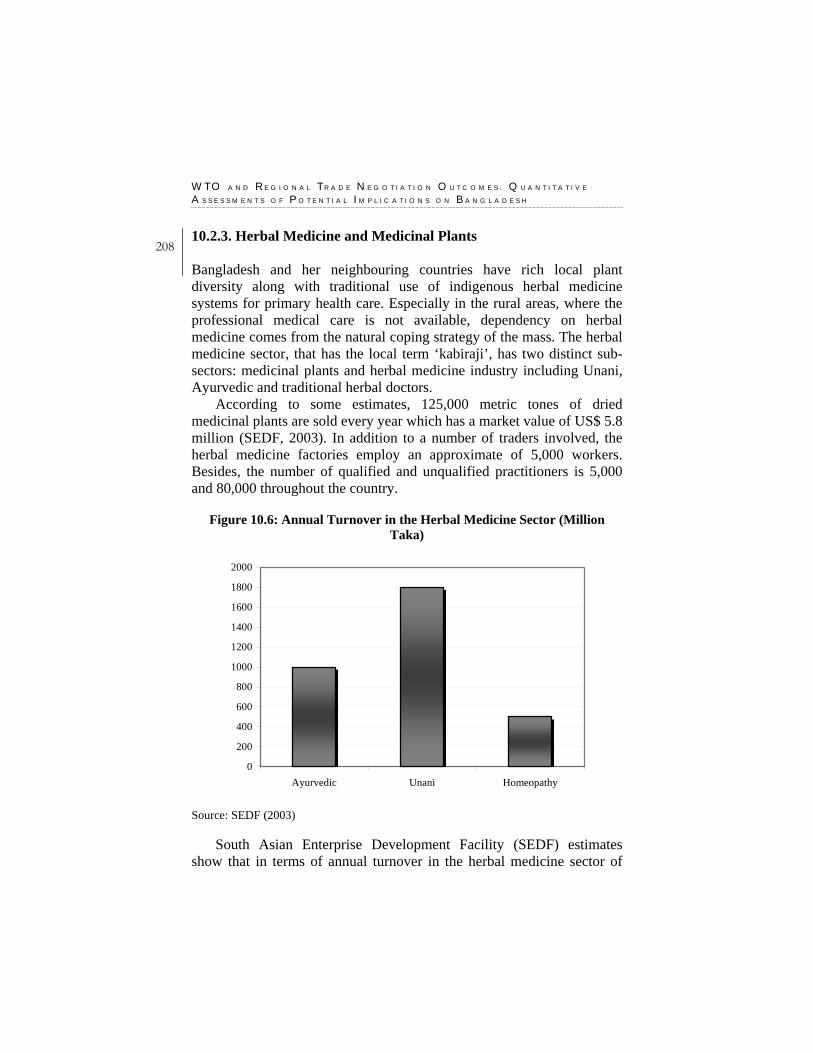
W T O A N D R E G I O N A L T R A D E N E G O T I A T I O N O U T C O M E S : Q U A N T I T A T I V E
A S S E S S M E N T S O F P O T E N T I A L I M P L I C A T I O N S O N B A N G L A D E S H
208 10.2.3. Herbal Medicine and Medicinal Plants Bangladesh and her neighbouring countries have rich local plant diversity along with traditional use of indigenous herbal medicine systems for primary health care. Especially in the rural areas, where the professional medical care is not available, dependency on herbal medicine comes from the natural coping strategy of the mass. The herbal medicine sector, that has the local term ‘kabiraji’, has two distinct sub-sectors: medicinal plants and herbal medicine industry including Unani, Ayurvedic and traditional herbal doctors.
According to some estimates, 125,000 metric tones of dried medicinal plants are sold every year which has a market value of US$ 5.8 million (SEDF, 2003). In addition to a number of traders involved, the herbal medicine factories employ an approximate of 5,000 workers. Besides, the number of qualified and unqualified practitioners is 5,000 and 80,000 throughout the country.
Figure 10.6: Annual Turnover in the Herbal Medicine Sector (Million
Taka)
0
200
400
600
800
1000
1200
1400
1600
1800
2000
Ayurvedic Unani Homeopathy
Source: SEDF (2003)
South Asian Enterprise Development Facility (SEDF) estimates show that in terms of annual turnover in the herbal medicine sector of
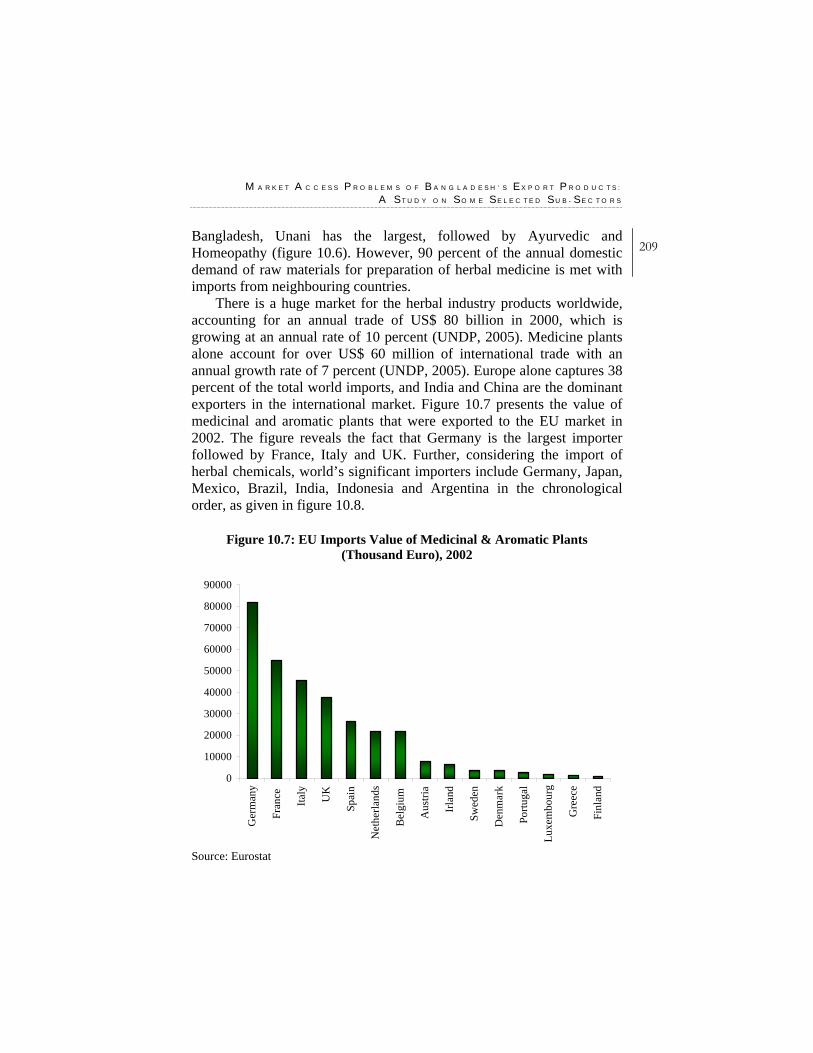
M A R K E T A C C E S S P R O B L E M S O F B A N G L A D E S H ’ S E X P O R T P R O D U C T S :
A S T U D Y O N S O M E S E L E C T E D S U B - S E C T O R S
209Bangladesh, Unani has the largest, followed by Ayurvedic and Homeopathy (figure 10.6). However, 90 percent of the annual domestic demand of raw materials for preparation of herbal medicine is met with imports from neighbouring countries.
There is a huge market for the herbal industry products worldwide, accounting for an annual trade of US$ 80 billion in 2000, which is growing at an annual rate of 10 percent (UNDP, 2005). Medicine plants alone account for over US$ 60 million of international trade with an annual growth rate of 7 percent (UNDP, 2005). Europe alone captures 38 percent of the total world imports, and India and China are the dominant exporters in the international market. Figure 10.7 presents the value of medicinal and aromatic plants that were exported to the EU market in 2002. The figure reveals the fact that Germany is the largest importer followed by France, Italy and UK. Further, considering the import of herbal chemicals, world’s significant importers include Germany, Japan, Mexico, Brazil, India, Indonesia and Argentina in the chronological order, as given in figure 10.8.
Figure 10.7: EU Imports Value of Medicinal & Aromatic Plants
(Thousand Euro), 2002
0
10000
20000
30000
40000
50000
60000
70000
80000
90000
Ger
man
y
Fran
ce
Italy
UK
Spai
n
Net
herla
nds
Bel
gium
Aus
tria
Irla
nd
Swed
en
Den
mar
k
Portu
gal
Luxe
mbo
urg
Gre
ece
Finl
and
Source: Eurostat

W T O A N D R E G I O N A L T R A D E N E G O T I A T I O N O U T C O M E S : Q U A N T I T A T I V E
A S S E S S M E N T S O F P O T E N T I A L I M P L I C A T I O N S O N B A N G L A D E S H
210 Figure 10.8: Import Value of Herbal Chemicals by the Major Importers of
the World (Billion US $), 2003
02468
10121416
Ger
man
y
Japa
n
Mex
ico
Bra
zil
Indi
a
Indo
nesi
a
Arg
entin
a
Source: UN, COMTRADE
Bangladesh has an approximate 650 species that are used in the
herbal medicine industry. Among those 48 categories are certified by the Export Promotion Bureau for exports. 90 percent of Bangladesh’s herbal medicine exports are from wild harvest and the major production areas are Mymensingh, Modhupur, Kustia, Chittagong hill tracts, Sylhet and Tangail. In 2003, total exports of pharmaceuticals from Bangladesh amounted US$ 6.3 million. However, the export earnings from organic chemical exports for the same year was US $1.6 million with significant destinations being the USA, South Africa, Pakistan, Ukraine, Jordan and Indonesia (table 10.3).
It is important to note that the WTO Doha agreements relating TRIPS allow exemption for LDCs from patent development and royalty payment for pharmaceutical until 2016. If Bangladesh can exploit such an opportunity, she can significantly increase the exports of her pharmaceutical products.
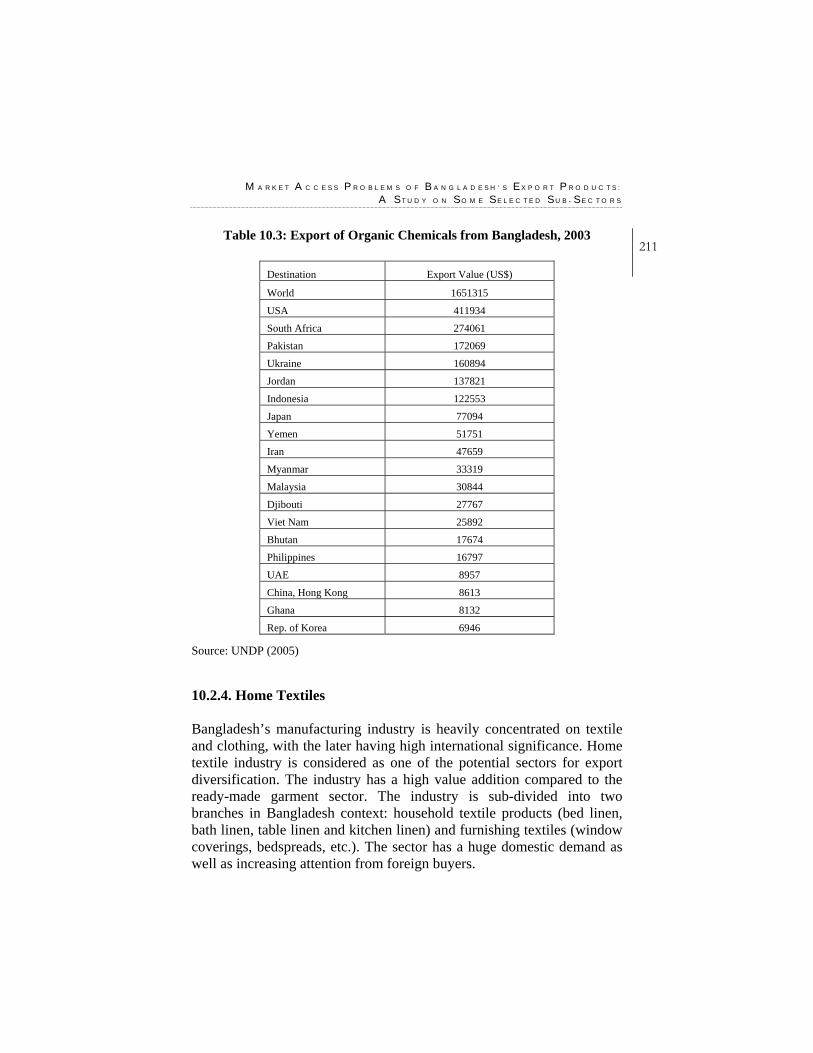
M A R K E T A C C E S S P R O B L E M S O F B A N G L A D E S H ’ S E X P O R T P R O D U C T S :
A S T U D Y O N S O M E S E L E C T E D S U B - S E C T O R S
211Table 10.3: Export of Organic Chemicals from Bangladesh, 2003
Destination Export Value (US$)
World 1651315
USA 411934
South Africa 274061
Pakistan 172069
Ukraine 160894
Jordan 137821
Indonesia 122553
Japan 77094
Yemen 51751
Iran 47659
Myanmar 33319
Malaysia 30844
Djibouti 27767
Viet Nam 25892
Bhutan 17674
Philippines 16797
UAE 8957
China, Hong Kong 8613
Ghana 8132
Rep. of Korea 6946 Source: UNDP (2005)
10.2.4. Home Textiles Bangladesh’s manufacturing industry is heavily concentrated on textile and clothing, with the later having high international significance. Home textile industry is considered as one of the potential sectors for export diversification. The industry has a high value addition compared to the ready-made garment sector. The industry is sub-divided into two branches in Bangladesh context: household textile products (bed linen, bath linen, table linen and kitchen linen) and furnishing textiles (window coverings, bedspreads, etc.). The sector has a huge domestic demand as well as increasing attention from foreign buyers.
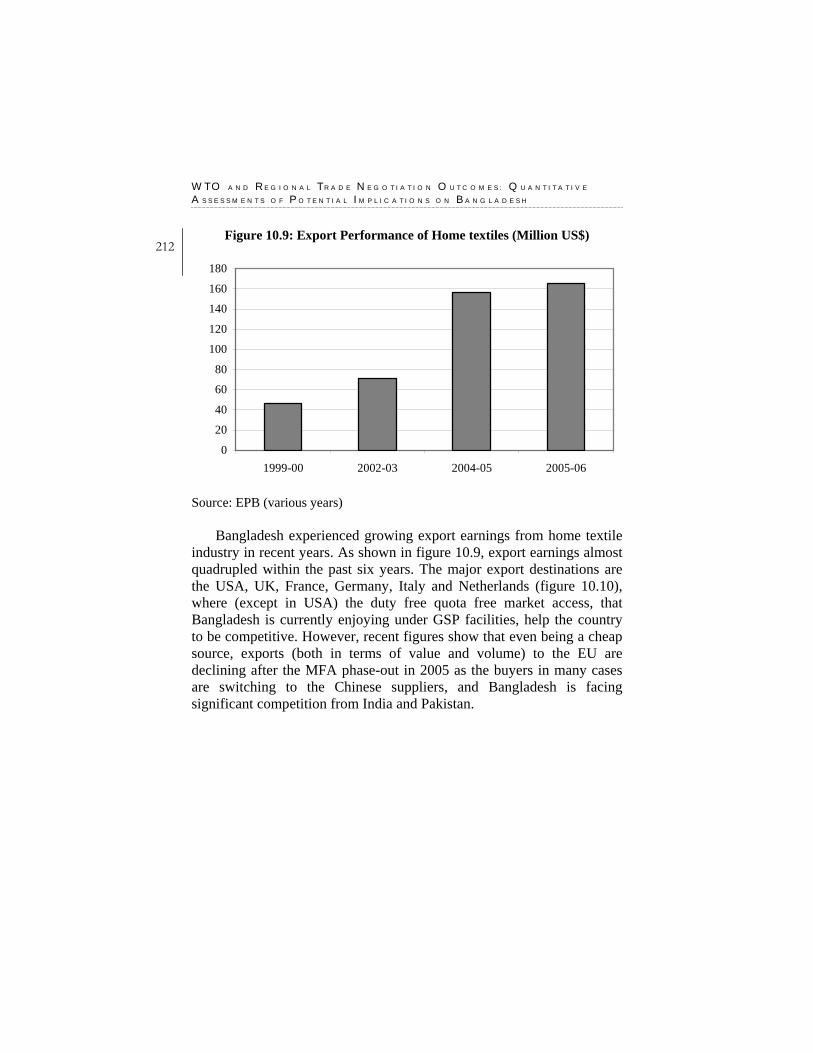
W T O A N D R E G I O N A L T R A D E N E G O T I A T I O N O U T C O M E S : Q U A N T I T A T I V E
A S S E S S M E N T S O F P O T E N T I A L I M P L I C A T I O N S O N B A N G L A D E S H
212 Figure 10.9: Export Performance of Home textiles (Million US$)
0
20
40
60
80
100
120
140
160
180
1999-00 2002-03 2004-05 2005-06
Source: EPB (various years)
Bangladesh experienced growing export earnings from home textile industry in recent years. As shown in figure 10.9, export earnings almost quadrupled within the past six years. The major export destinations are the USA, UK, France, Germany, Italy and Netherlands (figure 10.10), where (except in USA) the duty free quota free market access, that Bangladesh is currently enjoying under GSP facilities, help the country to be competitive. However, recent figures show that even being a cheap source, exports (both in terms of value and volume) to the EU are declining after the MFA phase-out in 2005 as the buyers in many cases are switching to the Chinese suppliers, and Bangladesh is facing significant competition from India and Pakistan.
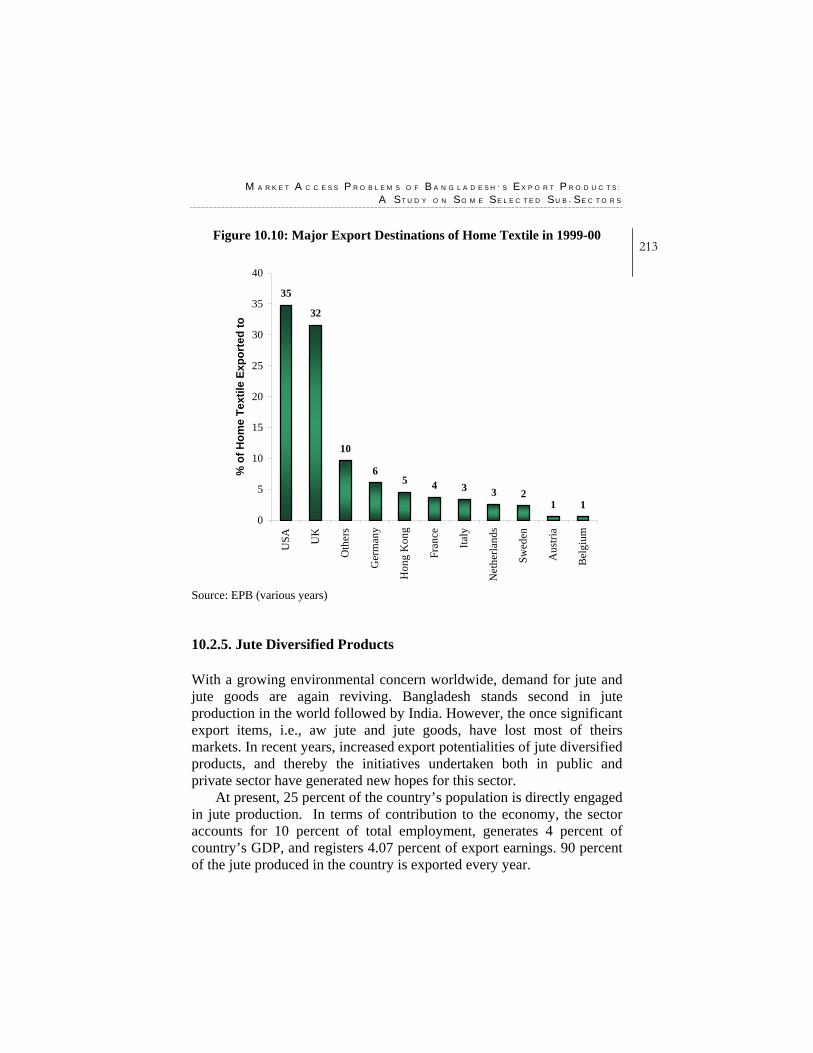
M A R K E T A C C E S S P R O B L E M S O F B A N G L A D E S H ’ S E X P O R T P R O D U C T S :
A S T U D Y O N S O M E S E L E C T E D S U B - S E C T O R S
213Figure 10.10: Major Export Destinations of Home Textile in 1999-00
35
32
10
65 4 3 3 2
1 10
5
10
15
20
25
30
35
40U
SA UK
Oth
ers
Ger
man
y
Hon
g K
ong
Fran
ce
Italy
Net
herla
nds
Swed
en
Aus
tria
Bel
gium
% o
f Hom
e Te
xtile
Exp
orte
d to
Source: EPB (various years)
10.2.5. Jute Diversified Products With a growing environmental concern worldwide, demand for jute and jute goods are again reviving. Bangladesh stands second in jute production in the world followed by India. However, the once significant export items, i.e., aw jute and jute goods, have lost most of theirs markets. In recent years, increased export potentialities of jute diversified products, and thereby the initiatives undertaken both in public and private sector have generated new hopes for this sector.
At present, 25 percent of the country’s population is directly engaged in jute production. In terms of contribution to the economy, the sector accounts for 10 percent of total employment, generates 4 percent of country’s GDP, and registers 4.07 percent of export earnings. 90 percent of the jute produced in the country is exported every year.
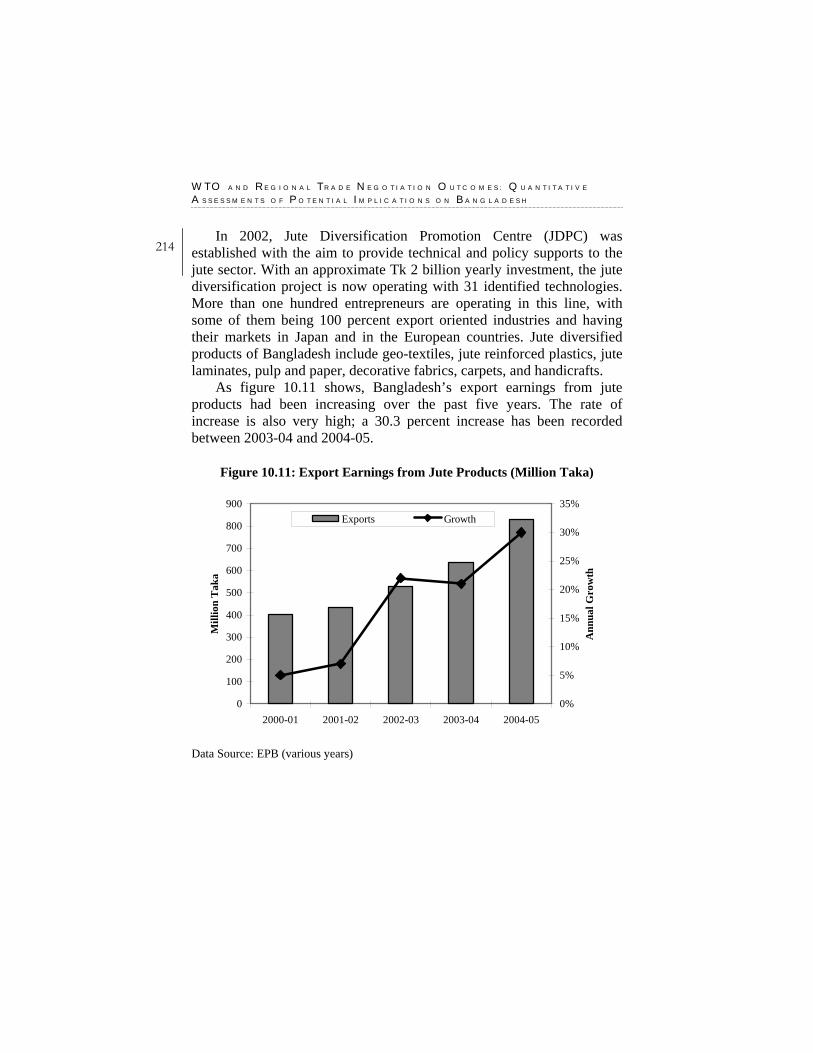
W T O A N D R E G I O N A L T R A D E N E G O T I A T I O N O U T C O M E S : Q U A N T I T A T I V E
A S S E S S M E N T S O F P O T E N T I A L I M P L I C A T I O N S O N B A N G L A D E S H
214 In 2002, Jute Diversification Promotion Centre (JDPC) was
established with the aim to provide technical and policy supports to the jute sector. With an approximate Tk 2 billion yearly investment, the jute diversification project is now operating with 31 identified technologies. More than one hundred entrepreneurs are operating in this line, with some of them being 100 percent export oriented industries and having their markets in Japan and in the European countries. Jute diversified products of Bangladesh include geo-textiles, jute reinforced plastics, jute laminates, pulp and paper, decorative fabrics, carpets, and handicrafts.
As figure 10.11 shows, Bangladesh’s export earnings from jute products had been increasing over the past five years. The rate of increase is also very high; a 30.3 percent increase has been recorded between 2003-04 and 2004-05.
Figure 10.11: Export Earnings from Jute Products (Million Taka)
0
100
200
300
400
500
600
700
800
900
2000-01 2001-02 2002-03 2003-04 2004-05
Mill
ion
Tak
a
0%
5%
10%
15%
20%
25%
30%
35%
Ann
ual G
row
th
Exports Growth
Data Source: EPB (various years)
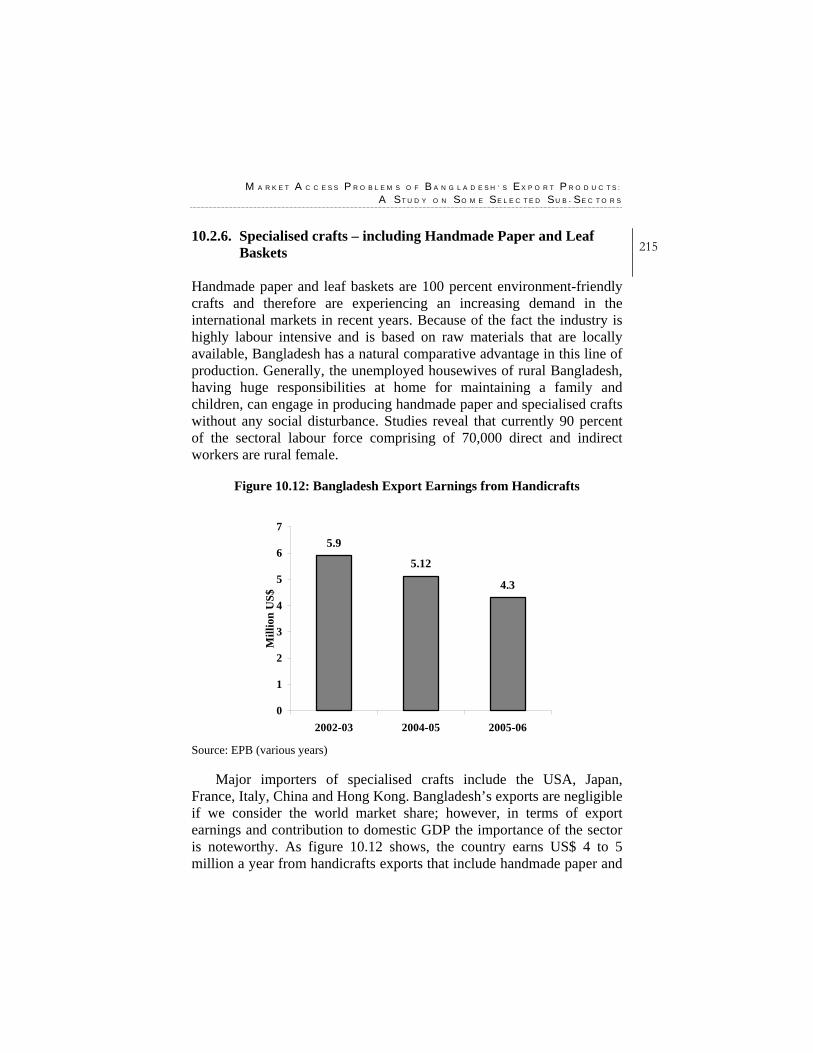
M A R K E T A C C E S S P R O B L E M S O F B A N G L A D E S H ’ S E X P O R T P R O D U C T S :
A S T U D Y O N S O M E S E L E C T E D S U B - S E C T O R S
21510.2.6. Specialised crafts – including Handmade Paper and Leaf
Baskets Handmade paper and leaf baskets are 100 percent environment-friendly crafts and therefore are experiencing an increasing demand in the international markets in recent years. Because of the fact the industry is highly labour intensive and is based on raw materials that are locally available, Bangladesh has a natural comparative advantage in this line of production. Generally, the unemployed housewives of rural Bangladesh, having huge responsibilities at home for maintaining a family and children, can engage in producing handmade paper and specialised crafts without any social disturbance. Studies reveal that currently 90 percent of the sectoral labour force comprising of 70,000 direct and indirect workers are rural female.
Figure 10.12: Bangladesh Export Earnings from Handicrafts
5.9
5.12
4.3
0
1
2
3
4
5
6
7
2002-03 2004-05 2005-06
Mill
ion
US$
Source: EPB (various years)
Major importers of specialised crafts include the USA, Japan, France, Italy, China and Hong Kong. Bangladesh’s exports are negligible if we consider the world market share; however, in terms of export earnings and contribution to domestic GDP the importance of the sector is noteworthy. As figure 10.12 shows, the country earns US$ 4 to 5 million a year from handicrafts exports that include handmade paper and
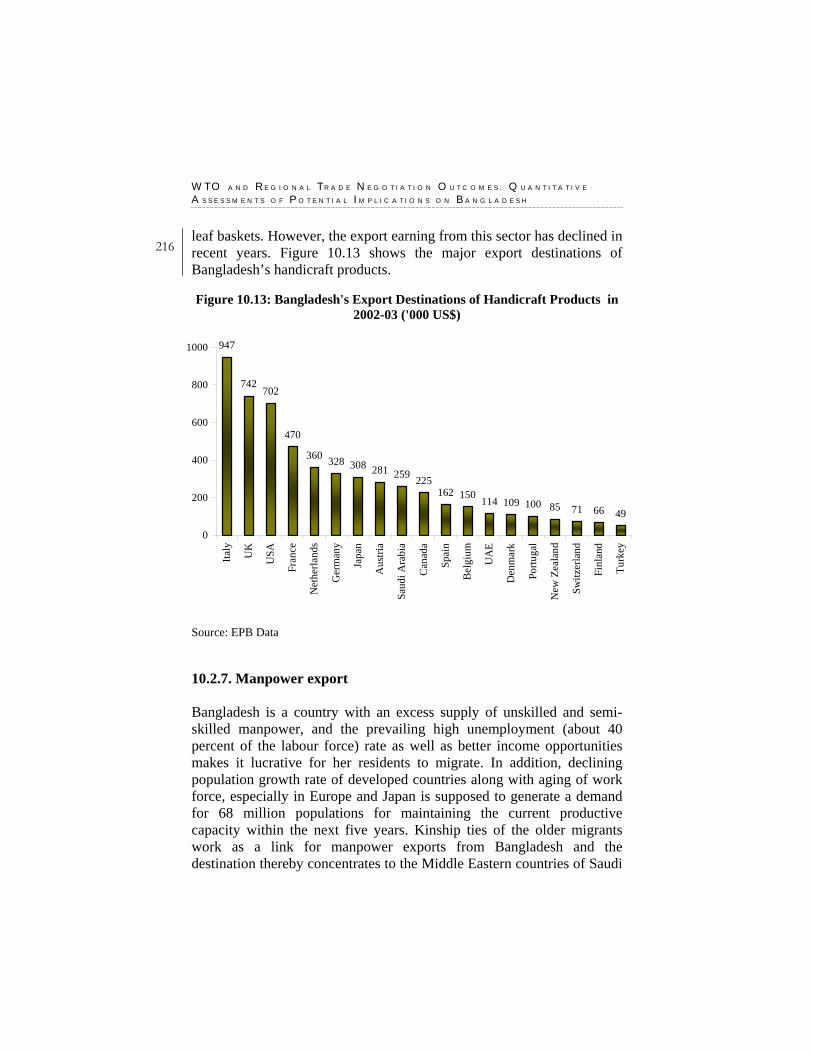
W T O A N D R E G I O N A L T R A D E N E G O T I A T I O N O U T C O M E S : Q U A N T I T A T I V E
A S S E S S M E N T S O F P O T E N T I A L I M P L I C A T I O N S O N B A N G L A D E S H
216 leaf baskets. However, the export earning from this sector has declined in recent years. Figure 10.13 shows the major export destinations of Bangladesh’s handicraft products. Figure 10.13: Bangladesh's Export Destinations of Handicraft Products in
2002-03 ('000 US$)
947
742702
470
360 328 308 281 259 225162 150 114 109 100 85 71 66 49
0
200
400
600
800
1000
Italy
UK
USA
Fran
ce
Net
herla
nds
Ger
man
y
Japa
n
Aus
tria
Saud
i Ara
bia
Can
ada
Spai
n
Bel
gium
UA
E
Den
mar
k
Portu
gal
New
Zea
land
Switz
erla
nd
Finl
and
Turk
ey
Source: EPB Data
10.2.7. Manpower export Bangladesh is a country with an excess supply of unskilled and semi-skilled manpower, and the prevailing high unemployment (about 40 percent of the labour force) rate as well as better income opportunities makes it lucrative for her residents to migrate. In addition, declining population growth rate of developed countries along with aging of work force, especially in Europe and Japan is supposed to generate a demand for 68 million populations for maintaining the current productive capacity within the next five years. Kinship ties of the older migrants work as a link for manpower exports from Bangladesh and the destination thereby concentrates to the Middle Eastern countries of Saudi
M A R K E T A C C E S S P R O B L E M S O F B A N G L A D E S H ’ S E X P O R T P R O D U C T S :
A S T U D Y O N S O M E S E L E C T E D S U B - S E C T O R S
217Arabia, UAE and Kuwait, and recently to some Asian countries like Malaysia and Singapore. The number of migrant workers from Bangladesh was 6,087 in 1976, that has increased to 2,72,958 people in 2004. The importance of remittances to Bangladesh’s GDP is quite high, 6.1 percent, and the figure works for maintaining external balance of the country. In terms of professional category, as high as 48 percent of the migrants are unskilled workers, 16 percent semi-skilled, 32 percent skilled and only 4 percent professionals (figure-5.14). Majority of the migrants went through individual arrangements (58 percent), followed by the recruiting agencies (40 percent), and only a very small percentage went under government organizations like, Bureau of Manpower Employment and Training (1.07 percent) and Bangladesh Overseas Employment Services Limited (0.26 percent). 10.3. Market Access Problems of Bangladesh’s Export Products There are several market access problems that may have contributed to constraining export response from Bangladesh. These problems are essentially arising from the consumers and policy environment in foreign markets, where Bangladeshi products are exported. Factors that are considered to affect demand for Bangladesh’s exports in international markets include, (1) standards and quality of products, (2) income and economic activities in countries of important export interest to Bangladesh, (3) advent of substitutes in international markets, (4) trade policies of the significant importing countries, (5) various campaign by pressure groups, and (6) various restrictions against the movement of natural persons from Bangladesh and other developing countries to the developed countries. 10.3.1. Standards and Quality of Products Standards and quality of products, and services have become important factors particularly in the western developed countries. The issue of quality may be considered as a demand side problem as well as a supply side factor. On the demand side, better quality of a product may influence the demand for it positively. In contrast, supply side constraints
W T O A N D R E G I O N A L T R A D E N E G O T I A T I O N O U T C O M E S : Q U A N T I T A T I V E
A S S E S S M E N T S O F P O T E N T I A L I M P L I C A T I O N S O N B A N G L A D E S H
218 will imply inability on the part of the producers in ensuring standard and quality of the good. In many cases, suppliers need to demonstrate their capability in maintaining proper quality control for their products and services. Quality control, assurance and management systems, accreditation and certification, quality marks and labels, standardization, etc. are often considered as technical barriers to trade, especially with regard to international competitiveness and globalisation, nevertheless they have emerged as important factors in global marketing of goods. Certain standards in the production of goods and services have been developed and are widely used to assure consumers of the quality of the products that they are purchasing.19
In the guise of trade policy (e.g., the use of sanitary and phyto-sanitary measures), developed countries may also try to impose unreasonably high standards on imports of many items knowing the lack of capacity of suppliers from poor developing countries to comply with those requirements and thereby providing protection to their own industries. However, keeping aside such protectionist intent, there is no denying that there is a room for much improvement in the quality of products supplied by Bangladesh.
In general, Bangladesh has failed to ensure the quality of products and services to consumers not only in the domestic market but also in international markets. There is no national quality policy and adequate support systems providing assistance to all enterprises to understand the principles of quality and to develop quality consciousness in business behaviour. Currently, the Bangladesh Standards and Testing Institution (BSTI) devises national standards of industrial, food, and chemical
19 For example, the International Organization for Standardization has introduced a set
of standards, the ISO 9000 series, which specify requirements of quality of management systems. The ISO 9000 is concerned with quality management verifying whether the organisation enhances customer satisfaction by complying with the applicable regulatory requirements and whether it aims at continuously improving its performance in this regard. There is also ISO 14000, which deals with the environment management system. This means what the organization does to minimize harmful effects on the environment caused by its activities, and to continually improve its environmental performance. There are other standards that deal with working conditions of labour force. For example, the SA-8000 (Social Accountability) standard, which is related to welfare of the workers as the responsibility of the entrepreneurs.
M A R K E T A C C E S S P R O B L E M S O F B A N G L A D E S H ’ S E X P O R T P R O D U C T S :
A S T U D Y O N S O M E S E L E C T E D S U B - S E C T O R S
219products.20 But the BSTI lacks adequate infrastructure and technical facilities and there are also problems related to enforcement and implementation.21 However, the most important problem is that BSTI lacks credibility and importers from North America and Europe do not accept certificates issued by it (Feria et al. 2003, and Haque, 2003). Because of a lack of credibility of national policy and enforcement mechanism, there is a need for industry specific initiatives to set up their own standards as per international requirements, and own testing and compliance procedures.
It is important to note that the reductions in tariff barriers through WTO negotiations or initiatives like providing DFQF market access to LDCs have been accompanied by increasingly complex non-tariff based access rules. In the case of agriculture, increasingly stringent rules of origin (especially in the EU market) and severe SPS requirements (in most of the developed countries) are threatening to diminish the benefits of trade liberalisation and in some cases even to worsen the situation for the developing countries.
Among the WTO agreements, SPS is the most important and relevant for agriculture. High food safety standards by themselves are not necessarily a burden for LDCs exports. These can also be an opportunity to induce a modernisation of the supply chain in the countries, increasing the value of the exports and also food safety in the country itself. However, exporters to the EU are experiencing a constant rise of barriers, due to SPS regulations, to levels that are at times widely viewed as protectionist non-tariff barriers rather than genuine and scientifically based safety needs.
An indication of the rising SPS requirements is the increase in the number of rejections of imported goods to the EU from 230 cases in 1998 to 1520 cases in 2003. This is due to the increase in the number and tightening of standards. The rejections concentrated especially on fish and crustaceans, meat, fruits and vegetables.
A new problem faced by Bangladesh, and which could cause again severe disruptions in agricultural trade, is the newly introduced food 20 BSTI has developed about 1800 standards on various products of which about 150
products have been brought under compulsory certification procedures (Haque, 2003).
21 It has also been pointed out that the BSTI facilities are available in divisional towns only and thus remain inaccessible to enterprises outside these towns.
W T O A N D R E G I O N A L T R A D E N E G O T I A T I O N O U T C O M E S : Q U A N T I T A T I V E
A S S E S S M E N T S O F P O T E N T I A L I M P L I C A T I O N S O N B A N G L A D E S H
220 safety regulation by the EU. This safety regulation which became binding this year shifts the safety procedures further down the chain of production to the individual farmer (Regulation (EC) No 178/2002). The traceability rules of Article 18 of this regulation clearly indicate that the responsibility for food safety is now extended to the individual farmers. In a country like Bangladesh, where more than 60 per cent of the population is dependent on agriculture and largely semi-subsistence farming, it is difficult to conceive a system of this kind. 10.3.2. Export Demand Response to Changes in World Income and
Price It is often argued that Bangladesh’s export is influenced by income and economic activities in the global economy, and particularly in the principal importing countries such as the USA and EU. A number of econometric exercises attempting at explaining the variation in the “demand for exports” have found that the world income elasticity demand for Bangladesh’s export is quite high (i.e. income elastic), while own price elasticity of demand is very low (usually highly price inelastic). From these results, it is inferred that the country’s export is more influenced by variation in world income than by changes in its prices. This line of reasoning has serious flaws – both theoretical and empirical.
An important issue related to demand elasticity estimates is their suggestion toward the relative importance of external demand and domestic supply factors in determining export success. If a country is ‘small’ in international market, it will be expected that the price elasticity of demand facing the country is infinity, or, at least very large.22 Under such circumstances, it is the domestic supply capacity (and factors) that determines the export performance. On the other hand, if the country has some market power, price elasticity of demand will be low; substantial market power will be reflected in price inelastic demand.
22 In other words, this suggests that the country does not have any market power and it
just accepts the world price passively.
M A R K E T A C C E S S P R O B L E M S O F B A N G L A D E S H ’ S E X P O R T P R O D U C T S :
A S T U D Y O N S O M E S E L E C T E D S U B - S E C T O R S
221Box 10.1: The Elasticity Debate in International Trade
It is very common to think that many developing countries and smaller developed countries do not have market power in the world market and most trade economists do not hesitate to rely on the “small country” assumption for purpose of deriving policy prescriptions. Implicit in this assumption is that the export price elasticity of demand should be infinite or, at least, very large. By contrast, most empirical studies have estimated very small price elasticities. In their widely cited review Goldstein and Khan (1985) observed that the “consensus estimates” had been in the range of -0.5 to -1.0. The relatively recent estimates by Senhadji and Montenegro (1998) for as many as 53 countries also lend support to this consensus view. In the context of Bangladesh as well, an overwhelming majority of studies have found price elasticities to be considerably lower than one (absolutely). These results have a serious implicit implication in terms of challenging the policy of export promotion since in the presence of such highly price inelastic demand the optimal trade policy option will be to impose taxes on exports rather than to provide incentives. It is also difficult to perceive why the country should have such a strong market power, as reflected in the low price elasticity estimates, when close substitutes for its export items are widely available in international markets. It was Riedel (1988) who first argued the problems of low price elasticity estimates and, Riedel and Athukorala in various studies provided counter evidence using Asian NIEs as case studies, which, however, had been contradicted by Muscatelli et al. (1992, 1994, 1995). Recently Panagariya et al. (2001) have developed a better theoretical framework and used sophisticated econometric technique to find that the price elasticity of demand for Bangladesh’s RMG export to the US market is -26, which is much higher (absolutely) than the traditional consensus estimate. Using the same framework Razzaque (2003) estimates the price elasticity of demand in the EU market to be in the range –11 to -30. These results, therefore, approximate the small country assumption for Bangladesh, which is compatible with the policy of export promotion and trade liberalization. Notwithstanding this academic debate, there is a broad consensus that Bangladesh’s export performance is more affected by its supply side constraints than demand restricting factors. Source: Razzaque (2003).
The results showing price inelastic and income elastic demand for
Bangladesh’s exports have a serious implicit implication in terms of challenging the policy of export promotion since in the presence of such highly price inelastic demand the optimal trade policy option will be to
W T O A N D R E G I O N A L T R A D E N E G O T I A T I O N O U T C O M E S : Q U A N T I T A T I V E
A S S E S S M E N T S O F P O T E N T I A L I M P L I C A T I O N S O N B A N G L A D E S H
222 impose taxes on exports rather than to provide incentives.23 It is also difficult to perceive why the country should have such a strong market power, as reflected in the low price elasticity estimates, when close substitutes for its export items are widely available in international markets. In recent times, however, these results have been challenged and it has been found that the price elasticity of demand for Bangladesh’s exports is quite large and the country is to be considered as a price taker in the international market (see box 10.1). These findings are compatible with the policy of export incentive and more importantly they underline the importance of supply side factors in expanding the country’s export revenues. Therefore, the problem of small size of the external market as a constraint to Bangladesh’s exports can be ruled out. 10.3.3. Advent of Substitutes in World Market Advent of substitutes may undermine the prospect of currently exported items. This has been particularly true in the case of Bangladesh’s exports of raw jute and jute goods. Bangladesh has always been the largest exporter of raw jute and during the past three decades its share in world raw jute market has increased from 56 to about 95 percent. However, jute has experienced a fierce competition from synthetic fibres, which caused its demand to decline massively. Polypropylene (PP), which is derived as a by-product from the petroleum industry, is jute’s main substitute. Being a residual product, PP is a relatively cheaper source of raw material in the production of synthetic products. Although jute and PP are close substitutes, PP has a number of advantages that include lighter weight and moisture resistance. As jute has failed to withstand a stiff competition from synthetic products, between the early-1970s and the late-1990s the world annual imports of raw jute plummeted by more than 52 per cent from about 900,000 to about 430000 metric tons. Price of raw jute, world import expenditure and Bangladesh export earnings from jute, in real terms, also fell remarkably.
23 In the case of goods with price inelastic demand, movement in prices will have only
a little effect on quantity demanded. For such goods any expansion of supply will cause a fall in overall industry revenue and only an increase in demand will expand the market (in terms of total expenditures by the consumers).
M A R K E T A C C E S S P R O B L E M S O F B A N G L A D E S H ’ S E X P O R T P R O D U C T S :
A S T U D Y O N S O M E S E L E C T E D S U B - S E C T O R S
223Like raw jute, Bangladesh has a large market share in jute goods
where India is the only other major competitor. By the end of the 1990s Bangladesh and India together supplied around 70 percent of world’s exports with the former capturing a market share of about 45 per cent and the latter 25. However, compared to the early 1980s world exports of jute goods in the late 1990s fell by about 50 per cent and consequently, the export earnings of Bangladesh had been either stagnant or falling over the past two decades or so.
10.3.4. Trade Policies of the Trading Partners While world income may not be considered as a major constraint for the growth of Bangladesh’s export, trade policies of the important trading partners can act as important factors in accessing the export markets. High tariffs, quantitative restrictions, subsidies given to the local firms, and various non-tariff and technical barriers are instruments that may be used in importing countries to discourage firms in exporting countries in entering into the domestic markets. These instruments can be used either in a non-discriminatory way thus treating imports from all other countries equally, but there are many instances when they are used selectively providing preference to one group of countries over others. Trade policies in the partner countries have had both positive and negative effects on Bangladesh’s exports.
On positive side, the preferential market access enjoyed by Bangladesh, as an LDC, under various GSP schemes has given the country’s exporters some competitive edge over counterparts in other countries who do not have such preferences. Particularly, the EU GSP has been quite attractive, as it has allowed zero-tariff and quota-free access for most of Bangladesh’s exports. Largely because of this preferential treatment the share of EU in total exports from Bangladesh increased from about 20 per cent in the mid-1980s to about 51 per cent in 2003. Since 2001 under the Everything But Arms (EBA) initiative, the EU has been providing more extended preferential treatment to all LDCs.24 Australia, Canada, Japan, and the USA, are other countries that
24 Even before the EBA initiative the EU offered the best market access for the LDCs,
with less than 5 per cent of their exports facing a tariff barrier.
W T O A N D R E G I O N A L T R A D E N E G O T I A T I O N O U T C O M E S : Q U A N T I T A T I V E
A S S E S S M E N T S O F P O T E N T I A L I M P L I C A T I O N S O N B A N G L A D E S H
224 have also provided some tariff concessions (under their GSP schemes) to LDCs including Bangladesh. Australia and Canada have also allowed duty and quota-free access of most LDC exports. Despite the above favourable treatment, Bangladesh faces significant market access barriers in most of her important trade partner countries. In the USA, exporters have been severely constrained by the high tariff rates on items of their interest.
Amongst other important developed trade partners, in the EU market the main problem is the application of a stringent EU-RoO in determining Bangladesh’s zero-tariff and quota-free access, which greatly reduces the country’s supply capacity. Bangladesh has requested the EU for separate and flexible RoO for the EU, but until now no positive response has been obtained. Since 2002 Japan has offered a new GSP Scheme that covers a number of items including textiles and apparels and allows zero-tariff market access for products originating in LDCs. This may provide substantial competitive advantage for Bangladesh although partly because of the complex and restrictive nature of internal distribution system, exporters have so far failed to penetrate into the market.
Republic of Korea, China, and India are three important sources of Bangladesh’s imports, but no significant preferences are granted in these markets. Only recently, China has agreed to provide some tariff concessions under the proposed Asia-Pacific Trade Agreement and it is yet to be seen how far this will benefit Bangladesh. Together with the trade through informal channel, India is by far the biggest source of imports. Despite suffering from huge and sustained trade deficits, India has not provided any meaningful trade concessions to Bangladesh. While some insignificant tariff concessions have been offered under regional trading initiative, non-tariff and para-tariff barriers far outweigh the benefits of tariff concessions making export almost impossible (see table 10.4).
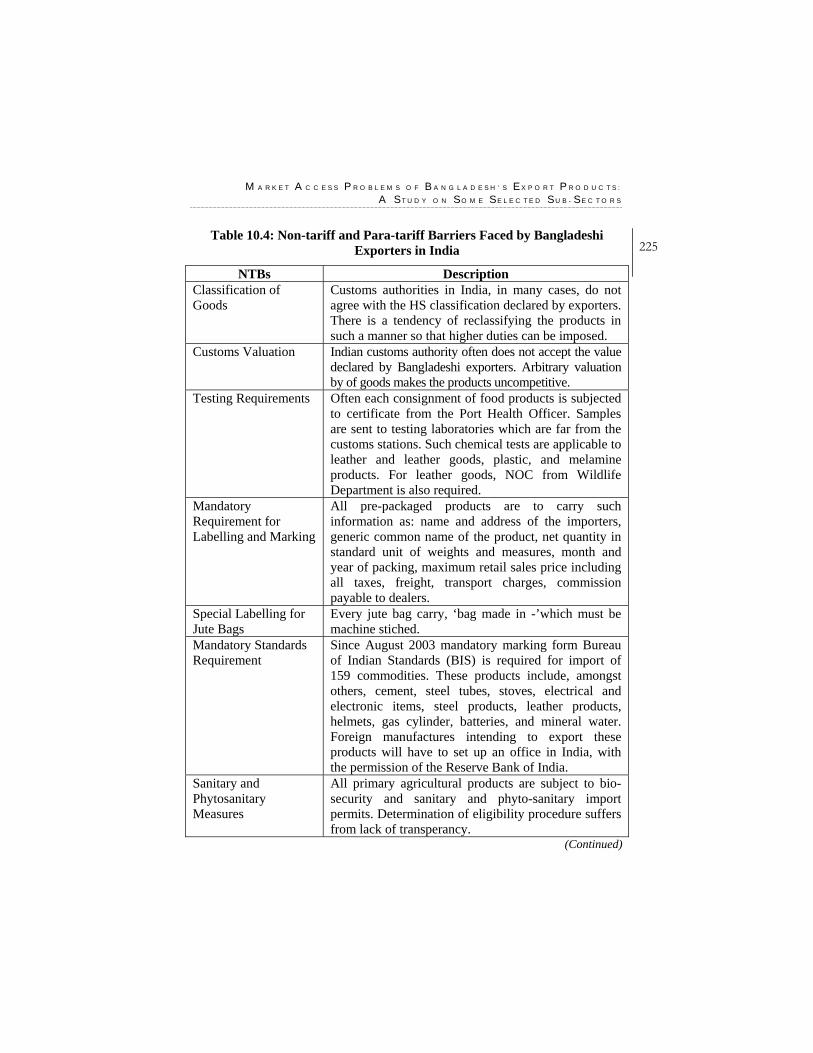
M A R K E T A C C E S S P R O B L E M S O F B A N G L A D E S H ’ S E X P O R T P R O D U C T S :
A S T U D Y O N S O M E S E L E C T E D S U B - S E C T O R S
225Table 10.4: Non-tariff and Para-tariff Barriers Faced by Bangladeshi
Exporters in India
NTBs Description Classification of Goods
Customs authorities in India, in many cases, do not agree with the HS classification declared by exporters. There is a tendency of reclassifying the products in such a manner so that higher duties can be imposed.
Customs Valuation Indian customs authority often does not accept the value declared by Bangladeshi exporters. Arbitrary valuation by of goods makes the products uncompetitive.
Testing Requirements Often each consignment of food products is subjected to certificate from the Port Health Officer. Samples are sent to testing laboratories which are far from the customs stations. Such chemical tests are applicable to leather and leather goods, plastic, and melamine products. For leather goods, NOC from Wildlife Department is also required.
Mandatory Requirement for Labelling and Marking
All pre-packaged products are to carry such information as: name and address of the importers, generic common name of the product, net quantity in standard unit of weights and measures, month and year of packing, maximum retail sales price including all taxes, freight, transport charges, commission payable to dealers.
Special Labelling for Jute Bags
Every jute bag carry, ‘bag made in -’which must be machine stiched.
Mandatory Standards Requirement
Since August 2003 mandatory marking form Bureau of Indian Standards (BIS) is required for import of 159 commodities. These products include, amongst others, cement, steel tubes, stoves, electrical and electronic items, steel products, leather products, helmets, gas cylinder, batteries, and mineral water. Foreign manufactures intending to export these products will have to set up an office in India, with the permission of the Reserve Bank of India.
Sanitary and Phytosanitary Measures
All primary agricultural products are subject to bio-security and sanitary and phyto-sanitary import permits. Determination of eligibility procedure suffers from lack of transperancy.
(Continued)
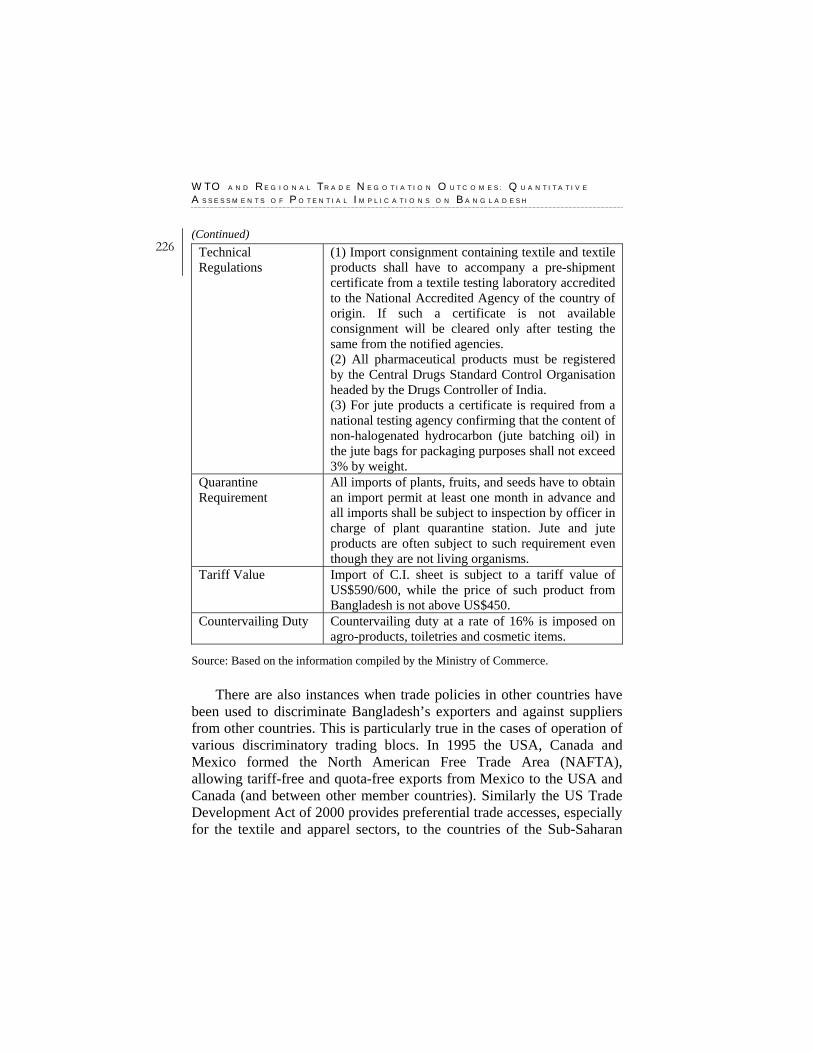
W T O A N D R E G I O N A L T R A D E N E G O T I A T I O N O U T C O M E S : Q U A N T I T A T I V E
A S S E S S M E N T S O F P O T E N T I A L I M P L I C A T I O N S O N B A N G L A D E S H
226 (Continued)
Technical Regulations
(1) Import consignment containing textile and textile products shall have to accompany a pre-shipment certificate from a textile testing laboratory accredited to the National Accredited Agency of the country of origin. If such a certificate is not available consignment will be cleared only after testing the same from the notified agencies. (2) All pharmaceutical products must be registered by the Central Drugs Standard Control Organisation headed by the Drugs Controller of India. (3) For jute products a certificate is required from a national testing agency confirming that the content of non-halogenated hydrocarbon (jute batching oil) in the jute bags for packaging purposes shall not exceed 3% by weight.
Quarantine Requirement
All imports of plants, fruits, and seeds have to obtain an import permit at least one month in advance and all imports shall be subject to inspection by officer in charge of plant quarantine station. Jute and jute products are often subject to such requirement even though they are not living organisms.
Tariff Value Import of C.I. sheet is subject to a tariff value of US$590/600, while the price of such product from Bangladesh is not above US$450.
Countervailing Duty Countervailing duty at a rate of 16% is imposed on agro-products, toiletries and cosmetic items.
Source: Based on the information compiled by the Ministry of Commerce.
There are also instances when trade policies in other countries have been used to discriminate Bangladesh’s exporters and against suppliers from other countries. This is particularly true in the cases of operation of various discriminatory trading blocs. In 1995 the USA, Canada and Mexico formed the North American Free Trade Area (NAFTA), allowing tariff-free and quota-free exports from Mexico to the USA and Canada (and between other member countries). Similarly the US Trade Development Act of 2000 provides preferential trade accesses, especially for the textile and apparel sectors, to the countries of the Sub-Saharan
M A R K E T A C C E S S P R O B L E M S O F B A N G L A D E S H ’ S E X P O R T P R O D U C T S :
A S T U D Y O N S O M E S E L E C T E D S U B - S E C T O R S
227Africa (SSA) and the Caribbean Basin Initiative (CBI) countries.25 Although the TDA preferential treatment covers 34 of the 49 LDCs along with a large number of non-LDC developing countries, no comparable preference is allowed for Bangladesh.26
There is a strong evidence to suggest that discriminatory preferences may lead to export price shock for excluded countries resulting in deteriorating terms of trade and ensuing loss of welfare (Chang and Winters, 1999; Winters and Chang, 2000). In the case of textile and clothing such preferential access is likely to bring disastrous consequences for Bangladesh. Since even in the post-MFA period high tariffs on textile items are continuing to exist, the preferential treatment already given to other countries may be enough to cause not only trade but also the inflow of foreign investment diversion in favour of these countries at the expense of Bangladesh and other LDCs.
In recent times, there has been a growing tendency of the use of non-tariff barriers (NTBs) in the form of anti-dumping duties (ADDs), countervailing duties (CVDs), technical barriers (TBT), and compliance requirements with respect to sanitary and phyto-sanitary measures (SPSM) and environment (such as eco-labeling). Indiscriminate use of these trade-restricting measures hinders market access of export. Bangladesh’s exports of clothing items and shrimps have been subjected to various NTBs, both in the markets of developed countries such as the USA, and EU, and also developing countries such as India.
10.3.5. Pressure Groups and Social Campaign
Often the demand for export of a particular product as well as of a country is affected by social campaign of different international pressure groups that tend to focus on such factors in which a typical LDC like Bangladesh has a clear comparative disadvantage. Working environment,
25 Detailed discussions on the US Trade and Development Act are available in
Bhttacharya and Rahman (2000b). 26 There is an apprehension that the TDA can pose a formidable export challenge to
Bangladesh in the near future as some of the beneficiary countries have demonstrated robust export performance in a number of T&C products that are of high export interest of Bangladesh (Bhattachariya and Rahman, 2000b).
W T O A N D R E G I O N A L T R A D E N E G O T I A T I O N O U T C O M E S : Q U A N T I T A T I V E
A S S E S S M E N T S O F P O T E N T I A L I M P L I C A T I O N S O N B A N G L A D E S H
228 employment of children, and labour rights are most commonly chosen subjects by these groups to demonstrate ‘exploitation of workers’ on the basis of which consumers are urged to boycott products manufactured under such conditions. These activities seem to ignore the reality of the LDCs and whatever may the objective behind such campaign they do more harm than good to the workers employed. Along with these pressure groups, buyers and policy makers of developed countries sometimes also press for these issues. In the past Bangladesh had to cope with a severe problem with regard to employment of children in the RMG industry that could have resulted in an import ban by the USA. The problem was successfully tackled by signing a tripartite agreement involving BGMEA, UNICEF, and ILO and retrenching the children from the factory. RMG is not the only sector where children were working and, consequently, the demand for banning child work in the export sector did not constitute any sensible way of addressing the problem.27 As regards other working environment compliance issues, closure of factories in the face of import ban or boycott by consumers in importing countries will only deteriorate the conditions of the workers. If workers’ welfare is the real concern, with support from developed countries and their buyers improvement in the factory conditions can be achieved gradually and steadily.
10.3.6. Restrictions on Movement of Natural Persons
Immigration regulations and barriers related to visa and work permit procedures are one of the major restrictions of services trade liberalisation, especially under mode 4 of services trade. In most of the cases, no distinction has been made between temporary and permanent movement of workers and the process involves complicated, non-transparent and costly steps through labour market regulations. Even, sometimes temporary workers have to undergo a two-permit entry procedure-one for visa and the other for work permit. The restrictions and regulations get more demanding for the developing and least developed countries due to their existing administrative barriers. Moreover, service trade barriers for developing country suppliers are
27 This issue has been discussed in Razzaque and Rahman (1996).
M A R K E T A C C E S S P R O B L E M S O F B A N G L A D E S H ’ S E X P O R T P R O D U C T S :
A S T U D Y O N S O M E S E L E C T E D S U B - S E C T O R S
229more binding than for developed country suppliers in each other’s market. In terms of Migration regulations, they are biased towards high skilled workers and it is relatively easier to obtain visa for intracompany transferees and those associated with establishment of commercial presence. In general, movement of low skilled workers is the most restricted one. There are barriers in terms of Economic Needs Test which restricts the market driven process of free movement of natural persons. Lack of clearly established criteria of service providers make the process unpredictable, non-transparent and therefore create arbitrary barriers to mode 4 (a detailed discussion on these issues has been presented in chapter 9 of this volume).
10.4. Conclusion and Bangladesh’s Strategy There is no denying the fact that the export strategies in Bangladesh need to be revised with the aim of increasing the value added of its products in the export baskets. The current nature of the strategy which primarily encourages cheap exports to the EU and the USA is not sufficient to guarantee success. There is also a need for a specific market analysis in the EU and in other markets with the aim of opening up the opportunities. Serious market research should include opportunities to enter markets in which EU, US or other developed countries lose their competitive advantage when their capacity to directly or indirectly subsidise exports falls.
Bangladesh should negotiate strongly, taking on board other LDCs, in order to pursue the EU to relax the rules of origin provisions. There is a growing concern that the stringent RoO requirements in the EU work against the development needs of LDCs and hamper their integration in global production networks. It is a hard fact that the producers in these countries are subject to a limitation on the choice of suppliers and thus the likelihood that the product has less value added increases. Rules of origin could be negotiated country by country to agree on the needs and the guarantees necessary to avoid trade deflection; a-one-size-fits-all-rule is not cost effective and does not promote the local economy.
Another important factor Bangladesh will have to keep in mind is the SPS measures in the developed countries’ markets, especially in the EU. Bangladesh should request support to fulfil the SPS provisions, but
W T O A N D R E G I O N A L T R A D E N E G O T I A T I O N O U T C O M E S : Q U A N T I T A T I V E
A S S E S S M E N T S O F P O T E N T I A L I M P L I C A T I O N S O N B A N G L A D E S H
230 should also demand for alternative cost effective ways to ensure food safety. It should also request financing of necessary changes which are based on requirements above the international food safety obligations. In addition, Bangladesh should build the capacity to monitor the development and implications of SPS and other non-trade barriers in association with other countries to ensure that rules are developed with the full participation of the concerned countries and do not impose excessive costs for unlikely risks.
As an LDC, Bangladesh should also request assistance to the EU and also to other markets, (for example, Canada and Australia) where it enjoys DFQF market access, in promoting their goods, assisting traders in penetrating the market, by creating links between their traders and retailers, and exporters.
There is no denying that local infrastructure is also an important key to development; because, infrastructure development is an important ingredient to attract investors and to assist the development of local export industries. Under the WTO’s Aid for Trade negotiations Bangladesh may seek aid to develop the necessary infrastructures. In particular, Bangladesh can seek aid from the EU’s external aid facility.
Bangladesh should also try to gain access in the advanced developing countries’ markets. Indian market can be a high potential of export expansion of Bangladeshi products. However, as mentioned before, Bangladesh faces a number of non-tariff barriers in the Indian market, which hampers its export potentials. Bangladesh should try to negotiate with India, under SAFTA or under any bilateral negotiations, to give duty free access of her products to Indian market.
With respect to the movement of natural persons under mode 4 of services trade liberalisation, Bangladesh should pursue this issue jointly with other developing countries in the WTO negotiations.
CHAPTER ELEVEN
Selim Raihan and Abdur Razzaque Summary and Conclusions
A number of multilateral and regional trade negotiations have significant implications for the Bangladesh economy. This study has addressed various issues related to several important multilateral trade negotiations under WTO and the regional trading agreements under SAFTA and their potential implications on the Bangladesh economy. Effective policy negotiations partly depend on the policymakers’ (negotiators’) a priori assessment about the implications arising from different negotiation outcomes. Therefore, it is very important to provide the policymakers with ex ante analysis of alternative scenarios. A number of ex-ante analyses, using global and country general equilibrium models, have been undertaken by simulating the effects arising from alternative negotiating outcomes for Bangladesh. Chapter Three
Agriculture has been at the centre stage of multilateral trade negotiations during the past 20 years. Despite having a major progress in improving
W T O A N D R E G I O N A L T R A D E N E G O T I A T I O N O U T C O M E S : Q U A N T I T A T I V E
A S S E S S M E N T S O F P O T E N T I A L I M P L I C A T I O N S O N B A N G L A D E S H
232 the rules for trade, the overall achievement in terms of increasing market access for agricultural goods was considered to be ‘disappointing’ at the end of the Uruguay Round. Although under the WTO Agreement on Agriculture members committed to carrying on reforms, not much progress has so far been made in further opening-up of the markets. Nevertheless, agriculture continues to be an active area of negotiation. While the modalities for future liberalisation in the sector are being negotiated, the potential implications arising from such liberalisation have drawn a lot of attention. Several studies predict that, with the elimination of export and production subsidies, prices of agricultural commodities are likely to increase. This will be beneficial to a number of developing countries that have clear comparative advantage in the sector. Liberalisation will also imply further market access opportunities for these countries as a result of reduced tariff barriers in the developed country markets. However, not all developing countries are net-exporters of agricultural products, and many of them actually depend on the world market for their supplies. Consequently, agricultural trade liberalisation could adversely affect these countries.
Using the GTAP model, our research reveals that full global liberalisation of the trade in agricultural products will generate some significant global welfare gains. However, while partial liberalisation will lead to some modest increase in world trade and welfare gains, the impact of complete removal of export subsidies alone, as agreed in the Hong Kong Ministerial Conference will generate some net global welfare loss. The simulation results clearly demonstrate that the global distribution of welfare gains from agricultural trade liberalisation is going to be highly unequal. Therefore, while Bangladesh stands to suffer from welfare losses in most cases, countries like China, India, and Thailand are set to net welfare gains. It appears that full global agricultural liberalisation will lead to higher welfare loss and significant rise in poverty indices in Bangladesh. Even a partial liberalisation and the Hong Kong scenario will generate negative impact on the welfare and will result in some increases in poverty. It may thus be argued that the achievements in poverty reduction in Bangladesh during the 1990s could come under threat if significant global liberalisation of agricultural trade takes place.
S U M M A R Y A N D C O N C L U S I O N S
233Chapter Four
Bangladesh is one of the very few LDCs for which high tariffs continue to be a major problem for its most important export items, as the US has excluded them from its most attractive preferential schemes. As a consequence, Bangladesh’s exports of textile and clothing in the US market are subject to an average tariff peak of 16 percent with many individual items facing rates as high as 35-40 percent. This high tariff seriously affects Bangladesh’s relative competitiveness. In the Hong Kong Ministerial Conference (MC), developed countries made binding commitment with regard to providing duty-free and quota-free access to products originating from LDCs. However, the declaration allowed ‘members facing difficulties’ to reduce the LDC product coverage for duty-free treatment to 97 percent of tariff lines. As Bangladesh’s exports are heavily concentrated on a few textile and clothing categories, the Hong Kong MC declaration would essentially imply no additional benefits at all.
Using the GTAP model our research has explored the impacts of different DFQF scenarios on different economies and on the economy of Bangladesh. It appears that the DFQF market access of LDCs in the developed countries will generate large welfare gains for the LDCs, including Bangladesh. In fact, the gain to Bangladesh alone is likely to constitute a major portion of the total LDCs’ gain. It is also conserved that even a DFQF market access only in the US market was lead to a large welfare gain for Bangladesh. The concern of the developing countries about the possibility of their losses can not be ruled out. However, the losses of the developing countries appear to very small compared to the gains of the LDCs. The impacts of different DFQF market access scenarios on the economy of Bangladesh are also explored using the Bangladesh dynamic CGE model. The DFQF scenarios have positive impacts on the macroeconomy and on the expansion of the RMG sectors. Also, they have important positive impacts in alleviating poverty in Bangladesh.
Chapter Five
WTO negotiations with respect to the non-agricultural commodities centre around the enhancement of Non-Agricultural Market Access (NAMA), and are, therefore, proceeding towards the elimination or the
W T O A N D R E G I O N A L T R A D E N E G O T I A T I O N O U T C O M E S : Q U A N T I T A T I V E
A S S E S S M E N T S O F P O T E N T I A L I M P L I C A T I O N S O N B A N G L A D E S H
234 reduction of bound tariff rates, bringing unbound tariff rates under binding commitments which will be subject to formula cuts, and identifying and removing Non-tariff Barriers (NTBs). The consensus on NAMA modalities, reached so far, include the use of a ‘Swiss-type’ formula for the reduction in the bound tariff rates, consideration of a non-linear mark up approach for establishing base rates of the unbound tariff rates, special and differential treatments for the developing countries in terms of allowing them ‘less than full reciprocity’ of commitments, and to keep LDCs above any commitment to undertake tariff cuts. It is, however, important to note that though the LDCs are exempted from tariff cuts under the NAMA negotiations, they are likely to experience both positive and negative impacts on their economy if NAMA negotiations are implemented. On the positive side, because of tariff cuts by the developed and developing countries, LDCs are likely to have greater market access in many of these countries. However, on the negative side, LDCs may suffer from possible preference erosion in countries (for example in the EU) where they are currently enjoying duty-free and quota-free market access.
The research has explored three different NAMA scenarios with a view to estimate the preference erosion of Bangladesh’s RMG exports in the EU market and the possible gains in the USA and other markets. Using the GTAP general equilibrium method this paper has also estimated the welfare impacts of different NAMA scenarios. It appears from the simulation results that the NAMA scenarios, in general, will lead to large preference erosion of Bangladesh RMG exports in the EU and Canadian markets, where Bangladesh in currently enjoying duty-free-quota-free market access. However, there is a large gain in the USA market and the gain is sufficient enough to offset the losses in the EU and Canadian market, and as a result, both total RMG exports and welfare rise. The Bangladesh dynamic CGE model has been applied to explore the impacts of different NAMA scenarios on the economy of Bangladesh. All NAMA scenarios generate some positive impact on the economy and lead to some expansion of the RMG sectors. They also increase households’ welfare and reduce poverty.
S U M M A R Y A N D C O N C L U S I O N S
235Chapter Six
Bangladesh has entered into or in the process of several regional and bilateral trading arrangements, i.e., SAFTA, BIMSTEC, FTAs with India, Pakistan and the USA. Among these negotiations only SAFTA has been materialised. SAFTA is the regional trading arrangement among the South Asian countries. The tariff reduction programme under SAFTA was commenced on 1 July 2006. The Agreement on SAFTA has seven core elements which are: (i) trade liberalisation programme; (ii) Rules of Origin; (iii) institutional arrangements; (iv) revenue compensation mechanism; (v) technical assistance for LDCs; (vi) safeguard measures; and (vii) consultations and dispute settlement procedures. It is targeted that all tariff barriers among the SAFTA member countries will be eliminated by 2015, though there are provisions for negative lists and preferences for LDCs in South Asia. The intra-regional imports among the South Asian countries as a share of world imports is very low, only 4.45 percent. However, there are differences among individual countries in South Asia. For example, while India’s figure of total imports from other South Asian countries is only 0.86 percent of her total imports from all over the world, Bangladesh’s corresponding share is 20.3 percent. Bangladesh is the largest importer in South Asia as far as regional imports share is concerned. On the other hand, the share of South Asia’s intra-regional exports in world exports is only 6.14 percent, which implies that South Asia is not an important export destination for almost all the South Asian countries. For example, the corresponding figure for Bangladesh is only 1.84 percent. Apart from Maldives, Bangladesh is the lowest exporter in South Asia as far as regional exports share is concerned. Using the global general equilibrium model, namely the GTAP model, our research has estimated the trade creation and trade diversion aspects of the total welfare effects of SAFTA scenarios. It appears that a full implementation of SAFTA will lead to welfare gains for India, Sri Lanka and rest of South Asian countries, though Bangladesh suffers from welfare loss. Bangladesh’s welfare loss is mainly driven by the negative trade diversion effect. Simulation results also suggest that the negative trade diversion effect can be undermined by some associated unilateral trade liberalisation measure.
W T O A N D R E G I O N A L T R A D E N E G O T I A T I O N O U T C O M E S : Q U A N T I T A T I V E
A S S E S S M E N T S O F P O T E N T I A L I M P L I C A T I O N S O N B A N G L A D E S H
236 Chapter Seven
Despite Bangladesh’s posting some robust export growth rates in the first 18 months following the quota phase out, there are credible reasons to believe that the safeguard measures imposed on China both by the EU and US have critically supported the country’s achieving such an impressive performance. Removal of all restrictions from China, which is to take effect from the very beginning of 2009, would definitely lead to a much more challenging situation. Only in the first six months of 2005 China was allowed to export freely and Bangladesh eventually saw its exports for that year declining in the EU market. Although no such trend could be observed in the US market, Bangladesh was found to have performed much better after the quantitative limits had been slapped on China. There is a high similarity between export items of Bangladesh and China in the US market and consequently free trade in that market will potentially open up a fierce competition between these two suppliers. It might be that the previously existing quota rents had helped Bangladesh keep afloat in the US market before quantitative limits were imposed on China. On the other hand, the quota-free access to the EU market even before the expiry of the quota regime dissipated all quota rents for Bangladesh, making it unable to cushion the price fall that marked the transition to post-MFA period causing export receipts to decline. In this backdrop, there are genuine concerns to suppose that in a truly free trade situation China would pose formidable challenge to Bangladesh and other suppliers.
During the transition to quota-free trade regime, Bangladesh’s exporters have also benefited from a depreciated exchange rate, which is unlikely to continue for an indefinite period. Furthermore, the recently proposed wage hike in the garment industry will surely erode some competitive margin. Supply side bottlenecks aggravated by destructive political unrest and excessive cost of doing business are always major causes for concern and failure to make improvements in these areas will only undermine the export prospect under a real restriction-free clothing trade regime. In fine, a quota-free world with restricted supplies from the world’s most efficient producer has been a blessing for Bangladesh for its exporters to stage a stunning performance, which, however, might turn into a short episode before the real free-trade situation being installed in about two years from now.
S U M M A R Y A N D C O N C L U S I O N S
237Chapter Eight
International aid circulating from the developed to the developing and least developed countries is not new. Along with its other bilateral and multilateral characteristics, there is a common ideology that international assistance comes with some development strategies, designed by the developed country experts in most of the cases. However, in international trade negotiations under WTO talks, a new concept of Aid for Trade (AfT) has been incorporated in the Hong Kong Ministerial Declaration for the first time, as a special and committed assistance aimed at fostering trade. AfT has an initial objective of helping specially the LDCs and also the developing countries to maximize the benefits from enhanced market access as well as to minimize the costs of trade liberalization. This new part of negotiation is subject to a relatively short time preparation in terms of definition, distinction between provisions for developing and least developed countries, and therefore, reaching agreements under the ongoing Doha Round of negotiations.
The research suggests that Aid for Trade should be incorporated in the national growth and development agenda of a country to act effectively on its goal, rather than being implemented separately. For this, mainstreaming of trade in national development agenda is very important. In broader sense, there are three determinants of export performance: domestic productive capacity, trade related infrastructure including transport and storage facilities, and effective market access. AfT can work for enhancing the first two, and therefore, providing assistance for capacity building in market access negotiations. Balance of payments problems can be tackled by gradual improvement of productive efficiency which will help reducing import dependence. Different donor agencies have different rules and regulations regarding funding. There is a need for coordination based on some common rules to bring them altogether to contribute to a stable and predictable source of Aid for Trade. Aid for Trade as a development agenda, is aimed to reduce poverty which cannot be achieved without more and better employment generation. Therefore, the program should explicitly include employment dimension to act as pro-poor. The effectiveness of Aid is subject to a better partnership arrangement between the recipient country government and the donor agencies in terms of ownership of funds, alignment with the agendas of the partners and harmonization in terms of information and simplification along with mutual accountability.
W T O A N D R E G I O N A L T R A D E N E G O T I A T I O N O U T C O M E S : Q U A N T I T A T I V E
A S S E S S M E N T S O F P O T E N T I A L I M P L I C A T I O N S O N B A N G L A D E S H
238 Chapter Nine
The service sector now constitutes about 50 percent of Bangladesh’s GDP and is the second largest source of employment. In Bangladesh the growth of the service sector has been faster than the overall GDP growth. There is no denying the fact that the Bangladesh has important stakes in the negotiations on global liberalisation of the service sector. It is understood that that there are significant scopes for Bangladesh for taking firm position in the WTO negotiations in the case of services, especially with respect to the mode 4. Bangladesh has large endowment of low and semi-skilled labour, and the remittance incomes from the low and semi skilled labour have significant shares in her national income. It is suggested that on the whole, Bangladesh’s policy stance should focus on negotiations relating the ‘non-reciprocal’ mode 4 liberalisation, separation of temporary from permanent movements of natural persons, and to go for plurilateral negotiations with the developing countries to place the request for multiple entry GATS visa. Further, there should be requests for provisions to bring uniformity in definition of service personnel and to increase coverage. To foster the negotiation under mode 4 market access Bangladesh should prepare for submitting proposals highlighting the sectors of their interest for consideration of the negotiators focusing on issues like, inclusion of the less skilled under contractual service suppliers under a new sub-category, addressing definitional and classification issues, non-uniform enforcement issues to develop a revised model schedule to incorporate lower skill categories of service providers. Bangladesh along with other LDCs may seek for the special provisions under LDC modalities, in terms of ‘non-reciprocal treatment’. According to GATS document (article XIX), the developing countries are allowed with appropriate flexibility in an individual country basis for negotiation. This implies Bangladesh should consider the country specific interests of the developing countries to take proper policy stance.
Chapter Ten
The research has also explored the market access problems of seven thrust sectors with export potentials in Bangladesh. It appears that there are a number of market access problems which include: (1) standards and quality of products, (2) income and economic activities in countries of
S U M M A R Y A N D C O N C L U S I O N S
239important export interest to Bangladesh, (3) advent of substitutes in international markets, (4) trade policies of the significant importing countries, (5) various campaign by pressure groups, and (6) various restrictions against the movement of natural persons from Bangladesh and other developing countries to the developed countries. It is suggested that the export strategies in Bangladesh need to be revised with the aim of increasing the value added of its products in the export baskets. The current nature of the strategy which primarily encourages cheap exports to the EU and the USA is not sufficient to guarantee success. There is also a need for a specific market analysis in the EU and in other markets with the aim of opening up the opportunities. Serious market research should include opportunities to enter markets in which EU, US or other developed countries lose their competitive advantage when their capacity to directly or indirectly subsidise exports falls. It is also highlighted that Bangladesh should negotiate strongly taking on board other LDCs in order to pursue the EU to relax the rules of origin provisions. As a LDCs, Bangladesh should also request assistance to the EU and also to other markets, (for example, Canada and Australia) where it enjoys DFQF market access, in promoting their goods, assisting traders in penetrating the market, by creating links between their traders and retailers, and exporters. Bangladesh should also try to gain duty free access of her products in the advanced developing countries, i.e., the Indian market. With respect to the movement of natural persons under mode 4 of services trade liberalisation, Bangladesh should pursue this issue jointly with other developing countries in the WTO negotiations.
REFERENCES
Ahmed, S., and Satter, Z. (2004), ‘Impact of Trade Liberalisation Looking at the Evidence’, Economics and Political weekly, September 4, 2004.
Annabi, N., Khondker, B., Raihan, S., Cockburn, J., and Decaluwé, B. (2006), “WTO Agreements and Domestic Policy Reforms – Implications for Poverty in Bangladesh: A Study in a Dynamic Sequential CGE Framework.” in Hertel, T. and Winters, A. (eds.) Poverty and the WTO: Impacts of the Doha Development Agenda, The World Bank and the Palgrave Macmillan, Washington DC.
BBS (2000a), Household Income and Expenditure Survey 1999–2000. Bangladesh Bureau of Statistics: Ministry of Planning, Government of the People’s Republic of Bangladesh.
BBS (2000b), Labour Force Survey 1999–2000. Bangladesh Bureau of Statistics: Ministry of Planning, Government of the People’s Republic of Bangladesh.
BBS (2002), Statistical Yearbook of Bangladesh 2002. Bangladesh Bureau of Statistics: Ministry of Planning, Government of the People’s Republic of Bangladesh.
Beghin J.C., Roland-Holst D. and van der Mensbrugghe D. (2002), “Global agricultural trade and the Doha Round: what are the implications for North and South?” Working Paper 02-WP 308, CARD, Iowa State University.
BGMEA (2006), Bangladesh Garments Manufacturers and Exporters Association, Newsletter, January, 2006
Bhattachariya, D. and Rahman, M. (2000a), “Experience With Implementation of WTO-ATC and Implications for Bangladesh”, CPD Occasional Paper Series, No. 7, Centre for Policy Dialogue, Dhaka, September.
Bhattachariya, D. and Rahman, M. (2000b), “USA Trade and Development Act 2000: A Response From Bangladesh Perspective”, CPD Occasional Paper Series, No. 6, Centre for Policy Dialogue, Dhaka, July.
Blanchet, T., Razzaque, A. and Biswas, H. (2005), “Documenting the Undocumented: Female Migrant Workers from Bangladesh”, Mimeo, Academy for Educational Development and SWISS Agency for Development Cooperation.
Bouët, A., Fontagné, L., Jean, S. (2005), “Is Erosion of Tariff Preferences a Serious Concern?” Working paper 14, CEPII, Paris
Brenton, P., and Ikezuki, T. (2005), “The Impact of Agricultural Trade Preferences, with Particular Attention to the LDCs.” In Aksoy, A. and Beghin, J. (eds.) Global
R E F E R E N C E S
241Agricultural Trade and the Developing Countries, Washington DC: World Bank
Bridges (2005), Weekly Trade News Digest, 15 December 2005, International Centre for Trade and Sustainable Development.
Centad (2005), South Asian Yearbook of Trade and Development, Centre for Trade and Development, New Delhi.
Chang, W. and Winters, L. A. (1999), “How Regional Blocs Affect Excluded Countries: The Price Effects of MERCOSUR,” CEPR Discussion Papers 2179, C.E.P.R. Discussion Papers
Cordella, T. and Ulku, H. (2004), “Grants versus Loans,” IMF Working Paper No. 04/161, International Monetary Fund, Washington.
Curran, L. Nilsson, L. and Frontini, G. (2006), “Multilateral trade liberalisation and the potential for preference erosion in the EU market." Paper presented at the 8th Annual ETSG Conference, Vienna, Austria. September.
CUTS (2004), “Movement of Natural Persons: A Case Study of South Asian Countries”, Mimeo, Jaipur, India.
Diao X., Somwaru A. and Roe T. (2001), “A Global Analysis of Agricultural Trade Reform in WTO Member Countries”, Economic Development Center Paper, University of Minnesota
Dimaranan B.V., Hertel T. and Keeney R. (2003), “OECD Domestic Support and the Developing Countries”, GTAP Working Paper 19.
Dimaranan, B. V. and McDougall, R.A. (2002), “Global Trade, Assistance, and Production: The GTAP 5 Data Base”, Center for Global Trade Analysis, Purdue University.
Elbehri A. and Leetmaa S. (2002), “How significant are export subsidies to agricultural trade? Trade and welfare implications of global reforms”, 5th Annual Conference on Global Economic Analysis, June 5-7, Taipei.
Feria, R.P., Kabir, N., Syed, A., Haque, M., and Wahab, A. (2003), “Preparing the SME and Medium Enterprise Development and Export Expansion Program”, TA 3879-BAN, Work in Process Draft, Asian Development Bank, May 2003.
Francois J. and C. R. Shiells (1994), Modeling Trade Policy: Applied General Equilibrium Assessments of North American Free Trade, Cambridge.
Francois, J., Hoekman, B., and Manchin, M. (2005). “Preference Erosion and Multilateral Trade Liberalization,” World Bank Policy Research Working Paper 3730, October 2005.
François, J., van Meijl, H., and van Tongeren, F. (2003), “Trade Liberalisation and Developing Countries under the Doha Round.” Tinbergen Institute Discussion Paper 2003-060/2, University of Rotterdam, Rotterdam, The Netherlands.
Goldstein, M. and Khan, M.S. (1985), “Income and Price Effects in Foreign Trade.”, in R.W. Jones and Kenen, P.B (eds) Handbook of International Economics, Vol. 2. Amsterdam, Elsevier.
Hammouda, H. B., Karingi, S.N., Oulmane, N, and Jallab, M.S. (2006), “Market access for non-agricultural products, The impact of the Doha Round on African
W T O A N D R E G I O N A L T R A D E N E G O T I A T I O N O U T C O M E S : Q U A N T I T A T I V E
A S S E S S M E N T S O F P O T E N T I A L I M P L I C A T I O N S O N B A N G L A D E S H
242 economies: A simulation exercise”, A paper presented in the 9th GTAP Conference, Addis Ababa.
Haque, M. (2003), “Diagnostic Review of Selected Public Sector Institutions”, Paper prepared for the Asian Development Bank.
Harrison, W. J. and Pearson, K R. (1996), “Computing Solutions for Large General Equilibrium Models Using GEMPACK,” Computational Economics, Springer, vol. 9(2), pages 83-127, May
Hertel T., Anderson, K., Francois J. and Martin W. (2000), “Agriculture and non-agricultural liberalisation in the Millennium round”, CIES Policy Discussion Paper 0016, University of Adelaide, Australia.
Hertel, T.W. (1997), Global Trade Analysis: Modeling and Applications, Cambridge University Press, Cambridge
Hoekman, B. (2005), “Preference Erosion and the Doha Development Agenda”, World Bank and CEPR. November 1, 2005.
Hoekman, B., Ng, F. and Olarreaga, M. (2002), ‘Tariff Peaks in the Quad and Least Developed Country Exports’, World Bank Economic Review 16:1-22
International Trade Center (2000), “Business Guide to General Agreement on Trade in Services”, revised edition, Commonwealth Secretariat, London
Low, P., Piermartini, R. and Richtering, J. (2005), “Multilateral Solutions to the Erosion of Non-Reciprocal Preferences in NAMA”, Working Paper ERSD-2005-05, World Trade Organization, Economic Research and Statistics Division.
Martin, W. and Winters, L. A. (1996), “The Uruguay Round: A Milestone for Developing Countries”, in Martin, W. and Winters, L.A. (eds), The Uruguay Round and the Developing Countries, Cambridge University Press.
McCulloch, N., Winters, L.A. and Cirera, X. (2001), Trade Liberalization and Poverty: A Handbook. Centre for Economic Policy Research. London.
Mlachila, M and Yang, Y. (2004), “The end of Textiles Quotas: A case Study of the Impact on Bangladesh’, IMF Working Paper, WP/04/108, Washington, DC.
Muscatelli, V.A., Srinivasan, T.G. and Vines, D. (1992), “Demand and Supply Factors in the Determination of NIE Exports: A Simultaneous Error-Correction Model for Hong Kong”, Economic Journal, vol.102, pp. 1467-77.
Muscatelli, V.A., Srinivasan, T.G. and Vines, D. (1994), “The Empirical Modelling of NIE exports: An Evaluation of Different Approaches”, Journal of Development Studies, vol.30, pp.279-302.
Muscatelli, V.A., Stevenson, A.A., and Montagna, C. (1995), “Modelling Aggregate Manufactured Exports for Some Asian Newly Industrialising Economies”, Review of Economics and Statistics, vol. 77, no. 1, pp.147-155.
Naik, G. (2005), “Tackling Agricultural Subsidies in WTO Negotiations”, in South Asian Yearbook of Trade and Development 2005, Centad, New Delhi.
Newfarmer, R. and Nowak, D. (2006), “The World Bank in Trade: The New Trade Agenda” in Newfarmer, R. (ed.). Trade, Doha and Development: A Window into the Issues. Washington DC: The World Bank.
R E F E R E N C E S
243OECD (2006), “The Development Dimension: Aid for Trade, Making It Effective”,
Preliminary Version, OECD, http://www.sourceoecd.org/development /9264026940
Panagariya, A., Shah, S. and Mishra, D. (2001), “Demand Elasticities in International Trade: Are They Really low?” Journal of Development Economics, vol.64, pp. 313-342.
Pandey, P.R. (2006), ‘Aid for Trade: A Viable Means to Realize Development Round’. Trade Insight. Vol.2, No.1.
Rahman, M and Shadat, W.B. (2006), “NAMA Negotiations in the WTO and Preference Erosion: Concerns of Bangladesh and Other Regional LDCs”. CSGR Working Paper No. 188/06
Rahman, M. and Razzaque, M.A. (1998), “Prospect of Apparel Exports from Bangladesh: Market Access under Uruguay Round and Beyond”, Social Science Review, vol. 15, No. 2, pp.185-209.
Ranjan, P. (2005), “Tariff Negotiations in NAMA and South Asia: July Agreement and Beyond”. Working Paper 3, Centre for Trade and Development, New Delhi.
Ranjan, P. (2006), “Industrial Tariffs and South Asia: Interpreting for Development”, Working Paper 5, Centre for Trade and Development, New Delhi.
Razi, Z. H. (2006), “Future Clothing Exports from Bangladesh: Disaggregated Scenario”, article published in the Daily Star, dated 15 July 2006.
Razzaque, A. (2005), “‘Sustaining RMG Export Growth after MFA Phase-out: An Analysis of Relevant Issues with Reference to Trade and human Development”, Final report of A Preparatory Assistance Project of Ministry of Commerce and United Nations Development Programme, Dhaka, Bangladesh.
Razzaque, M. A. (2003), “Agreement on Textiles and Clothing: Bangladesh’s Interest and Position in the Fifth WTO Ministerial”, Paper Prepared for UNCTAD, Geneva.
Razzaque, M.A. and Rahman, M.A. (1996), “Harkin’s Bill and the Issue of Chid Labour: Replicability of Recently Signed MOU Between ILO, UNICEF, and BGMEA in the Non-tradable Sector of Bangladesh”, Journal of Social Studies, vol.73, Centre for Social Studies.
Riedel, J. (1988), “The Demand for LDC Exports of Manufactures: Estimates From Hong Kong”, Economic Journal, vol.98, pp.138-48.
Riedel, J. and Athukorala, P.C. (1995), “Export Growth and the Terms of Trade: the Case of Curious Elasticities”, Chapter 3 in Currie D. and Vines, D. (eds.) North-South Linkages and International Macroeconomic Policy, Cambridge University Press, pp. 29-45.
Senhadji A. and Montenegro, C. (1998), “Time Series Analysis of Export Demand Equations: A Cross-Country Analysis”, IMF Working Paper, WP/98/149.
Stiglitz, J.E. and Charlton, A. (2006), “Aid for Trade” A Report Prepared for the Commonwealth Secretariat, London.
Subramanian, A. (2003), “Financing of Losses from Preference Erosion”. Research Department, The International Monetary Fund. (February). (WTO: WT/TF/COH/14)
W T O A N D R E G I O N A L T R A D E N E G O T I A T I O N O U T C O M E S : Q U A N T I T A T I V E
A S S E S S M E N T S O F P O T E N T I A L I M P L I C A T I O N S O N B A N G L A D E S H
244 UNCTAD (2001), “Duty and Quota Free Market Access for LDCs: An Analysis of Quad
Initiatives”, UNCTAD and Commonwealth Secretariat, London and Geneva UNCTAD (2004), “Services: Highlights of Consultative Meeting”, Consultative Meeting
on WTO July Framework; Trade, Globalization and Development Project Quarterly Newsletter of UNCTAD/DFID/MOC&I, New Delhi, India.
UNCTAD (2005), Handbook of Statistics. United Nations Conference on Trade and Development, Geneva.
UNCTAD (2006), The Least Developed Countries Report 2006, United Nations Conference on Trade and Development, Geneva.
UNDP (2005), “Report on Identification of Employment Oriented Export Sectors”, University of Maryland, JOBS Project, United Nations Development Program, Bangladesh.
van der Mensbrugghe, D. (2005), “The Doha Development Agenda and Preference Erosion: Modeling the Impacts,” World Bank, mimeo
van Meijl, J. and van Tongeren, F. (2001), “Multilateral trade liberalisation and developing countries: A North-South perspective on agriculture and processing sectors”. Rapport de l’Agricultural Economics Research Institute, The Hague.
Winters, L.A. and Chang, W (2000), “Regional Integration and Import Prices: An Empirical Investigation”, Journal of International Economics, vol.51, no.2, pp.363-78.
Winters, L.A., Walmsley, T., Wang, Z.K. and Grynberg, R. (2002), “Liberalizing Labour Mobility under the GATS, Commonwealth Secretariat, London
World Bank (2005), “Rice: Global Trade Protectionist Policies, and the Impact of Trade Liberalization”, Global Agricultural trade and Developing Countries. New York: The World Bank.
World Bank (2006), World Development Indicators CD ROM. World Bank, Washington DC
WTO (2001), Doha Ministerial Declaration, WTO, Geneva WTO (2004), “WTO Agriculture negotiations: The issues, and where we are now”,
Briefing Document, WTO, Geneva. WTO (2005), Hong Kong Ministerial Declaration, WTO, Geneva.
INDEX A accountability, 180, 181, 237 adjustment cost, 176, 177, 180 African Growth and Opportunity Act
(AGOA), 81 AfT, 26, 30, 175, 176, 177, 178, 179,
180, 237 agricultural capital income, 65 agricultural capital rental rate, 63, 65,
89 agricultural good, 47, 59, 64, 67, 232 agro-processing, 199, 200, 201 allocative efficiency, 60, 61, 62, 77, 86 anti-dumping duty, 174 Armington elasticity, 45 Asia-Pacific Trade Agreement, 224 B back-to-back L/Cs, 163 balance of payment, 31, 190, 195, 196,
197 Bangkok declaration, 144 Bangladesh dynamic model, 40, 46, 63,
68, 88 Bangladesh Overseas Employment
Services Limited, 217 Bangladesh Standards and Testing
Institution (BSTI), 218, 219 Bengal Initiatives on Multi-Sectoral
Technical and Economic Cooperation (BIMSTEC) , 25, 136, 137, 144, 145, 148, 235
BGMEA, 77, 228, 240, 243 bilateral FTAs, 137, 160 bilateral trade, 23, 24, 28, 32, 35, 136,
149, 150, 155 BIST-EC, 144 bound tariff rates, 25, 234
Bureau of Indian Standards (BIS), 225 Bureau of Manpower Employment and
Training, 217 Bureau of Manpower, 185, 217 business as usual (BAU), 39 C capital market, 31 capital outflow, 195 Caribbean Basin Initiative (CBI), 171,
227 Central Drugs Standard Control
Organisation, 226 CET, 38, 45 CGE model, 29, 31, 32, 37, 38, 44, 45,
49, 63, 64, 70, 77, 88, 92, 98, 233, 234
CGFNS, 186 cheap labour, 172, 202 child work, 228 Commercial Crop, 40, 41, 44, 91 Committee of Experts (COE), 142, 144 Common Market, 153 computable general equilibrium (CGE),
29, 31, 32, 37, 38, 44, 45, 48, 49, 63, 64, 70, 77, 88, 92, 98, 233, 234, 240
Constant Difference of Elasticity (CDE), 33
Constant Elasticity of Substitution (CES), 33, 34, 38, 45
consumer price, 65, 67, 68, 90, 92 cost, insurance and freight (CIF), 45 countervailing duties (CVDs), 227 CPI, 63, 65, 89 customs duty, 143 Customs Union, 153
W T O A N D R E G I O N A L T R A D E N E G O T I A T I O N O U T C O M E S : Q U A N T I T A T I V E
A S S E S S M E N T S O F P O T E N T I A L I M P L I C A T I O N S O N B A N G L A D E S H
246 D depreciated exchange rate, 174, 236 DFQF, 24, 25, 29, 76, 77, 81, 82, 83,
84, 85, 86, 87, 88, 89, 90, 93, 94, 95, 96, 97, 98, 219, 230, 233, 239
Doha Development Agenda, 150, 240, 242, 244
Doha Development Round, 177 Doha Ministerial Declaration, 54, 245 Doha Round, 175, 178, 237, 240, 242 domestic import prices, 64 domestic industry, 143 domestic market, 34, 196, 218, 223 domestic policy reforms, 63 domestic productive capacity, 180, 237 domestic regulation, 30, 184, 189, 194,
195, 196, 197 domestic supply, 220 domestic support measures, 49, 53, 54,
59, 62 domestic support, 49, 52, 53, 54, 55,
56, 58, 59, 62, 176 domestic value added, 170 duty free entry, 149 duty free import, 163 duty free market access, 81 duty free quota free market access, 82,
84, 85, 234, 170, 200, 212, 233 duty-free access, 163, 164 E economic cooperation, 137, 144, 145,
149, 150, 177 Economic Needs Test, 186, 229 economic policies, 38, 149 economic policy, 176 Economic Union, 153 economy of Bangladesh, 26, 29, 37, 48,
69, 77, 98, 137, 233, 234 effective market access, 180, 193, 237 endogenous variables, 38, 57 enforcement mechanism, 219 EU rules of origin, 170 European Union (EU), 163 EV, 58, 92
Everything-But-Arms (EBA), 77, 81, 223
exogenous variables, 57 export demand function, 38, 46 export earnings, 27, 89, 164, 200, 201,
210, 212, 213, 214, 215, 222, 223 export orientation ratio, 42 Export Promotion Bureau (EPB) , 165,
168, 169, 205, 212, 213, 214, 215, 216
export taxes, 57 F food security, 48, 54, 200 foreign aid, 192 foreign direct investment, 195 Free Trade Areas (FTA) , 137, 145,
149, 150, 153 G GATS, 185, 189, 191, 192, 194, 195,
196, 198, 238, 244 GATT, 138, 141, 147 GDP, 161 GDP, 55, 63, 64, 67, 68, 78, 89, 94, 95,
182, 184, 185, 192, 200, 213, 215, 217, 238
GEMPACK, 32, 242 Generalized System of Preference
(GSP), 76 geo-textiles, 214 global agricultural trade, 23, 24, 29, 48,
49, 66, 67, 69, 199 Global Trade Analysis Project (GTAP),
32, 69 global trade reform, 57 GOE, 145 government consumption, 33 government expenditure, 32 government of Bangladesh, 137 government procurement, 190 government saving, 39 gravity equation, 155 Green Revolution, 56 Group of Experts (GOE), 145

I N D E X
247GSP, 76, 81, 83, 97, 163, 170, 212,
223, 224 GSTP, 136 GTAP model, 29, 30, 31, 32, 33, 34, 45,
48, 49, 57, 58, 63, 68, 70, 77, 84, 85, 86, 88, 137, 156, 232, 233, 235
GTAP, 29, 30, 31, 32, 33, 34, 35, 36, 37, 45, 48, 49, 57, 58, 59, 60, 61, 63, 64, 67, 68, 70, 77, 84, 85, 86, 87, 88, 89, 137, 155, 156, 157, 158, 159, 232, 233, 234, 235, 241, 242
H handicrafts, 214, 215 Handmade Paper, 215 Harmonised System (HS), 95 Head-count poverty, 92 herbal medicine, 199, 208, 210 HIES, 65 high skilled workers, 186, 229 home textiles, 199 Hong Kong Ministerial Conference
(MC), 24, 95, 233 household expenditure, 32 Household Income and Expenditure
Survey (HIES), 37, 40 household income, 65 I ILO, 228, 243 immigration policies, 193 import penetration ratio, 42 income elasticity, 38, 220 income growth, 65, 183 indirect tax revenue, 39 Industrial Policy 2005, 199 informal trade, 149 Integrated Framework (IF), 176 Intellectual Property Rights, 150 International Telecommunication
Union (ITU), 194 International Trade Center (ITC) , 35,
176, 194 Inter-Regional Trade, 150 intra-regional imports, 150, 235 I-S effect, 60
J jute diversified products, 199, 213 jute goods, 213, 222, 223 jute laminates, 214 jute reinforced plastics, 214 Jute Textile, 40 K knitwear product, 163, 170 L Labour Force Survey, 40, 240 labour force, 39, 55, 183, 206, 215,
216, 218 labour laws, 150 labour market, 186, 193, 228 labour rights, 228 large farmers, 40, 42 LDCs, 24, 25, 26, 29, 30, 35, 37, 48,
59, 76, 77, 78, 79, 80, 81, 82, 83, 84, 85, 86, 87, 88, 96, 97, 98, 139, 140, 141, 142, 143, 146, 155, 160, 163, 175, 176, 177, 179, 183, 186, 187, 188, 189, 190, 191, 192, 193, 194, 195, 196, 197, 198, 210, 219, 223, 224, 227, 228, 229, 233, 234, 235, 237, 238, 239, 241, 243, 244
Leaf Baskets, 215 leather goods, 225 Leather, 36, 40, 41, 44, 91, 202, 158 Leontief function, 34, 38 LES function, 38, 39 letter of credit (L/Cs), 163 light engineering, 199, 206, 207 linear expenditure system (LES), 38, 39 livelihood, 54, 56 Livestock, 36, 40, 41, 44, 60, 201 M macroeconomic, 37, 48, 67, 94, 95, 163 manpower exports, 199, 216 marginal farmers, 40, 42 market access, 23, 24, 25, 26, 27, 29,
30, 47, 54, 77, 80, 81, 82, 84, 85, 86, 87, 95, 96, 97, 98, 163, 175, 176, 177, 180, 183, 184, 188, 193,
W T O A N D R E G I O N A L T R A D E N E G O T I A T I O N O U T C O M E S : Q U A N T I T A T I V E
A S S E S S M E N T S O F P O T E N T I A L I M P L I C A T I O N S O N B A N G L A D E S H
248 196, 197, 199, 200, 207, 217, 219, 223, 224, 227, 230, 232, 233, 234, 237, 238
market share, 87, 169, 171, 215, 223 merchandise exports, 51, 80, 81 MFN tariffs, 156 Migration, 229 Ministry of Commerce (MOC), 96 Most Favoured Nation (MFN), 76 , 84,
97, 156, 170, 189, 190, 192, 196 Multi Fibre Agreement (MFA), 35, 96 multilateral trade, 23, 25, 27, 28, 29,
32, 37, 46, 47, 136, 137, 154, 231 Mutual Recognition Agreements
(MRA), 186 N NAFTA, 171, 183 NAMA negotiations, 25, 83, 234 national incomes, 197 NIEs, 162, 221 nominal exchange rate, 39, 171 non-agricultural capital, 40, 42, 64, 66 non-agricultural household, 42 non-LDCs, 139, 140, 141 Non-tariff Barriers (NTBs), 25, 234 Non-tariff measures, 146 North American Free Trade Area
(NAFTA), 226 NTBs, 35, 225, 227 O OECD, 176, 177, 241, 243 P Paddy, 36, 40, 41, 44, 60 para-tariff barriers, 142, 224 para-tariff measures, 142 para-tariff, 142, 224 per capita income, 56 Petroleum Product, 40 physical infrastructural, 143 policy framework, 195 policy makers, 27, 149, 176, 194, 200,
228 policy reform, 38
political unrest, 173, 174, 236 population growth rate, 39, 216 poverty alleviation, 183 poverty reduction, 70, 95, 184, 232 poverty, 27, 29, 32, 37, 38, 39, 42, 46,
48, 64, 66, 67, 68, 69, 77, 88, 89, 92, 93, 94, 95, 98, 180, 181, 183, 184, 202, 232, 233, 234, 237
preferential import, 143 preferential market access, 178, 188,
223 Preferential Trading Arrangement
(PTA), 153 private consumption expenditures, 55 private sector, 144, 178, 206, 213 PRSP, 178 public sector, 178 Q quality control, 218 quota facilities, 77 quota-free, 24, 26, 79, 163, 164, 165,
166, 172, 173, 174, 223, 224, 226, 234, 236
R rate of interest, 163 raw jute, 222, 223 raw materials, 91, 163, 209, 215 readymade garments (RMG), 161 real exchange rates, 171 regional blocks, 138 regional cooperation, 138 regional household, 32, 34, 46, 58 regional income, 32 Regional Trade Negotiations, 23 regional trade, 23, 25, 137, 231 remittances, 182, 183, 184, 217 Reserve Bank of India, 225 Rice, 36, 40, 41, 44, 56, 60, 245 RMG export, 27, 30, 42, 87, 91, 161,
165, 170, 221, 234 RTAs, 136, 153, 154, 155 Rules of Origin (RoO), 77, 81, 82, 96,
224, 229 Rural households, 40
I N D E X
249S SAARC Ministerial Council, 138 SAARC Preferential Trading
Arrangement (SAPTA), 136 SAARC Secretariat, 142 Safeguard Measures, 139, 143 SAFTA Ministerial Council (SMC),
142, 144 sanitary and phyto-sanitary measures
(SPSM), 227 SAPTA Agreement, 138 semi-skilled labour, 27, 183, 192, 197,
238 Service Provider Visa (SPV), 193 skilled wage rate, 64, 68, 90, 92 Social Accounting Matrix (SAM), 37,
39, 40, 41, 42, 43, 44 South Asia, 25, 30, 35, 37, 48, 59, 60,
61, 87, 88, 97, 136, 137, 138, 150, 151, 152, 156, 157, 158, 159, 160, 170, 203, 208, 235, 241, 243
South Asian Association for Regional Cooperation (SAARC), 136, 137, 138, 142, 143, 144, 151, 152
South Asian Free Trade Area (SAFTA) , 25, 30, 136, 137, 138, 139, 141, 142, 143, 145, 155, 156, 160, 230, 231, 235
Special and Differential Treatment (S&DT), 192
SPV, 193 SSA, 227 stakeholders, 27, 28 structural adjustment programmes
(SAP), 56 Sub-Saharan Africa (SSA), 227 T tariff liberalisation, 64, 67, 145 Tariff rates, 42 tariffs, 24, 35, 54, 58, 59, 62, 64, 83,
84, 97, 98, 170, 139, 140, 143, 148, 153, 155, 156, 233, 223, 227
technical assistance, 139, 143 technical assistance, 176, 179
technical assistance, 184, 188, 189, 194, 195, 197
technical assistance, 235 technical assistance, 30 technical barriers (TBT), 227 terms of trade, 48, 60, 61, 62, 77, 86,
155, 160, 227 textile and clothing (T&C), 95 TNC, 148 TOT, 60 Trade and Investment Framework
Agreement (TIFA), 150 trade liberalisation, 24, 26, 28, 30, 48,
49, 57, 59, 69, 79, 138, 139, 154, 159, 160, 175, 176, 177, 179, 184, 186, 187, 195, 197, 219, 228, 230, 232, 235, 239, 241, 244
trade policy, 27, 31, 46, 163, 218, 221 trade reform, 31, 57 trade reform U unbound tariff rates unbound tariff rates, 25, 234 UNCTAD, 76, 77, 78, 79, 80, 81, 176,
185, 194, 243, 244 UNDP, 176, 201, 202, 204, 205, 206,
207, 209, 211, 244 UNICEF, 228, 243 unskilled labour, 40, 41, 42, 65, 92, 94 urban household, 41, 43, 64, 65, 67, 94 Uruguay Round Agreement, 35, 54,
164 US market, 77, 97, 98, 166, 169, 170,
173, 221, 233, 236 W wage rate, 63, 64, 65, 67, 68, 89, 90,
92, 94 World Bank, 56, 176, 177, 184, 194,
240, 241, 242, 243, 244, 245 World Trade Organisation (WTO) , 23,
24, 26, 27, 28, 29, 35, 47, 48, 50, 51, 52, 53, 54, 55, 76, 82, 83, 97, 136, 150, 164, 166, 174, 175, 176, 177, 178, 182, 183, 186, 187, 188,
W T O A N D R E G I O N A L T R A D E N E G O T I A T I O N O U T C O M E S : Q U A N T I T A T I V E
A S S E S S M E N T S O F P O T E N T I A L I M P L I C A T I O N S O N B A N G L A D E S H
250 189, 194, 197, 199, 210, 219, 230, 231, 232, 233, 237, 238, 239, 240, 241, 243, 244, 245
Woven ready-made-garment (RMG), 42
WTO Agreement, 27, 47, 177, 232, 240
Z zero optimal tariffs, 45 zero profit, 33, 34 zero tariff facilities, 81, 83 zero tariff market access, 83 zero-tariff, 223, 224