qcl-14-v3 pareto diagram_banasthali university_ankita gupta
TRANSCRIPT

Ankita GuptaAnkita GuptaAnkita PandeyAnkita Pandey
Akanksha RajputAkanksha Rajput
Presented by
Students of Banasthali University
B.Tech II year
PARETO DIAGRAM FOR BUNKING
LECTURES

INTRODUCTION TO PARETO CHART
A Pareto chart is a formal analysis technique,named after Vilfredo Pareto,that combines a column chart and a line graph. The Pareto principle states that, for many events, roughly 80% of the effects come from 20% of the causes. In this example, we will see that 80% of the complaints come from 2 out of 10 (20%) complaint types.

COMPONENTS OF COMPONENTS OF PARETO DIAGRAMPARETO DIAGRAM
Individual values are represented by bars.
Cumulative total is represented by the line .
Left vertical axis gives frequency of occurrence (or other important unit of measure).
Right vertical axis gives cumulative percentage of the total number of occurrences (or total of the particular unit of measure).

We conducted a survey on 369 students asking their reasons for bunking lectures…

REASONS COUNT
Ineffective teaching 152
Enjoying college life 89
Irresponsible/casual attitude 59
Preparation for co-curricular activities
33
Relying on lecture slides/notes 18
11
I-know-it-all attitude 7
And the responses were :
Boredom from monotonous routine
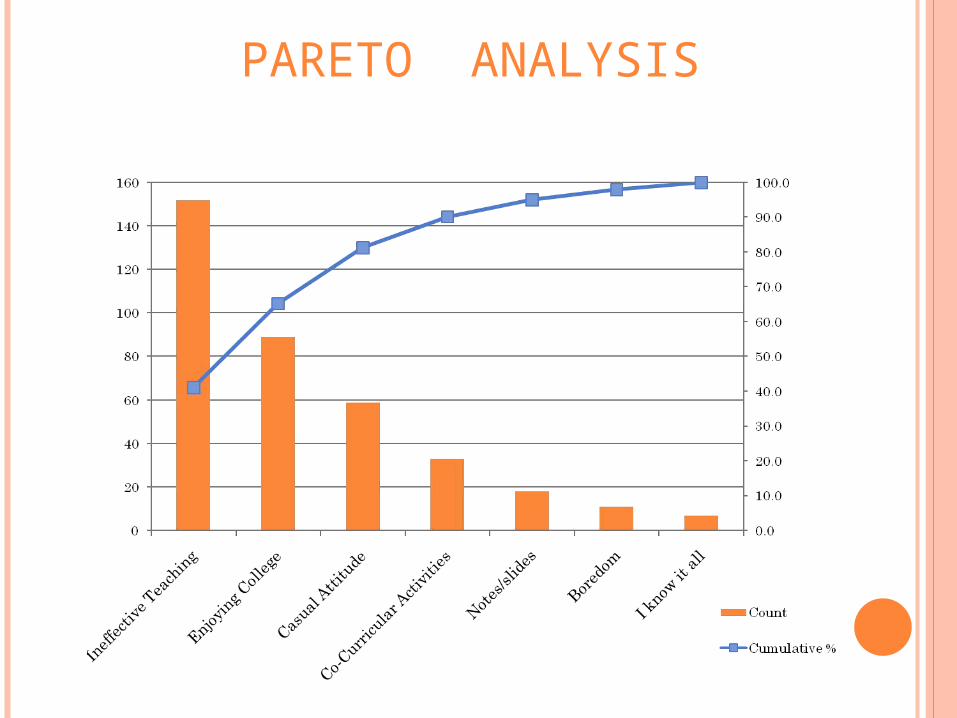
PARETO ANALYSIS

In accordance with the Pareto principle following reasons account for 80% of the problem :
o Ineffective teachingoEnjoying college lifeo Irresponsible / casual attitude

Lack of classroom management
Disinterested students due to passive teaching Lack of professionalism (late arrival)
INEFFECTIVE TEACHING

ENJOYING COLLEGE
LIFE

Classes….who
cares!!!
IRRESPONSIBLE/CASUAL BEHAVIOUR
1.The team learned the importance of Pareto Analysis when many possible courses of action are competing for attention.
2.The team learned via Pareto diagram that
• focusing efforts on the ‘vital few’ causes is usually a better use of valuable resources.
LESSONS LEARNED BY THE TEAM

3. The team also realized that this technique is limited by its exclusion of possibly important problems which may be small initially, but which grow with time.
4. Most importantly the lesson of coordination & cooperation among team members was learnt.

THANK YOU