volunteermatch bpn webinar: cecp giving in numbers with alison rose july 13, 2011
TRANSCRIPT

Giving In Numbers: Emerging Trends in Corporate Philanthropywith Alison Rose, Manager, CECPJuly 13, 2011

Type your questions into the question box on the right panel.
We will pose them to the speaker for everyone to hear.
Open Q&A with the Audience
Follow on Twitter: @VM_Solutions and @CECPTweets with #CECPData
Audience Poll Question
Who is joining us today?
Corporate
Nonprofit
Academia
Philanthropy/Grant Maker (Non-Corporate)
Other
1
2
3
4
5

CECP Background
Who We AreThe only international forum of business CEOs and Chairpersons with an agenda exclusively focused on corporate philanthropy
What We Believe• Philanthropy is a long-term investment• Executive leadership is essential• Corporations have unique resources
What We Do• Represent the CEO point of view on philanthropy• Bring business discipline to corporate philanthropy• Set the standards for philanthropy measurement and
practice
Our MissionTo increase the level and quality of corporate philanthropy.
Who is EngagedOver 175 corporate CEOs and Chairpersons
“I helped to start CECP with the belief
that corporate America could be a
force for good in society.”
- Paul Newman
5
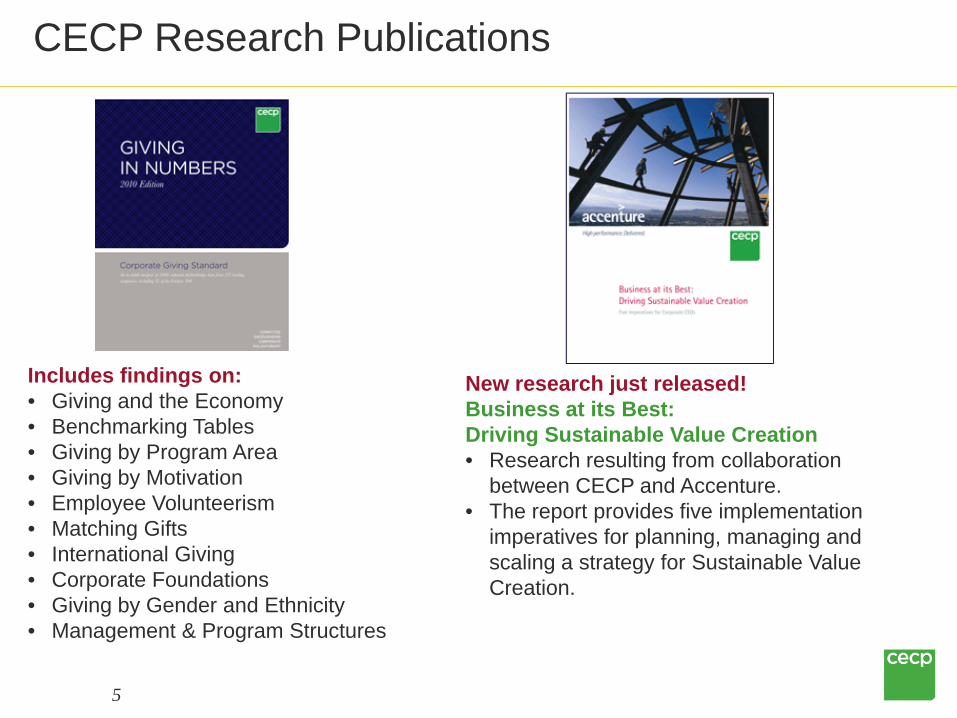
CECP Research Publications
Includes findings on: • Giving and the Economy• Benchmarking Tables• Giving by Program Area• Giving by Motivation• Employee Volunteerism• Matching Gifts• International Giving• Corporate Foundations• Giving by Gender and Ethnicity• Management & Program Structures
New research just released! Business at its Best: Driving Sustainable Value Creation • Research resulting from collaboration
between CECP and Accenture.• The report provides five implementation
imperatives for planning, managing and scaling a strategy for Sustainable Value Creation.
Agenda for 7/13/2011
6
I. Corporate Financial Performance
II. Trends in Giving• Giving at the company level, giving trends across companies• Reasons for changes in giving• The effect on giving types
III. Additional Findings• Giving types, giving motivations• Focus areas, international giving• Matching gifts, employee volunteerism• Staffing, management & program costs
IV. Giving Projections & Questions
7
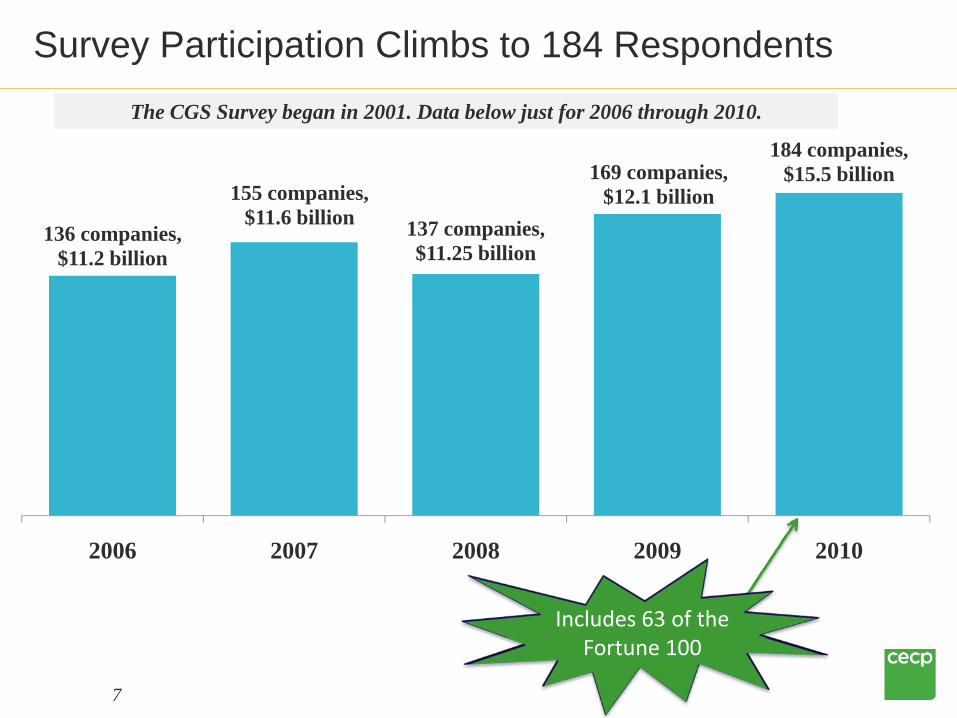
Survey Participation Climbs to 184 Respondents
136 companies, $11.2 billion
155 companies, $11.6 billion 137 companies,
$11.25 billion
169 companies, $12.1 billion
184 companies, $15.5 billion
2006 2007 2008 2009 2010
Includes 63 of the Fortune 100
The CGS Survey began in 2001. Data below just for 2006 through 2010.
8
CECP Data Analysis Terminology
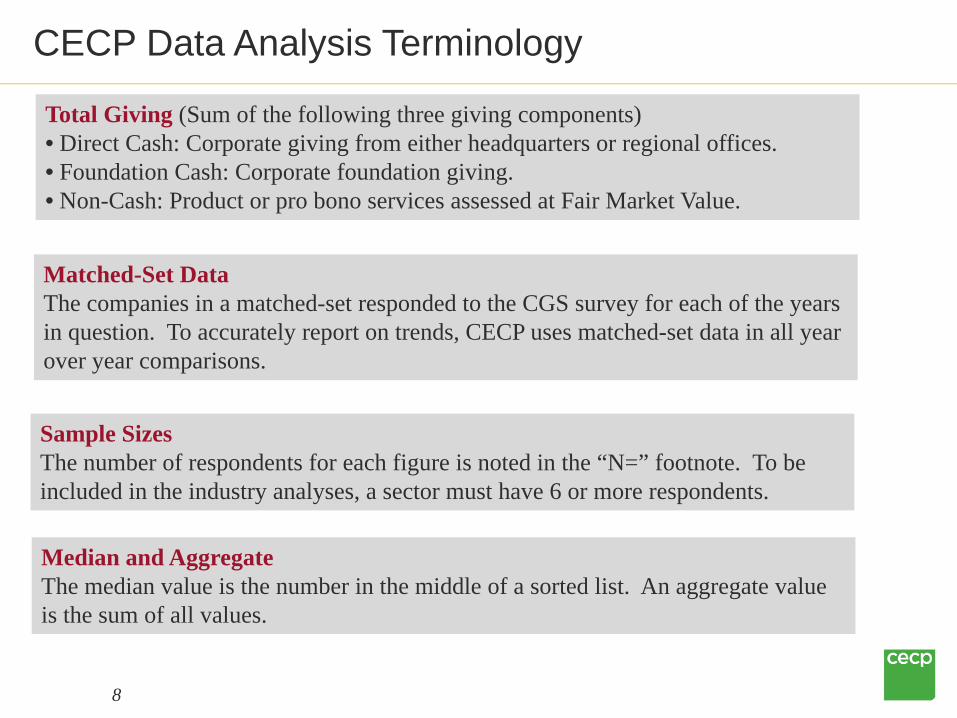
Total Giving (Sum of the following three giving components)• Direct Cash: Corporate giving from either headquarters or regional offices.• Foundation Cash: Corporate foundation giving.• Non-Cash: Product or pro bono services assessed at Fair Market Value.
Matched-Set DataThe companies in a matched-set responded to the CGS survey for each of the years in question. To accurately report on trends, CECP uses matched-set data in all year over year comparisons.
Sample SizesThe number of respondents for each figure is noted in the “N=” footnote. To be included in the industry analyses, a sector must have 6 or more respondents.
Median and AggregateThe median value is the number in the middle of a sorted list. An aggregate value is the sum of all values.
9
Consumer Discretionary
Consumer Staples
Energy
FinancialsHealth Care
Industrials
Information Technology
Materials
Telecom Services
Utilities
N=28
N=16
N=12
N=9
N=15
N=9
N=11
N=4
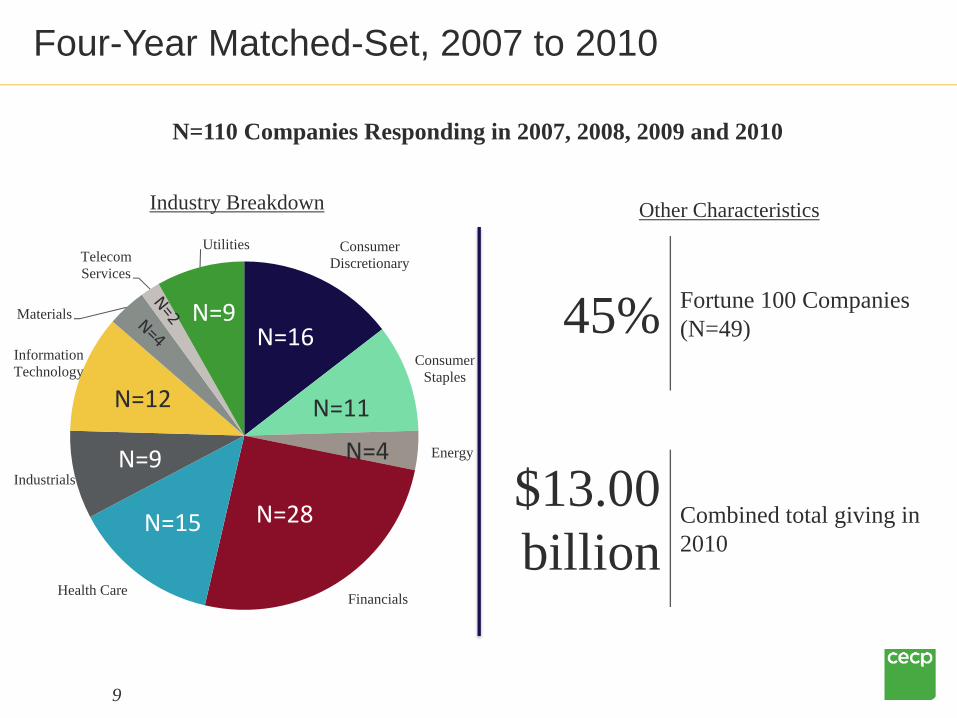
N=110 Companies Responding in 2007, 2008, 2009 and 2010
Four-Year Matched-Set, 2007 to 2010
Industry Breakdown Other Characteristics
45% Fortune 100 Companies (N=49)
$13.00 billion
Combined total giving in 2010
I. Corporate Financial Performance
10
Each year, giving officers report that their giving levels are impacted by the company’s financial performance. In 2010, corporate profits rose.
How will the trends in corporate financial performance impact stakeholder expectations for
corporate giving?

11
Do you think the economy is:
Fully recovered.
Making progress, but not there yet.
Heading for a double-dip.
1
2
3
Poll Question
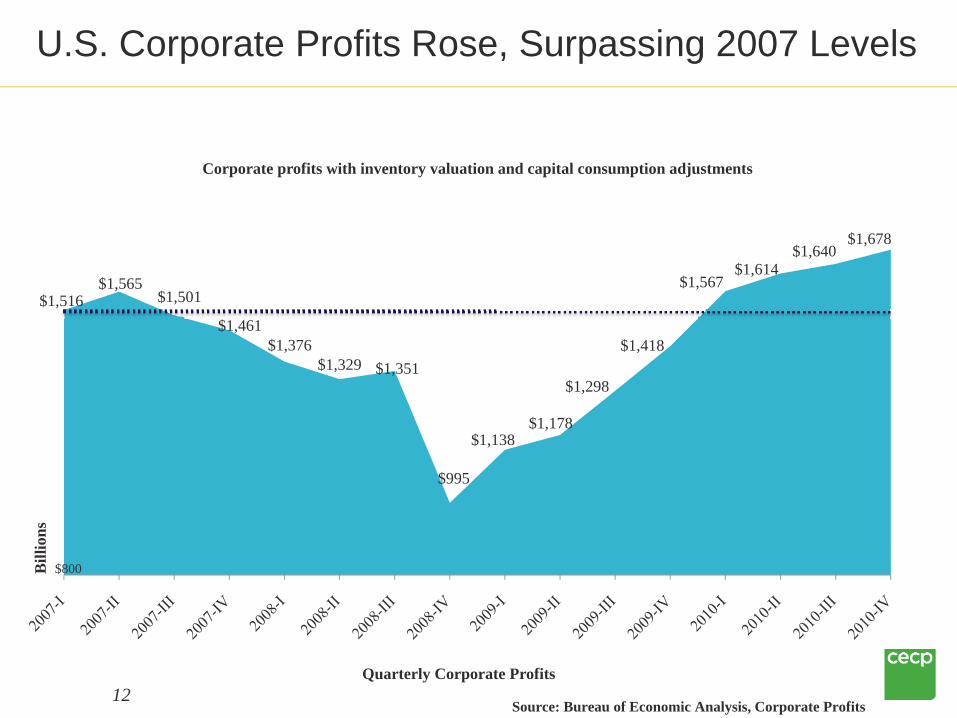
$1,516$1,565
$1,501
$1,461$1,376
$1,329 $1,351
$995
$1,138$1,178
$1,298
$1,418
$1,567$1,614
$1,640$1,678
Corporate profits with inventory valuation and capital consumption adjustments
U.S. Corporate Profits Rose, Surpassing 2007 Levels
12Source: Bureau of Economic Analysis, Corporate Profits
Bill
ions
$800
Quarterly Corporate Profits
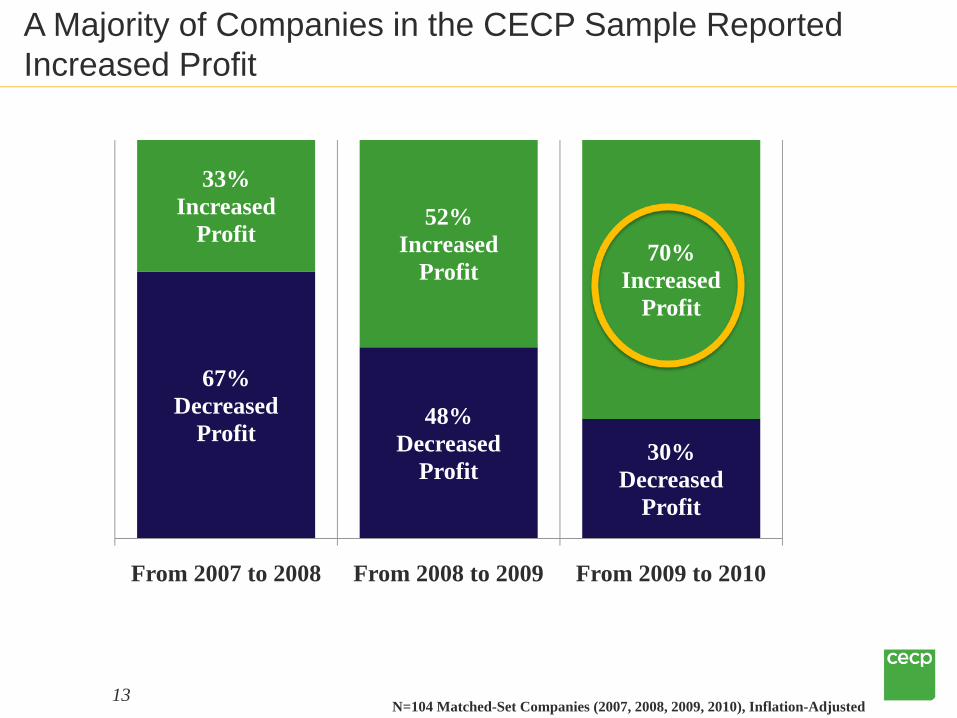
A Majority of Companies in the CECP Sample Reported Increased Profit
13N=104 Matched-Set Companies (2007, 2008, 2009, 2010), Inflation-Adjusted
67% Decreased
Profit48%
DecreasedProfit
30% Decreased
Profit
33% Increased
Profit52%
Increased Profit
70% Increased
Profit
From 2007 to 2008 From 2008 to 2009 From 2009 to 2010
14
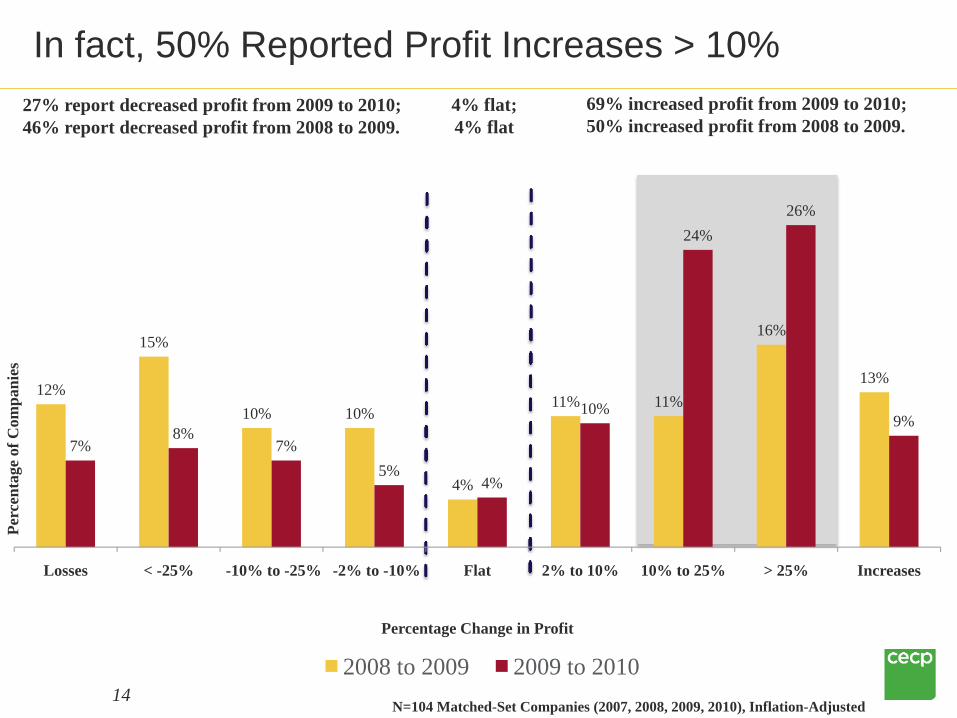
In fact, 50% Reported Profit Increases > 10%
N=104 Matched-Set Companies (2007, 2008, 2009, 2010), Inflation-Adjusted
27% report decreased profit from 2009 to 2010;46% report decreased profit from 2008 to 2009.
69% increased profit from 2009 to 2010;50% increased profit from 2008 to 2009.
4% flat; 4% flat
12%
15%
10% 10%
4%
11% 11%
16%
13%
7%8%
7%5%
4%
10%
24%26%
9%
Losses < -25% -10% to -25% -2% to -10% Flat 2% to 10% 10% to 25% > 25% Increases
Perc
enta
ge o
f Com
pani
es
Percentage Change in Profit
2008 to 2009 2009 to 2010
15
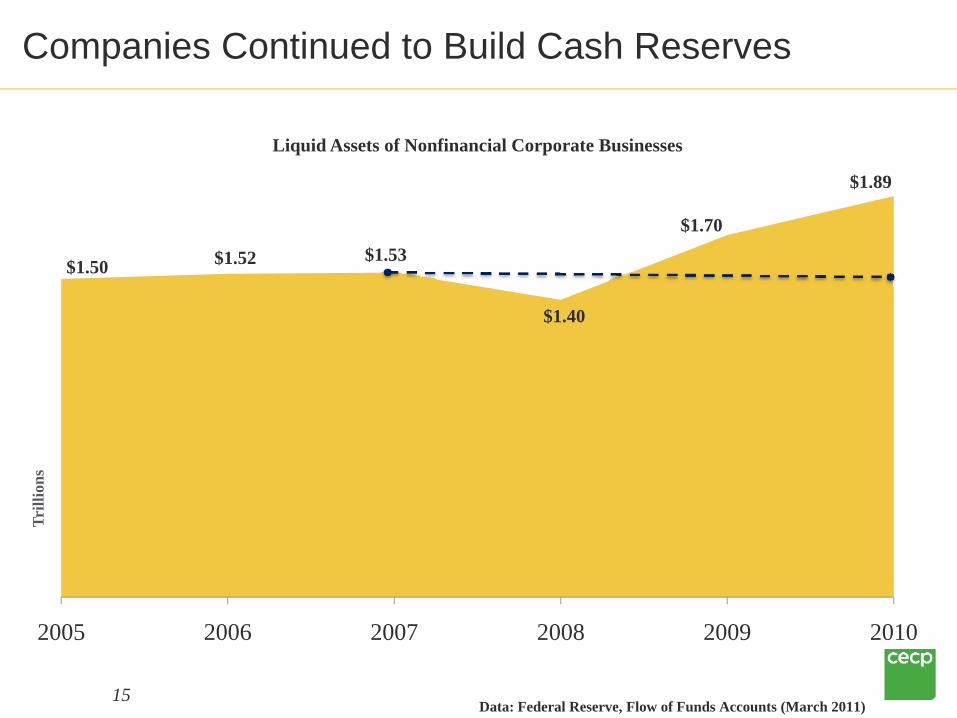
Companies Continued to Build Cash Reserves
Data: Federal Reserve, Flow of Funds Accounts (March 2011)
$1.50 $1.52 $1.53
$1.40
$1.70
$1.89
2005 2006 2007 2008 2009 2010
Trill
ions
Liquid Assets of Nonfinancial Corporate Businesses

16
Hiring Remains Slow
6%
13%
32%
25%
11%
8%
5%
2%
6%
27% 27%26%
7%
5%
< -25% -10% to -25% -10% to -2% Flat 2% to 10% 10% to 25% > 25%
08 to 09 09 to 10N=110 Matched-Set Companies (2007, 2008, 2009, 2010), Inflation-Adjusted
35% decreased workforce from 2009 to 2010;51% decreased workforce from 2008 to 2009.
38% increased workforce from 2009 to 2010;24% increased workforce from 2008 to 2009.
27% flat; 25% flat
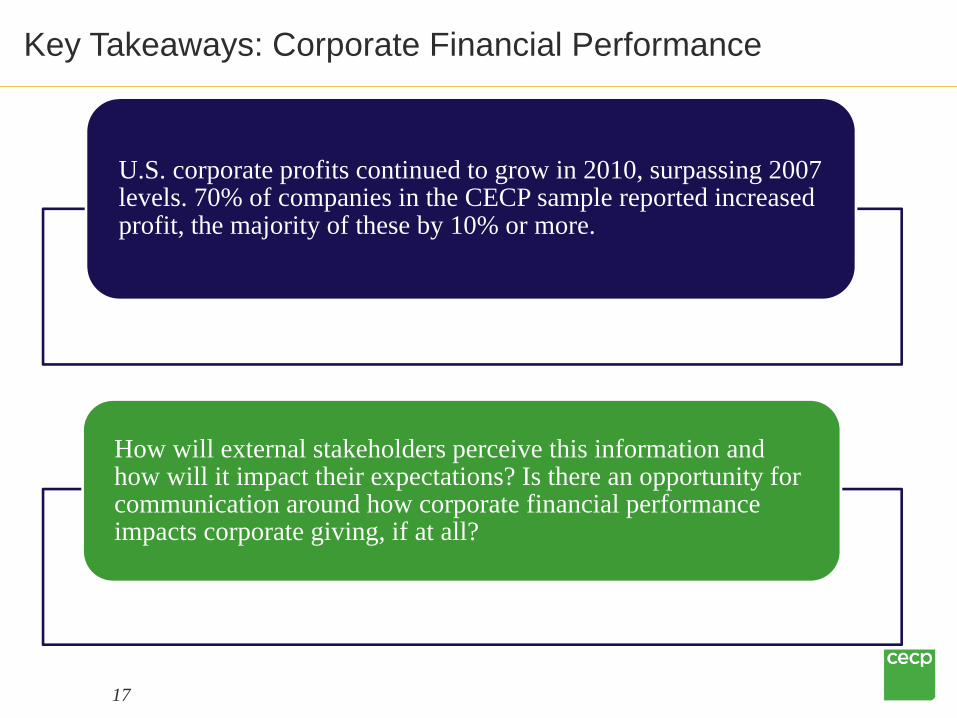
Key Takeaways: Corporate Financial Performance
17
U.S. corporate profits continued to grow in 2010, surpassing 2007 levels. 70% of companies in the CECP sample reported increased profit, the majority of these by 10% or more.
How will external stakeholders perceive this information and how will it impact their expectations? Is there an opportunity for communication around how corporate financial performance impacts corporate giving, if at all?
18
Do you think most companies increased or decreased giving from 2009 to 2010?
Most companies increased giving.
Most companies decreased giving.
Most companies stayed flat.
1
2
Audience Poll Question
3
II. Trends in Giving
19
What happened to corporate giving?
A majority of companies reported higher giving in 2010 than in 2009. In fact, 53% of companies gave
more in 2010 than they had before the economic downturn took hold back in 2007.
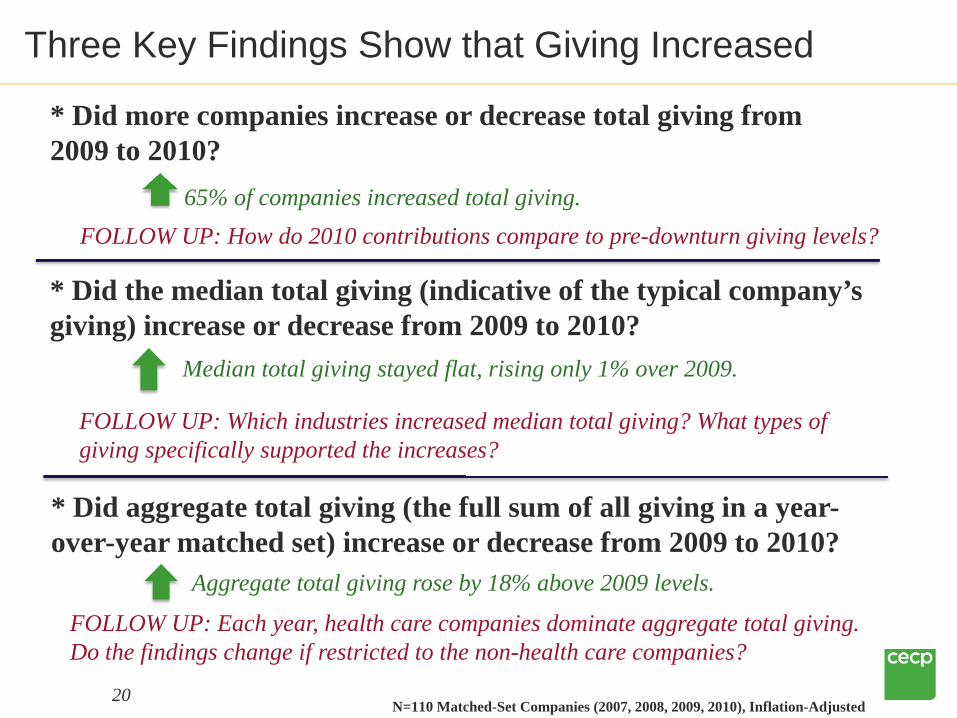
Three Key Findings Show that Giving Increased
20N=110 Matched-Set Companies (2007, 2008, 2009, 2010), Inflation-Adjusted
* Did more companies increase or decrease total giving from 2009 to 2010?
* Did the median total giving (indicative of the typical company’s giving) increase or decrease from 2009 to 2010?
* Did aggregate total giving (the full sum of all giving in a year-over-year matched set) increase or decrease from 2009 to 2010?
65% of companies increased total giving.
Median total giving stayed flat, rising only 1% over 2009.
Aggregate total giving rose by 18% above 2009 levels.
FOLLOW UP: How do 2010 contributions compare to pre-downturn giving levels?
FOLLOW UP: Which industries increased median total giving? What types of giving specifically supported the increases?
FOLLOW UP: Each year, health care companies dominate aggregate total giving. Do the findings change if restricted to the non-health care companies?

Majority of Companies Increased Giving from ‘09 to ‘10
21N=110 Matched-Set Companies (2007, 2008, 2009, 2010), Inflation-Adjusted
46% of companies decreased
giving
60% of companies decreased
giving35% of
companies decreased
giving
54% of companies increased
giving
40% of companies increased
giving65% of
companies increased
giving
From 2007 to 2008 From 2008 to 2009 From 2009 to 2010
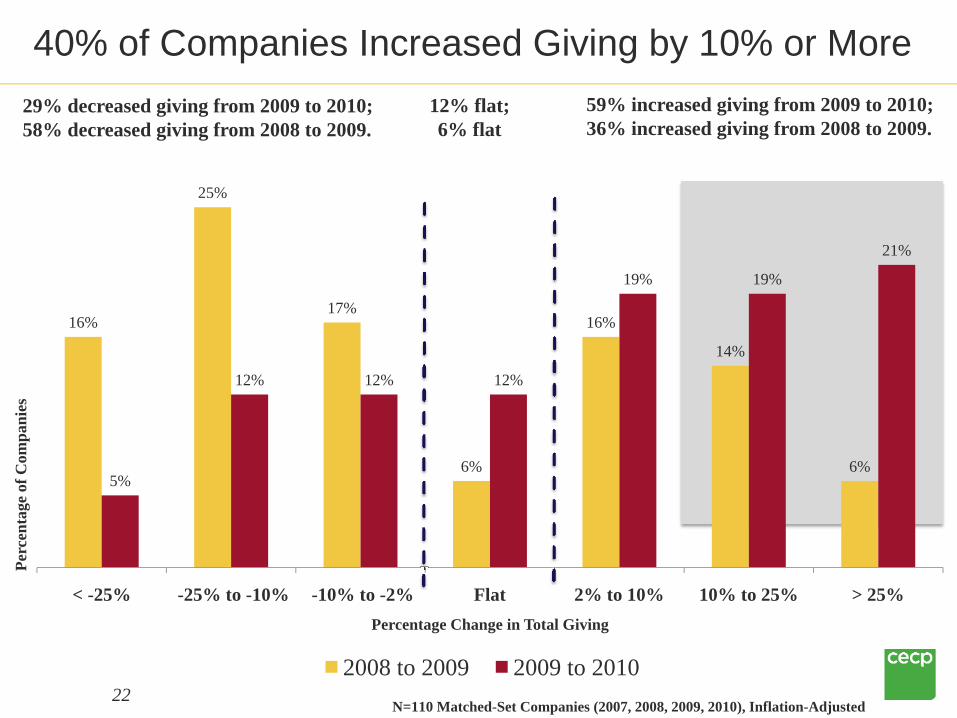
16%
25%
17%
6%
16%
14%
6%5%
12% 12% 12%
19% 19%
21%
< -25% -25% to -10% -10% to -2% Flat 2% to 10% 10% to 25% > 25%
Perc
enta
ge o
f Com
pani
es
Percentage Change in Total Giving
2008 to 2009 2009 to 201022
40% of Companies Increased Giving by 10% or More
N=110 Matched-Set Companies (2007, 2008, 2009, 2010), Inflation-Adjusted
29% decreased giving from 2009 to 2010;58% decreased giving from 2008 to 2009.
59% increased giving from 2009 to 2010;36% increased giving from 2008 to 2009.
12% flat; 6% flat
23
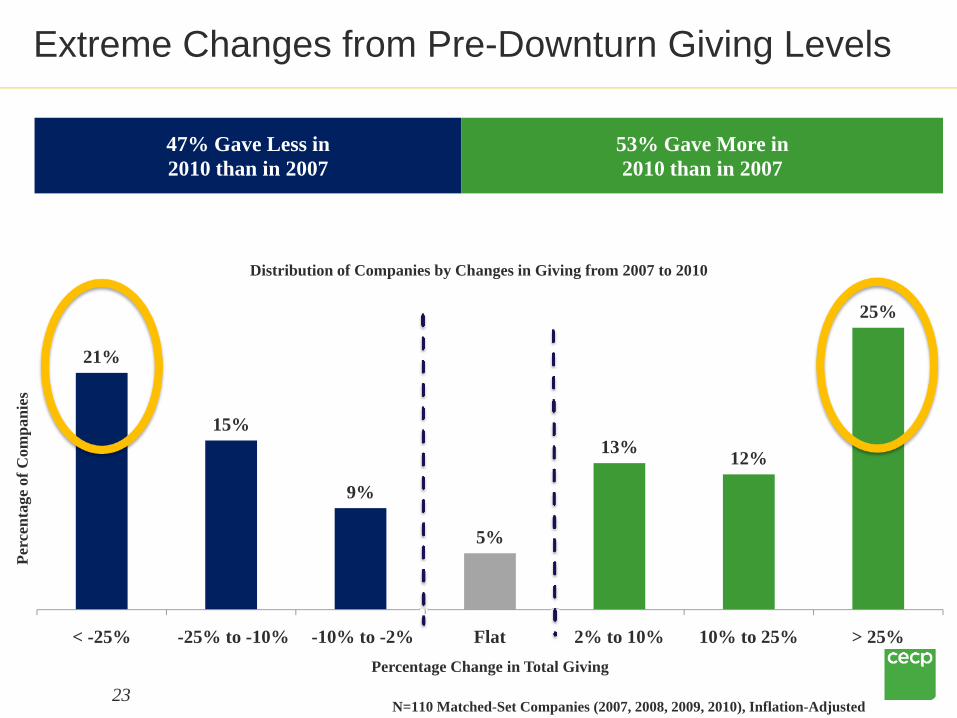
Extreme Changes from Pre-Downturn Giving Levels
N=110 Matched-Set Companies (2007, 2008, 2009, 2010), Inflation-Adjusted
21%
15%
9%
5%
13% 12%
25%
< -25% -25% to -10% -10% to -2% Flat 2% to 10% 10% to 25% > 25%
Perc
enta
ge o
f Com
pani
es
Percentage Change in Total Giving
47% Gave Less in 2010 than in 2007
53% Gave More in 2010 than in 2007
Distribution of Companies by Changes in Giving from 2007 to 2010

24
Median Total Giving Remains Unchanged
N=110 Matched-Set Companies (2007, 2008, 2009, 2010), Inflation-AdjustedMaterials, Telecom and Energy not separated due to small sample sizes
Year 2007 2008 2009 2010Median Total
Giving (N=110) $29.04 million $28.38 million $24.66 million $24.88 million-2% -13% +1%
$35.
51
$78.
29
$30.
20
$37.
74
$21.
47
$17.
88
$11.
40 $2
7.09
$60.
86
$31.
18
$52.
78
$24.
91
$24.
99
$11.
14 $2
3.14
$63.
68
$25.
34
$45.
79
$19.
27
$23.
12
$10.
77 $2
4.42
$57.
48
$25.
76
$54.
79
$22.
63
$26.
11
$10.
78
Consumer Discretionary
(N=16)
Consumer Staples(N=11)
Financials(N=28)
Health Care(N=15)
Industrials(N=9)
Information Technology
(N=12)
Utilities(N=9)
Mill
ions
2007 2008 2009 2010
Median Total Giving by Industry
25
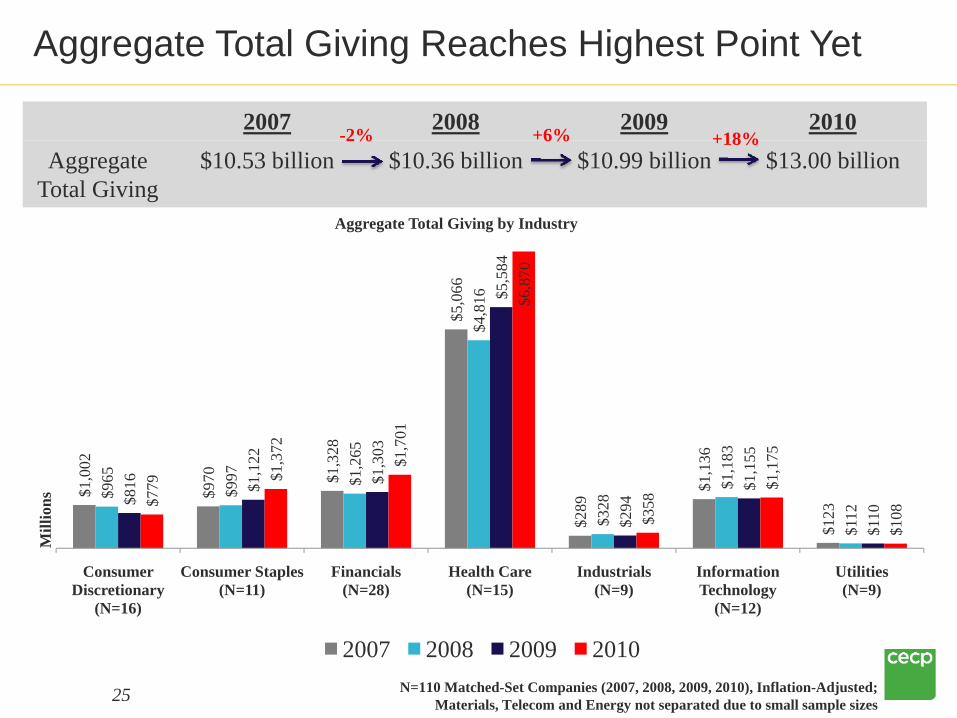
Aggregate Total Giving Reaches Highest Point Yet
N=110 Matched-Set Companies (2007, 2008, 2009, 2010), Inflation-Adjusted; Materials, Telecom and Energy not separated due to small sample sizes
2007 2008 2009 2010Aggregate
Total Giving$10.53 billion $10.36 billion $10.99 billion $13.00 billion
-2% +6% +18%
Aggregate Total Giving by Industry
$1,0
02
$970 $1
,328
$5,0
66
$289
$1,1
36
$123
$965
$997 $1
,265
$4,8
16
$328
$1,1
83
$112
$816 $1
,122
$1,3
03
$5,5
84
$294
$1,1
55
$110
$779 $1
,372
$1,7
01
$6,8
70
$358
$1,1
75
$108
Consumer Discretionary
(N=16)
Consumer Staples (N=11)
Financials (N=28)
Health Care (N=15)
Industrials (N=9)
Information Technology
(N=12)
Utilities (N=9)
Mill
ions
2007 2008 2009 2010
26
Aggregate Increase Attributed to a Few Companies
10 companies combined to give $2.02 billion more in 2010 than they did in 2009.
Reasons for these dramatic increases include: • Huge increases in donations to Patient Assistance Programs (PAPs). • Substantial funding increases for major signature programs.• Above-budget funding for the devastating disasters in 2010.• Residual impact of mergers causing contributions to far exceed historical levels.
4 of the 10 were pharmaceutical companies, combining to give $1.21 billion more in 2010 than they did in 2009.

27
Health Care Accounts for 46%-53% of Total Giving
Non-Health Care52%
Non-Health Care54%
Non-Health Care49%
Non-Health Care47%
Health Care48%
Health Care46%
Health Care51%
Health Care53%
2007 2008 2009 2010
Non-Health Care Health Care
$10.53 billion $10.36 billion$10.99 billion
$13.00 billion
N=110 Matched-Set Companies (2007, 2008, 2009, 2010), Inflation-Adjusted
Aggregate Total Giving
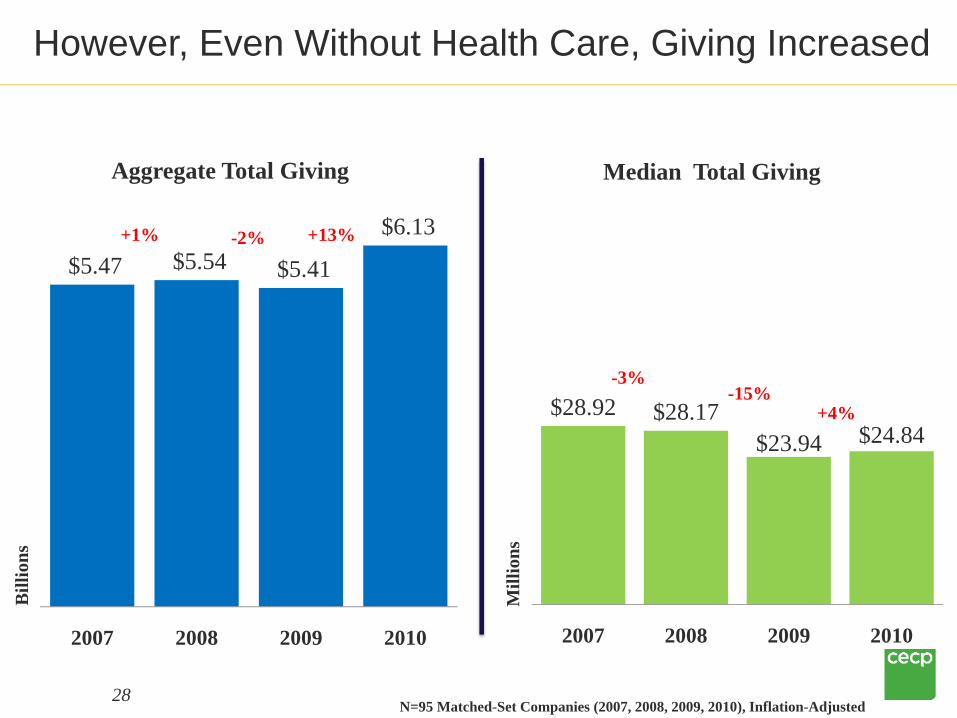
28
However, Even Without Health Care, Giving Increased
$5.47 $5.54 $5.41
$6.13
2007 2008 2009 2010
Bill
ions
+13%+1% -2%
N=95 Matched-Set Companies (2007, 2008, 2009, 2010), Inflation-Adjusted
$28.92 $28.17$23.94 $24.84
2007 2008 2009 2010
Mill
ions
+4%
-3%-15%
Aggregate Total Giving Median Total Giving

29
Direct Cash was a Key Factor in 2010 Giving Increases
N=110 Matched-Set Companies (2007, 2008, 2009, 2010), Inflation-Adjusted
2007 to 2008 2008 to 2009 2009 to 2010
Increased Giving
Decreased
Giving
Changes by Giving Types, Medians, 2007 to 2010
-13%
-4% -5%
7%
0%
29%
-14%-10%
-19%
4%
-2%
26%
-2% -3%
-22%
22%
6% 7%
Direct Cash Foundation Cash Non-Cash
30
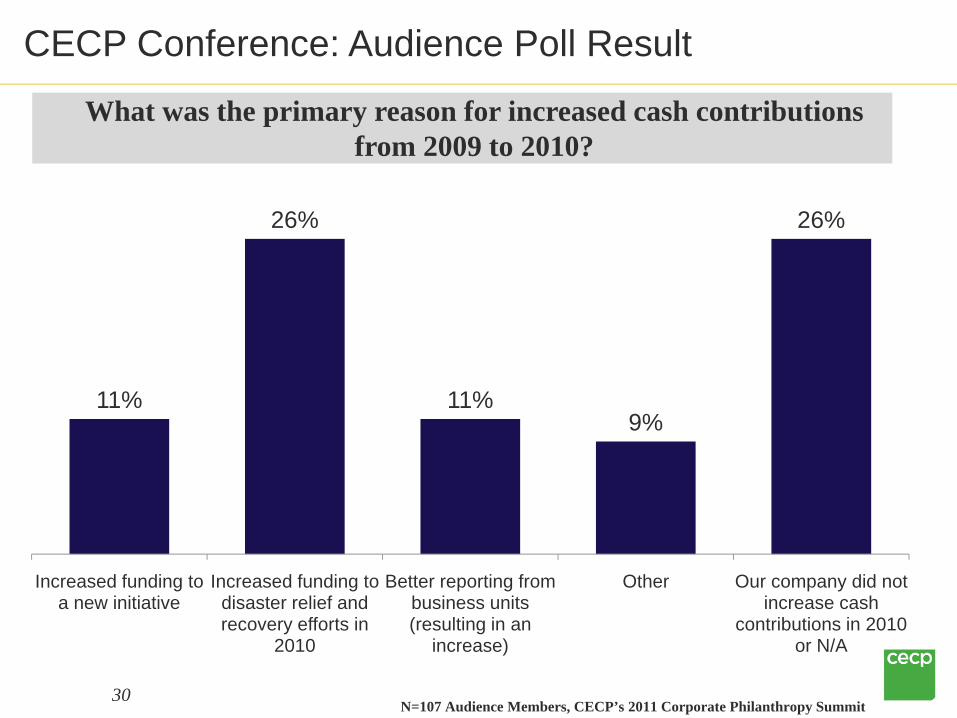
11%
26%
11%9%
26%
Increased funding to a new initiative
Increased funding to disaster relief and recovery efforts in
2010
Better reporting from business units (resulting in an
increase)
Other Our company did not increase cash
contributions in 2010 or N/A
What was the primary reason for increased cash contributions from 2009 to 2010?
CECP Conference: Audience Poll Result
N=107 Audience Members, CECP’s 2011 Corporate Philanthropy Summit

Increased or
DecreasedGiving
The 2010 economy (increasedbudgets due to improved financial performance OR reduced funding due to continued economic uncertainty)
One time donations of land or property.
Matching gift contributionfluctuations based on employee participation, program policy changes, and employee eligibility.
Inception or conclusion of multi-year grants.
31
Giving Officers Cite Reasons for Changes in Giving
2010 Annual ReasonsIncreased
GivingMore medicine to those in need
through PAPs or signature programs.Increased giving to fund 2010
disaster relief and rebuilding efforts.Mergers or acquisitions that
resulted in giving budgets that exceeded historical contributions.
New signature programs launched.Improved administration of grants.Increased giving to strategic focus areas.
32
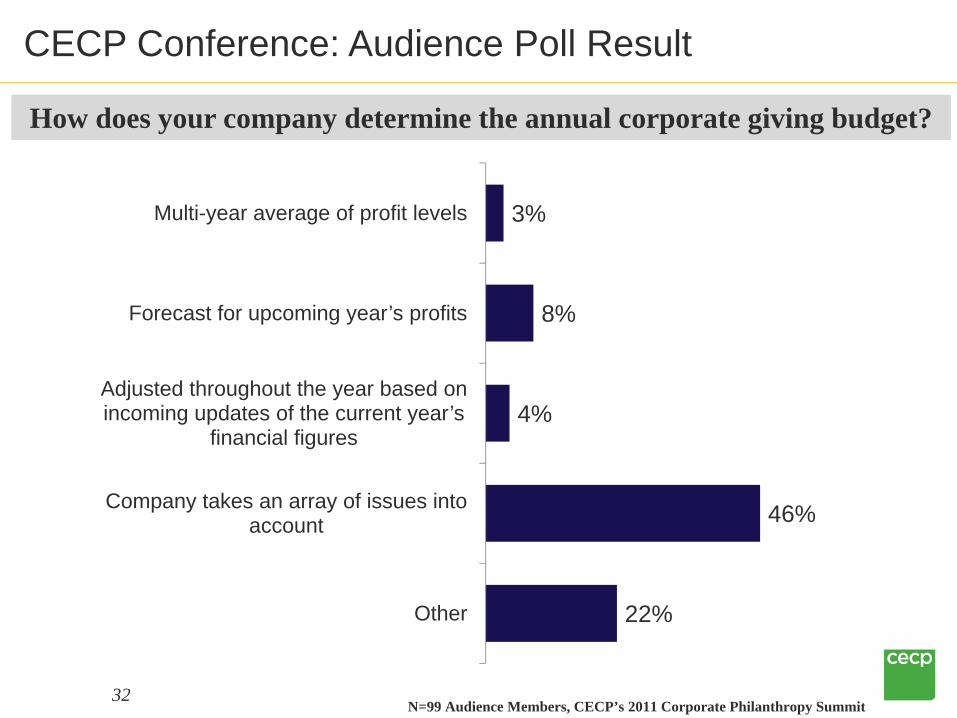
How does your company determine the annual corporate giving budget?
3%
8%
4%
46%
22%
Multi-year average of profit levels
Forecast for upcoming year’s profits
Adjusted throughout the year based on incoming updates of the current year’s
financial figures
Company takes an array of issues into account
Other
CECP Conference: Audience Poll Result
N=99 Audience Members, CECP’s 2011 Corporate Philanthropy Summit
33
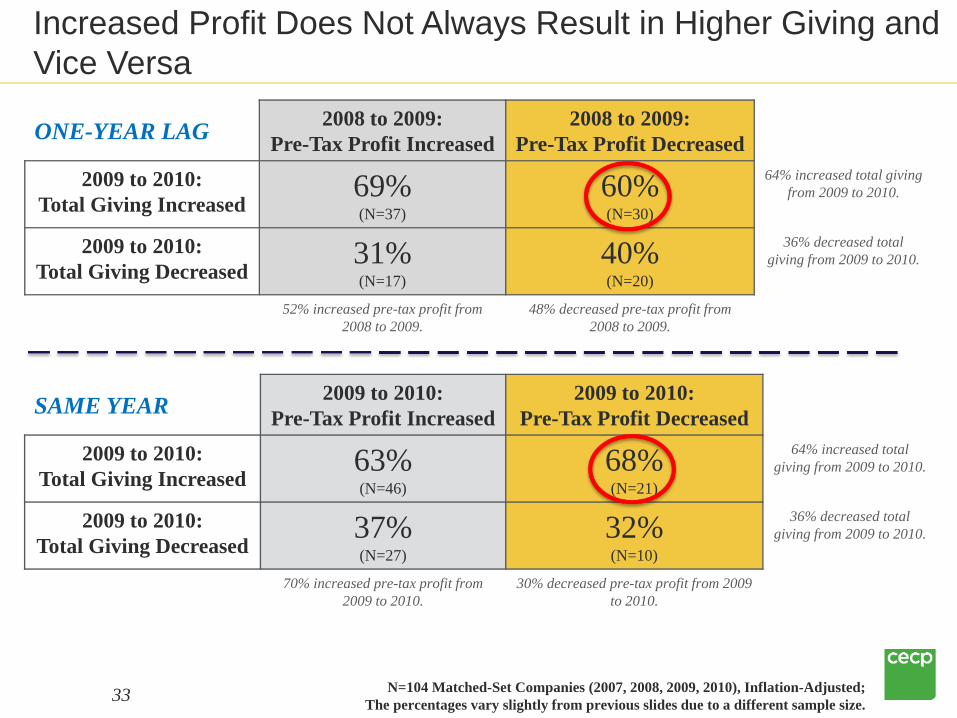
Increased Profit Does Not Always Result in Higher Giving and Vice Versa
N=104 Matched-Set Companies (2007, 2008, 2009, 2010), Inflation-Adjusted;The percentages vary slightly from previous slides due to a different sample size.
ONE-YEAR LAG 2008 to 2009: Pre-Tax Profit Increased
2008 to 2009: Pre-Tax Profit Decreased
2009 to 2010: Total Giving Increased
69% (N=37)
60% (N=30)
64% increased total giving from 2009 to 2010.
2009 to 2010: Total Giving Decreased
31% (N=17)
40%(N=20)
36% decreased total giving from 2009 to 2010.
52% increased pre-tax profit from 2008 to 2009.
48% decreased pre-tax profit from 2008 to 2009.
SAME YEAR 2009 to 2010: Pre-Tax Profit Increased
2009 to 2010: Pre-Tax Profit Decreased
2009 to 2010: Total Giving Increased
63% (N=46)
68% (N=21)
64% increased total giving from 2009 to 2010.
2009 to 2010: Total Giving Decreased
37%(N=27)
32% (N=10)
36% decreased total giving from 2009 to 2010.
70% increased pre-tax profit from 2009 to 2010.
30% decreased pre-tax profit from 2009 to 2010.
34
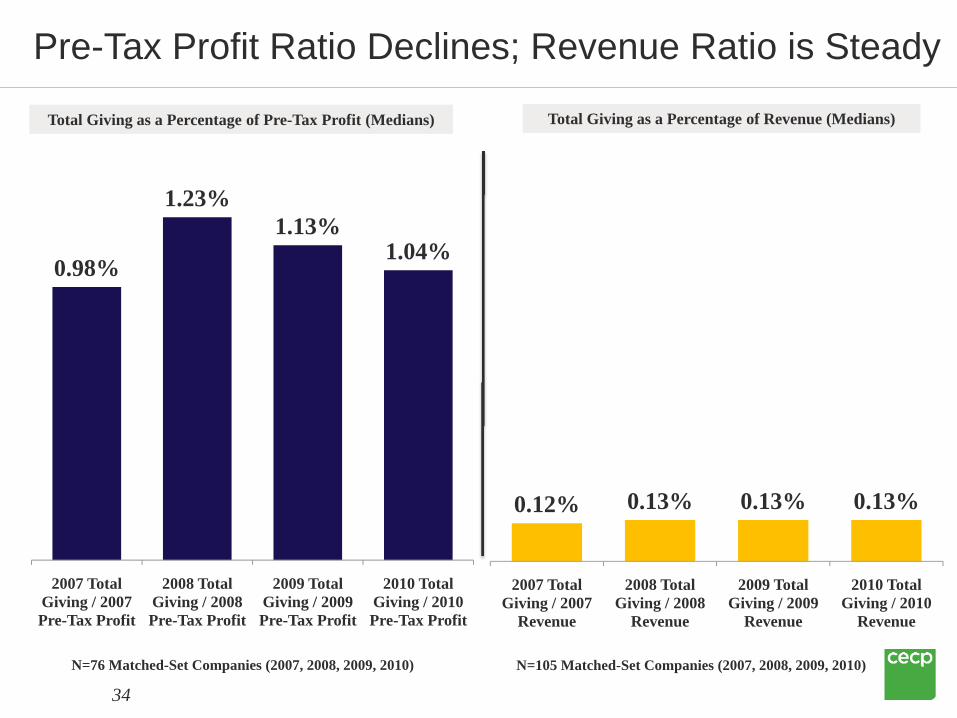
Pre-Tax Profit Ratio Declines; Revenue Ratio is Steady
N=76 Matched-Set Companies (2007, 2008, 2009, 2010)
1.04%1.13%
1.23%
0.98%
2010 Total Giving / 2010 Pre-Tax Profit
2009 Total Giving / 2009 Pre-Tax Profit
2008 Total Giving / 2008 Pre-Tax Profit
2007 Total Giving / 2007 Pre-Tax Profit
0.13%0.13%0.13%0.12%
2010 Total Giving / 2010
Revenue
2009 Total Giving / 2009
Revenue
2008 Total Giving / 2008
Revenue
2007 Total Giving / 2007
Revenue
Total Giving as a Percentage of Pre-Tax Profit (Medians) Total Giving as a Percentage of Revenue (Medians)
N=105 Matched-Set Companies (2007, 2008, 2009, 2010)
Key Takeaways for Trends in Giving
35
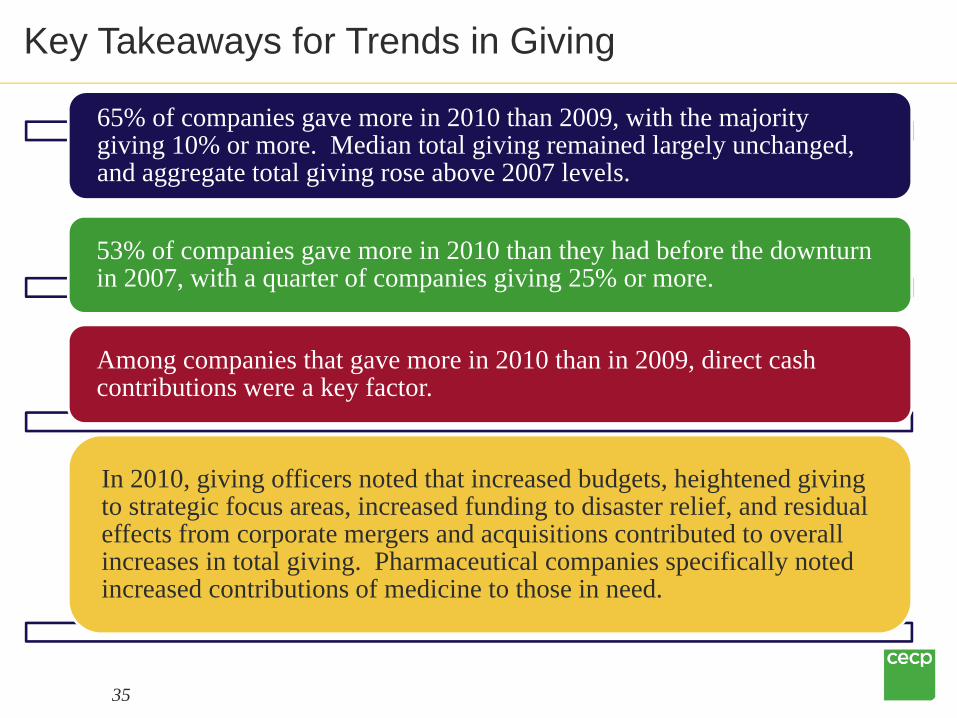
65% of companies gave more in 2010 than 2009, with the majority giving 10% or more. Median total giving remained largely unchanged, and aggregate total giving rose above 2007 levels.
53% of companies gave more in 2010 than they had before the downturn in 2007, with a quarter of companies giving 25% or more.
Among companies that gave more in 2010 than in 2009, direct cash contributions were a key factor.
In 2010, giving officers noted that increased budgets, heightened giving to strategic focus areas, increased funding to disaster relief, and residual effects from corporate mergers and acquisitions contributed to overall increases in total giving. Pharmaceutical companies specifically noted increased contributions of medicine to those in need.
III. Additional Findings
36
Providing answers to your key questions!
• Allocation of Cash and Non-Cash• Corporate Foundations• Motivations for Giving• Grant Recipients by Program Area• International Giving• Employee Volunteer Programs• Management Structures and Program Costs
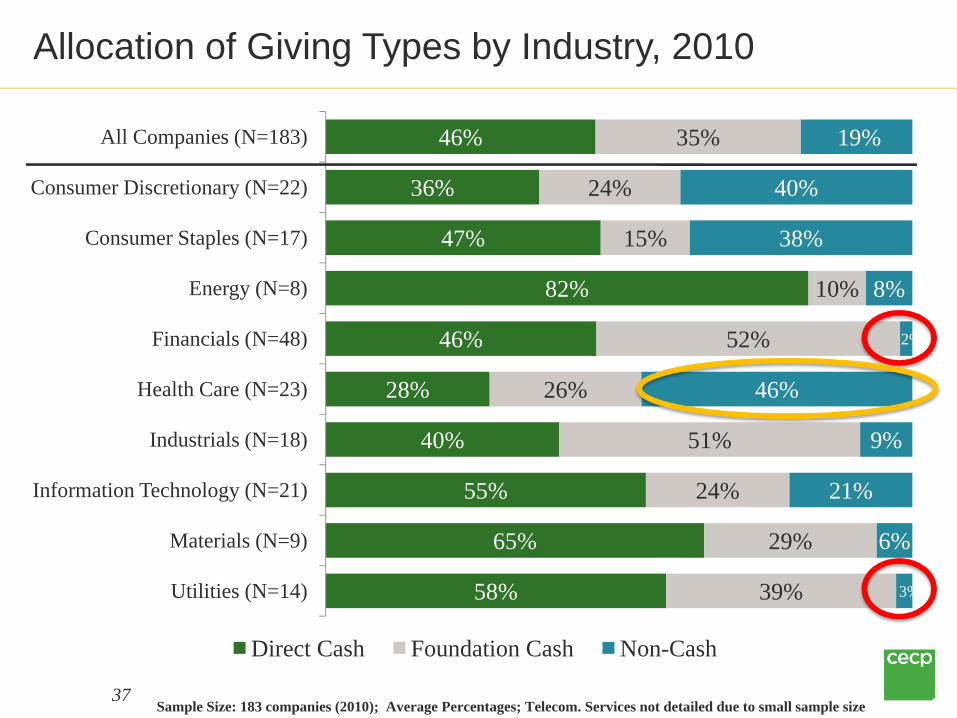
37Sample Size: 183 companies (2010); Average Percentages; Telecom. Services not detailed due to small sample size
46%
36%
47%
82%
46%
28%
40%
55%
65%
58%
35%
24%
15%
10%
52%
26%
51%
24%
29%
39%
19%
40%
38%
8%
2%
46%
9%
21%
6%
3%
All Companies (N=183)
Consumer Discretionary (N=22)
Consumer Staples (N=17)
Energy (N=8)
Financials (N=48)
Health Care (N=23)
Industrials (N=18)
Information Technology (N=21)
Materials (N=9)
Utilities (N=14)
Direct Cash Foundation Cash Non-Cash
Allocation of Giving Types by Industry, 2010
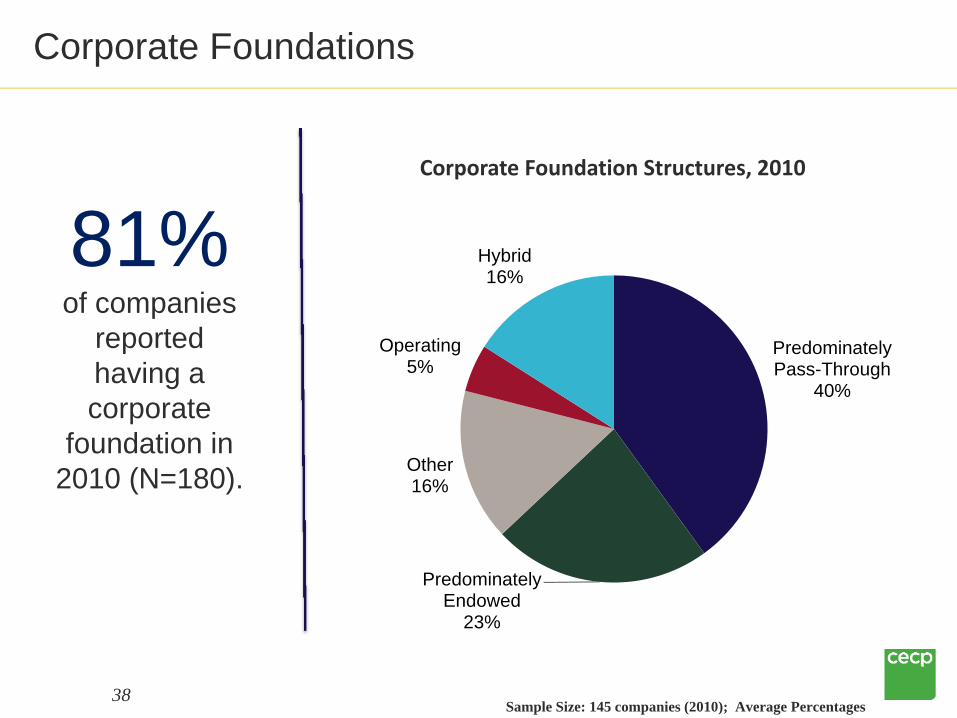
38Sample Size: 145 companies (2010); Average Percentages
Corporate Foundations
Predominately Pass-Through
40%
Predominately Endowed
23%
Other16%
Operating5%
Hybrid16%
Corporate Foundation Structures, 2010
81% of companies
reported having a corporate
foundation in 2010 (N=180).
39
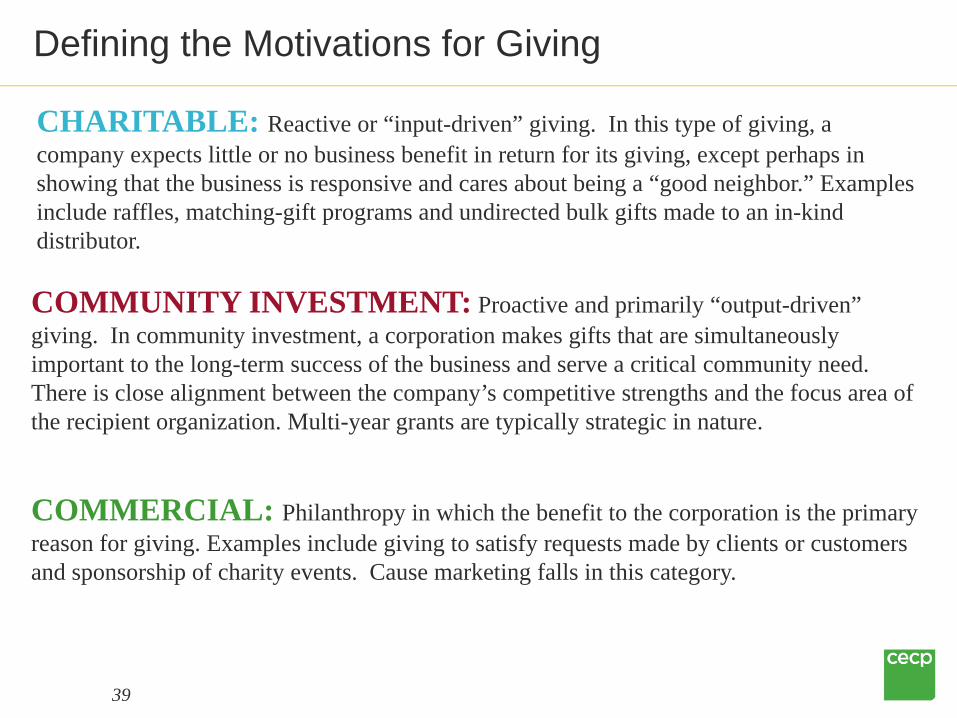
CHARITABLE: Reactive or “input-driven” giving. In this type of giving, a company expects little or no business benefit in return for its giving, except perhaps in showing that the business is responsive and cares about being a “good neighbor.” Examples include raffles, matching-gift programs and undirected bulk gifts made to an in-kind distributor.
COMMUNITY INVESTMENT: Proactive and primarily “output-driven” giving. In community investment, a corporation makes gifts that are simultaneously important to the long-term success of the business and serve a critical community need. There is close alignment between the company’s competitive strengths and the focus area of the recipient organization. Multi-year grants are typically strategic in nature.
COMMERCIAL: Philanthropy in which the benefit to the corporation is the primary reason for giving. Examples include giving to satisfy requests made by clients or customers and sponsorship of charity events. Cause marketing falls in this category.
Defining the Motivations for Giving
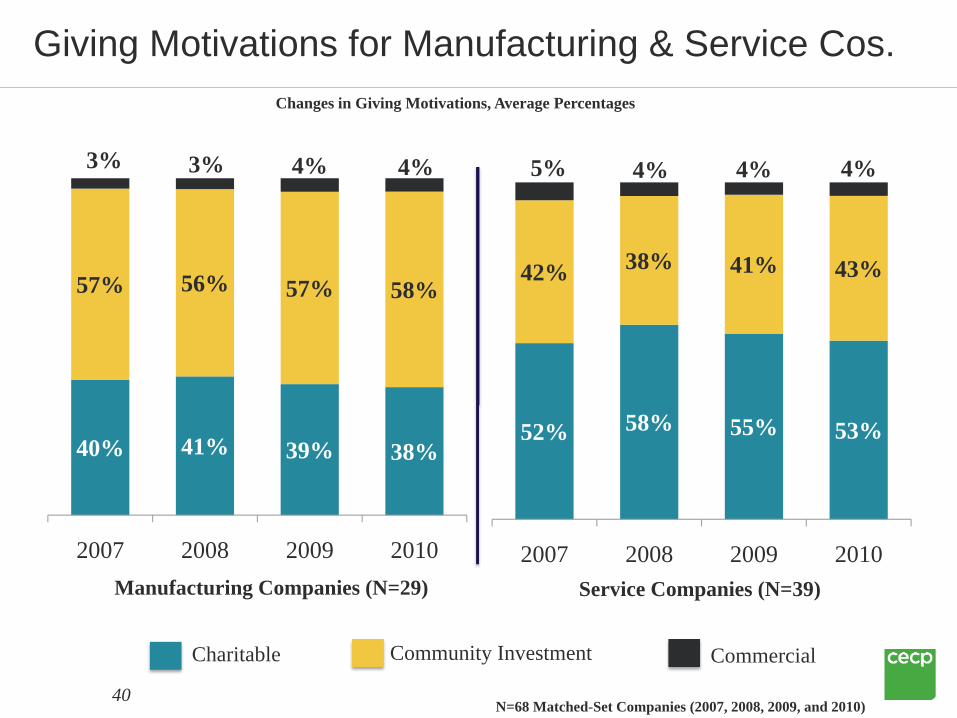
40N=68 Matched-Set Companies (2007, 2008, 2009, and 2010)
40% 41% 39% 38%
57% 56% 57% 58%
3% 3% 4% 4%
2007 2008 2009 2010
52% 58% 55% 53%
42% 38% 41% 43%
5% 4% 4% 4%
2007 2008 2009 2010Manufacturing Companies (N=29) Service Companies (N=39)
Charitable Community Investment Commercial
Changes in Giving Motivations, Average Percentages
Giving Motivations for Manufacturing & Service Cos.
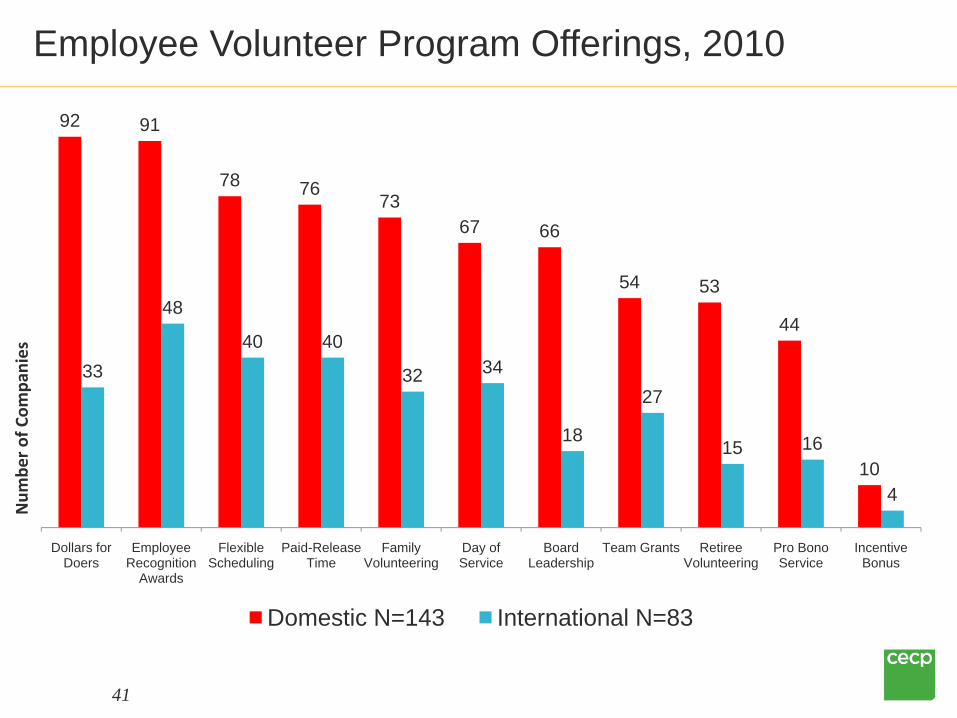
41
Employee Volunteer Program Offerings, 2010
92 91
78 7673
67 66
54 53
44
10
33
48
40 40
32 34
18
27
15 16
4
Dollars for Doers
Employee Recognition
Awards
Flexible Scheduling
Paid-Release Time
Family Volunteering
Day of Service
Board Leadership
Team Grants Retiree Volunteering
Pro Bono Service
Incentive Bonus
Num
ber o
f Com
panies
Domestic N=143 International N=83
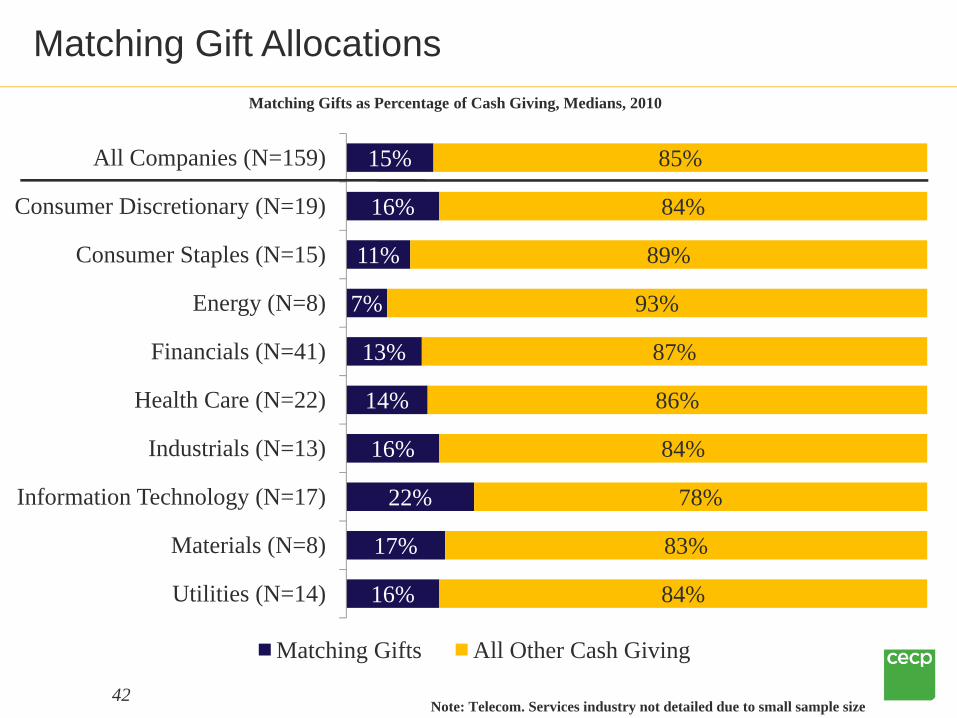
42Note: Telecom. Services industry not detailed due to small sample size
15%
16%
11%
7%
13%
14%
16%
22%
17%
16%
85%
84%
89%
93%
87%
86%
84%
78%
83%
84%
All Companies (N=159)
Consumer Discretionary (N=19)
Consumer Staples (N=15)
Energy (N=8)
Financials (N=41)
Health Care (N=22)
Industrials (N=13)
Information Technology (N=17)
Materials (N=8)
Utilities (N=14)
Matching Gifts All Other Cash Giving
Matching Gift AllocationsMatching Gifts as Percentage of Cash Giving, Medians, 2010
43
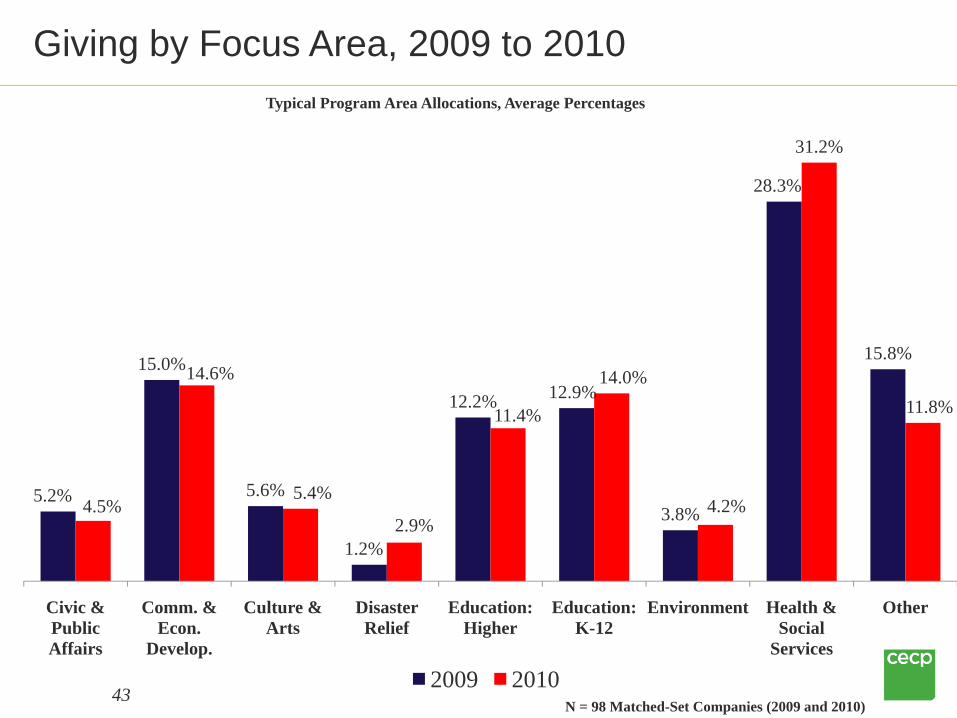
5.2%
15.0%
5.6%
1.2%
12.2% 12.9%
3.8%
28.3%
15.8%
4.5%
14.6%
5.4%
2.9%
11.4%
14.0%
4.2%
31.2%
11.8%
Civic & Public Affairs
Comm. & Econ.
Develop.
Culture & Arts
Disaster Relief
Education: Higher
Education: K-12
Environment Health & Social
Services
Other
2009 2010N = 98 Matched-Set Companies (2009 and 2010)
Giving by Focus Area, 2009 to 2010Typical Program Area Allocations, Average Percentages
Civ
ic &
Pub
lic
Aff
airs
Com
mun
ity &
E
cono
mic
D
evel
opm
ent
Cul
ture
& A
rts
Dis
aste
r R
elie
f
Edu
catio
n:
Hig
her
Edu
catio
n: K
-12 E
nvir
onm
ent
Hea
lth &
Soc
ial
Serv
ices
Oth
er
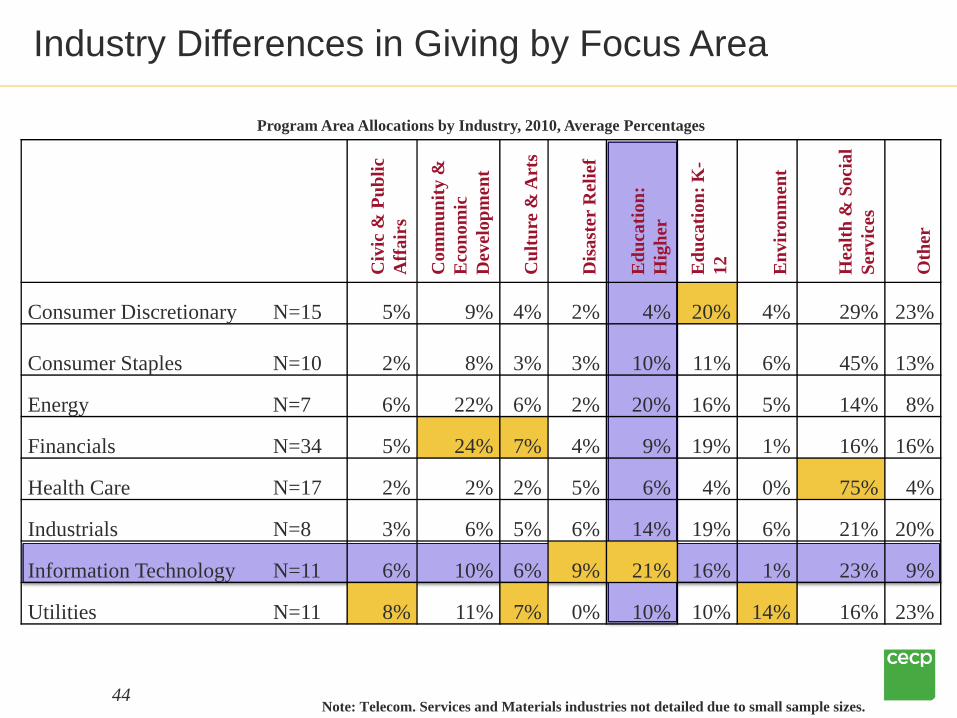
Consumer Discretionary N=15 5% 9% 4% 2% 4% 20% 4% 29% 23%
Consumer Staples N=10 2% 8% 3% 3% 10% 11% 6% 45% 13%
Energy N=7 6% 22% 6% 2% 20% 16% 5% 14% 8%
Financials N=34 5% 24% 7% 4% 9% 19% 1% 16% 16%
Health Care N=17 2% 2% 2% 5% 6% 4% 0% 75% 4%
Industrials N=8 3% 6% 5% 6% 14% 19% 6% 21% 20%
Information Technology N=11 6% 10% 6% 9% 21% 16% 1% 23% 9%
Utilities N=11 8% 11% 7% 0% 10% 10% 14% 16% 23%
44
Program Area Allocations by Industry, 2010, Average Percentages
Industry Differences in Giving by Focus Area
Note: Telecom. Services and Materials industries not detailed due to small sample sizes.
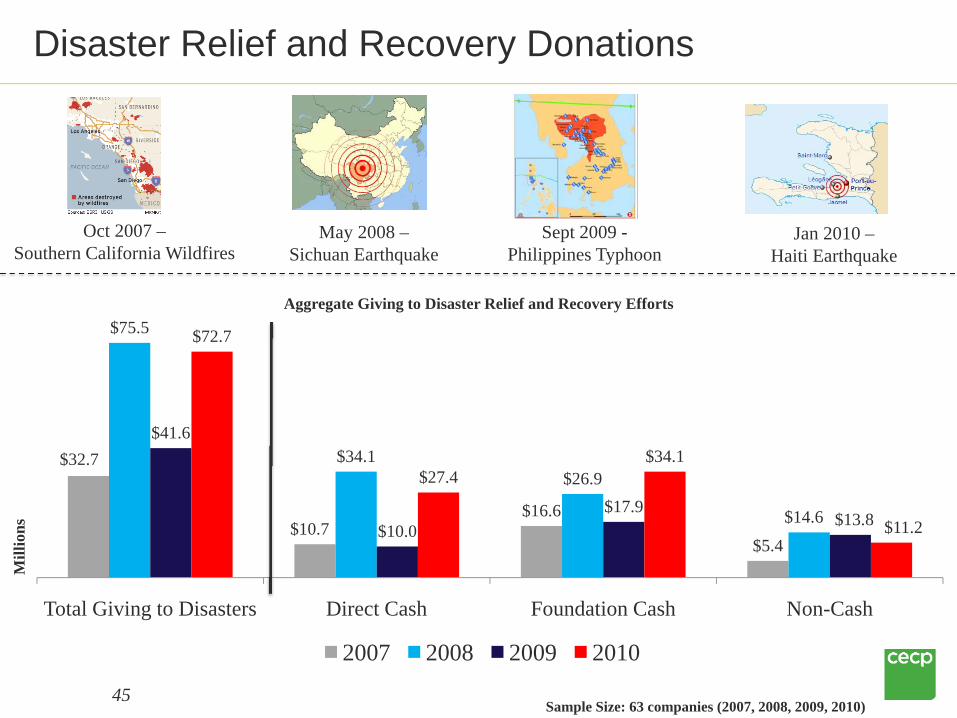
45Sample Size: 63 companies (2007, 2008, 2009, 2010)
$32.7
$10.7$16.6
$5.4
$75.5
$34.1$26.9
$14.6
$41.6
$10.0$17.9
$13.8
$72.7
$27.4$34.1
$11.2
Total Giving to Disasters Direct Cash Foundation Cash Non-Cash
Mill
ions
Aggregate Giving to Disaster Relief and Recovery Efforts
2007 2008 2009 2010
May 2008 –Sichuan Earthquake
Jan 2010 –Haiti Earthquake
Oct 2007 –Southern California Wildfires
Sept 2009 -Philippines Typhoon
Disaster Relief and Recovery Donations
46
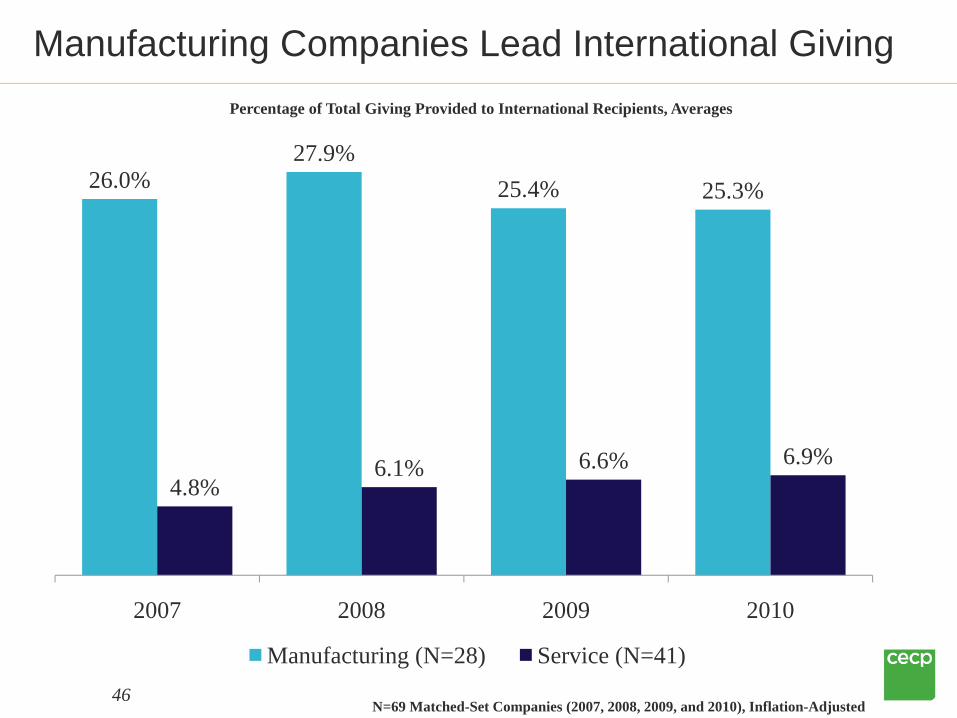
26.0%27.9%
25.4% 25.3%
4.8%6.1% 6.6% 6.9%
2007 2008 2009 2010
Manufacturing (N=28) Service (N=41)
N=69 Matched-Set Companies (2007, 2008, 2009, and 2010), Inflation-Adjusted
Manufacturing Companies Lead International GivingPercentage of Total Giving Provided to International Recipients, Averages

47
Industry Differences in International GivingPercentage of Total Giving Provided to International Recipients, Averages
12%
9%
20%
26%
5%
9%
12%
27%
1%
88%
91%
80%
74%
95%
91%
88%
73%
99%
All Companies (N=118)
Consumer Discretionary (N=18)
Consumer Staples (N=9)
Energy (N=7)
Financials (N=28)
Health Care (N=15)
Industrials (N=14)
IT (N=11)
Utilities (N=11)
International Recipients Domestic Recipients
48
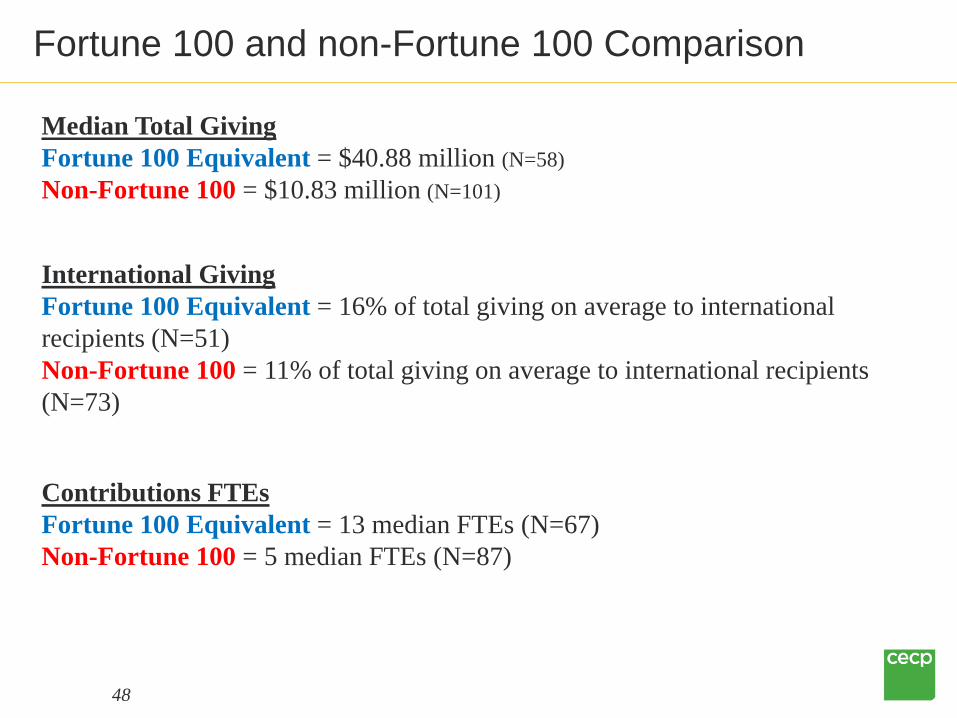
Fortune 100 Similar to Non-F100, But Scaled Up
Median Total GivingFortune 100 Equivalent = $40.88 million (N=58)Non-Fortune 100 = $10.83 million (N=101)
International GivingFortune 100 Equivalent = 16% of total giving on average to international recipients (N=51)Non-Fortune 100 = 11% of total giving on average to international recipients (N=73)
Contributions FTEsFortune 100 Equivalent = 13 median FTEs (N=67)Non-Fortune 100 = 5 median FTEs (N=87)
Fortune 100 and non-Fortune 100 Comparison
49
As we are in the midst of 2011, do you think most companies are likely to:
Increase their contributions over 2010 levels.
Decrease their contributions from 2010 levels.
Keep their contributions at the same level.
Unsure.
1
2
3
4
Audience Poll Question
50
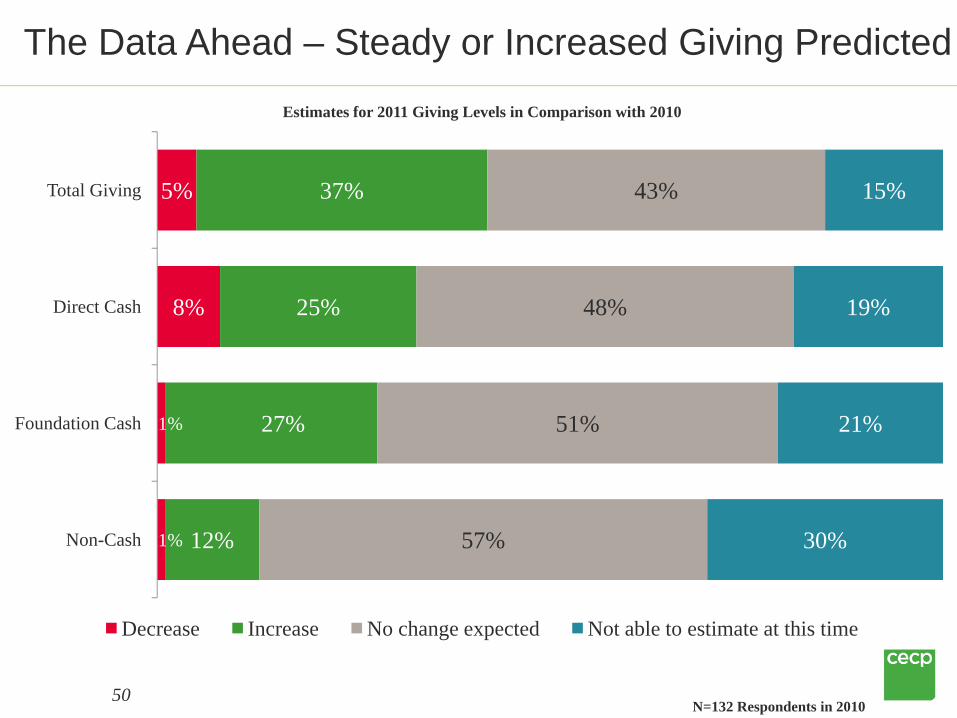
The Data Ahead – Steady or Increased Giving Predicted
5%
8%
1%
1%
37%
25%
27%
12%
43%
48%
51%
57%
15%
19%
21%
30%
Total Giving
Direct Cash
Foundation Cash
Non-Cash
Decrease Increase No change expected Not able to estimate at this time
N=132 Respondents in 2010
Estimates for 2011 Giving Levels in Comparison with 2010
Thank you for joining us today…
and a big thank you to VolunteerMatch for hosting this webinar series!
Contact Details:
Alison Rose, Manager, Standards and [email protected]
51

Type your questions into the question box on the right panel.
We will pose them to the speaker for everyone to hear.
Open Q&A with the Audience
Follow on Twitter: @VM_Solutions and @CECPTweets with #CECPData

54
2010 Survey ParticipantsConsumer Discretionary (N=22)• Best Buy Co., Inc.• Carlson• Darden Restaurants, Inc.• DIRECTV, Inc.• Gap Inc.• Hasbro, Inc.• The Home Depot, Inc.• J.C. Penney Company, Inc.• Johnson Controls, Inc.• Levi Strauss & Co.• Limited Brands, Inc.• The McGraw-Hill Companies• Macy's, Inc.• Mattel, Inc.• Newell Rubbermaid Inc. • Ogilvy & Mather• Pearson plc• Target• Time Warner Inc.• Toyota Motor North America, Inc.• Toys"R"Us, Inc.• The Walt Disney Company
Consumer Staples (N=17)• Altria Group, Inc.• Campbell Soup Company• Cargill• The Coca-Cola Company• Colgate-Palmolive Company• ConAgra Foods, Inc.• CVS Caremark Corporation• General Mills, Inc.• The Hershey Company• Kimberly-Clark Corporation• Kraft Foods• McCormick & Company,
Incorporated• PepsiCo• Philip Morris International• The Procter & Gamble Company• Wal-Mart Stores, Inc.• Woolworths Limited
Health Care (N=23)• Abbott Laboratories• Aetna Inc.• Agilent Technologies, Inc.• Amgen Inc.• BD• Bristol-Myers Squibb
Company• Cardinal Health, Inc.• CIGNA• DaVita Inc.• Eli Lilly and Company• Express Scripts, Inc.• GlaxoSmithKline plc• HCA Inc.• Humana Inc.• Johnson & Johnson• McKesson Corporation• Medtronic, Inc.• Merck• Pfizer Inc• Quest Diagnostics
Incorporated• sanofi-aventis• UnitedHealth Group• WellPoint, Inc.

55
2010 Survey ParticipantsFinancials (N=49)• Allstate Insurance Company• American Express• AXA Equitable• Banco Bilbao Vizcaya Argentaria, S.A.• Bank of America Corporation• Barclays Capital• Bloomberg• BNY Mellon• Capital One Financial Corporation• Citigroup Inc.• Citizens Financial Group, Inc.• Credit Suisse• Deloitte LLP• Deutsche Bank• Discover Financial Services• Fannie Mae• First Data Corporation• Genworth Financial, Inc.• The Goldman Sachs Group, Inc.• The Guardian Life Insurance Company of
America• The Hartford Financial Services Group, Inc.• HSBC Bank USA, N.A.• ING Americas• JPMorgan Chase & Co.• KPMG LLP
Financials, continued• Legg Mason, Inc.• Massachusetts Mutual Life
Insurance Company• MBIA Inc.• MetLife, Inc.• Moody's Corporation• Morgan Stanley• Nationwide Insurance• New York Life Insurance Company• Northwestern Mutual• NYSE Euronext• The PNC Financial Services Group,
Inc.• Popular, Inc.• PricewaterhouseCoopers LLP• Principal Financial Group• Prudential Financial, Inc.• Royal Bank of Canada• State Farm Mutual Automobile
Insurance Company• State Street Corporation• T. Rowe Price Group, Inc.• TIAA-CREF• The Travelers Companies, Inc.• UBS• Wells Fargo & Company• Zurich Financial Services Ltd.
Industrials (N=18)• 3M• The Boeing Company• Caterpillar Inc.• Crane Co.• Delta Air Lines, Inc.• Eaton Corporation• Emerson Electric Co.• FedEx Corporation• General Electric
Company• Illinois Tool Works Inc.• ITT Corporation• Lockheed Martin
Corporation• Mitsubishi International
Corporation• Meritor, Inc.• Northrop Grumman
Corporation• Pitney Bowes Inc.• Ryder System, Inc.• United Technologies
Corporation
56
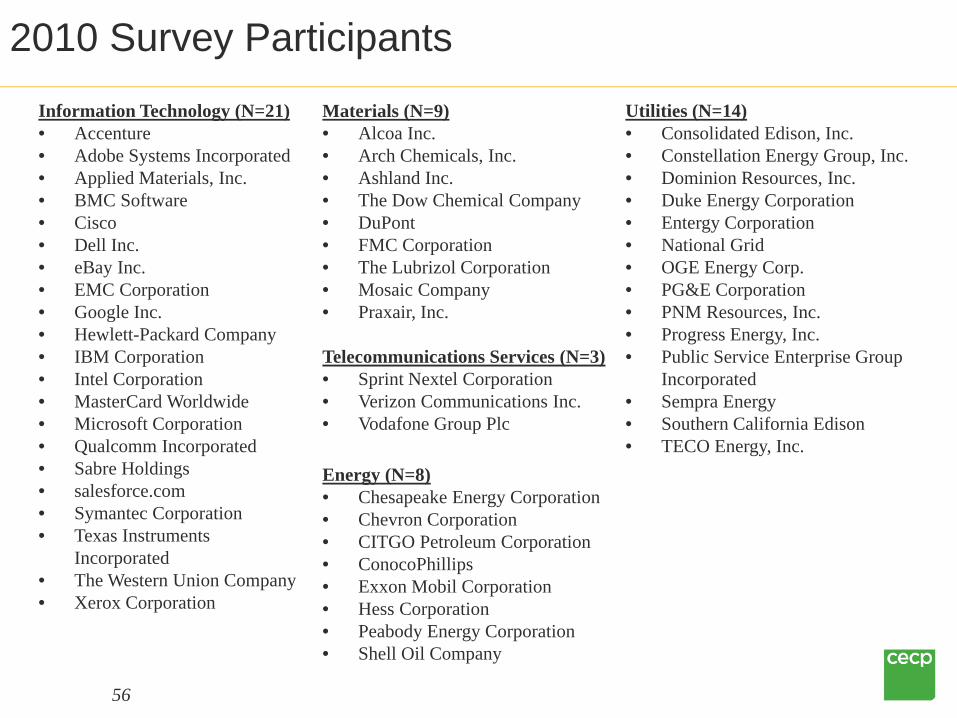
2010 Survey ParticipantsInformation Technology (N=21)• Accenture• Adobe Systems Incorporated• Applied Materials, Inc.• BMC Software• Cisco• Dell Inc.• eBay Inc.• EMC Corporation• Google Inc.• Hewlett-Packard Company• IBM Corporation• Intel Corporation• MasterCard Worldwide• Microsoft Corporation• Qualcomm Incorporated• Sabre Holdings• salesforce.com• Symantec Corporation• Texas Instruments
Incorporated• The Western Union Company• Xerox Corporation
Materials (N=9)• Alcoa Inc.• Arch Chemicals, Inc.• Ashland Inc.• The Dow Chemical Company• DuPont• FMC Corporation• The Lubrizol Corporation• Mosaic Company• Praxair, Inc.
Telecommunications Services (N=3)• Sprint Nextel Corporation• Verizon Communications Inc.• Vodafone Group Plc
Energy (N=8)• Chesapeake Energy Corporation• Chevron Corporation• CITGO Petroleum Corporation• ConocoPhillips• Exxon Mobil Corporation• Hess Corporation• Peabody Energy Corporation• Shell Oil Company
Utilities (N=14)• Consolidated Edison, Inc.• Constellation Energy Group, Inc.• Dominion Resources, Inc.• Duke Energy Corporation• Entergy Corporation• National Grid• OGE Energy Corp.• PG&E Corporation• PNM Resources, Inc.• Progress Energy, Inc.• Public Service Enterprise Group
Incorporated• Sempra Energy• Southern California Edison• TECO Energy, Inc.