concepts in quality management: sessions 1 and 2juran managerial practices, training, cost of...
TRANSCRIPT
Six Sigma
Concepts in Quality Management: Sessions 1 and 2
Lecture Objectives
• Overview of Quality Management • Total Quality Management defined • Quality Specifications and Costs • TQM Tools; External Benchmarking • ISO 9000 • Service Quality Measurement • Six Sigma Quality
Defining Quality
Perfection Providing a good, usable product Eliminating waste Consistency Fast delivery Fitness for use Doing it right the first time Delighting or pleasing customers Total customer service and satisfaction
What is Six Sigma?
• Six Sigma is a business improvement approach • Seeks to find and eliminate causes of defects and
errors in manufacturing and service processes • Focuses on outputs that are critical to customers
and a clear financial return for the organization • Aims at producing no more than 3.4 ppm defects • Pioneered by Motorola in the mid-1980s • Popularized by the success of General Electric
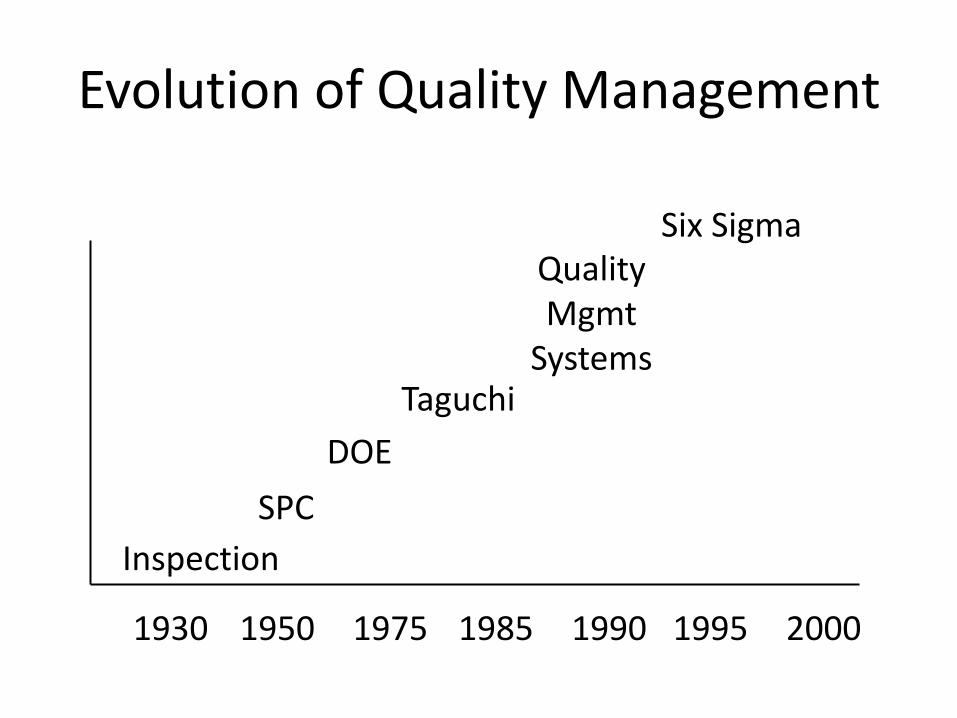
Evolution of Quality Management
Inspection
SPC
DOE
Taguchi
Quality Mgmt
Systems
Six Sigma
2000 1995 1990 1985 1975 1930 1950
Quality Management and the Evolution of Six Sigma
• Skilled craftsmanship during Middle Ages
• Industrial Revolution: rise of inspection and separate quality departments
• Early 20th Century: Statistical methods at Bell System
• Quality control during World War II
• Post-war Japan: evolution of quality management
• Quality awareness in U.S. manufacturing industry during 1980s: from “Little Q” – QC – to “Big Q” – Total Quality Management
• Malcom Baldrige National Quality Award (1987)
• Disappointments and criticism
Quality Management and the Evolution of Six Sigma
• Emergence of quality management in service industries, government, health care, and education
• Birth of Six Sigma
• Current and future challenge: keep progress in quality management alive
Quality Management and the Evolution of Six Sigma
Quality Management has matured…
Quality Planning
Quality Assurance
Quality Control
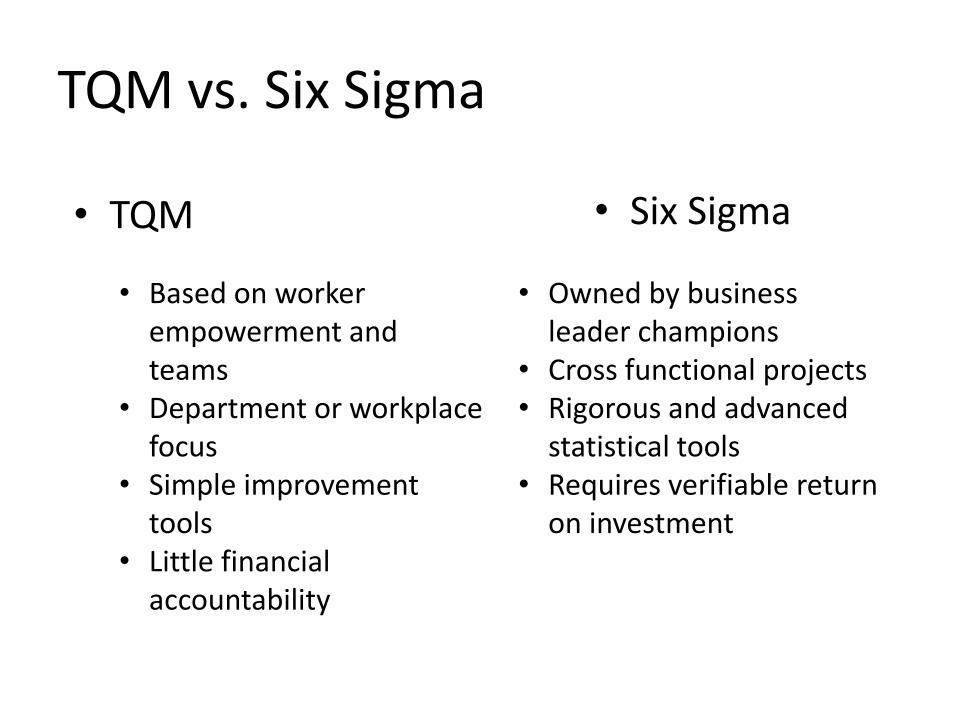
TQM vs. Six Sigma
• Six Sigma
• Based on worker empowerment and teams
• Department or workplace focus
• Simple improvement tools
• Little financial accountability
• TQM
• Owned by business leader champions
• Cross functional projects • Rigorous and advanced
statistical tools • Requires verifiable return
on investment
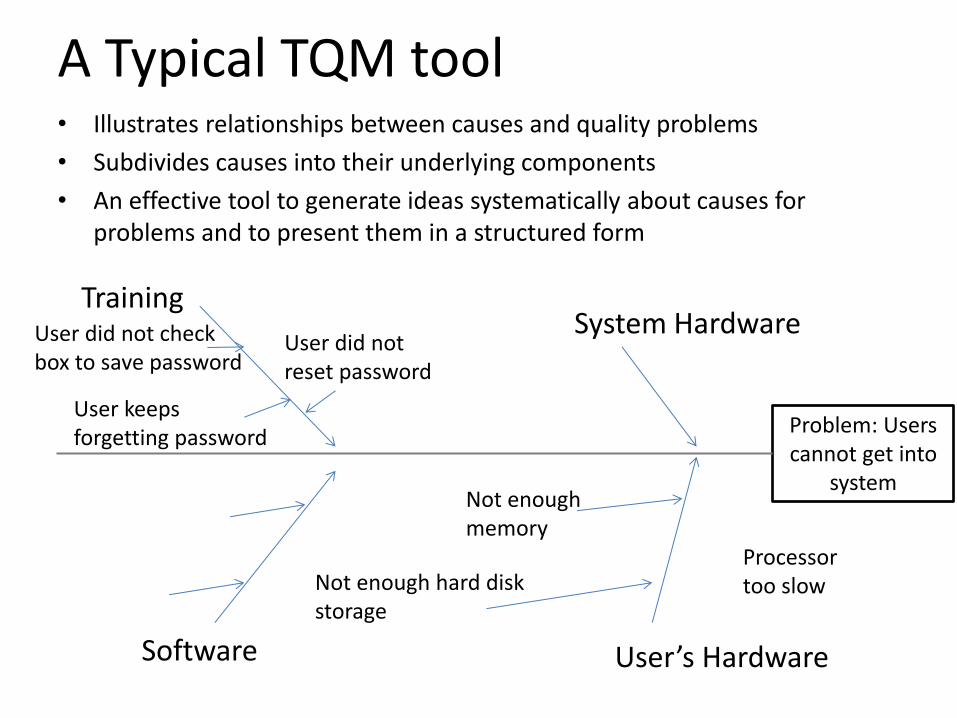
A Typical TQM tool • Illustrates relationships between causes and quality problems
• Subdivides causes into their underlying components
• An effective tool to generate ideas systematically about causes for problems and to present them in a structured form
System Hardware
User’s Hardware Software
User keeps forgetting password
User did not reset password
Not enough memory
Not enough hard disk storage
Processor too slow
Problem: Users cannot get into
system
User did not check box to save password
Training
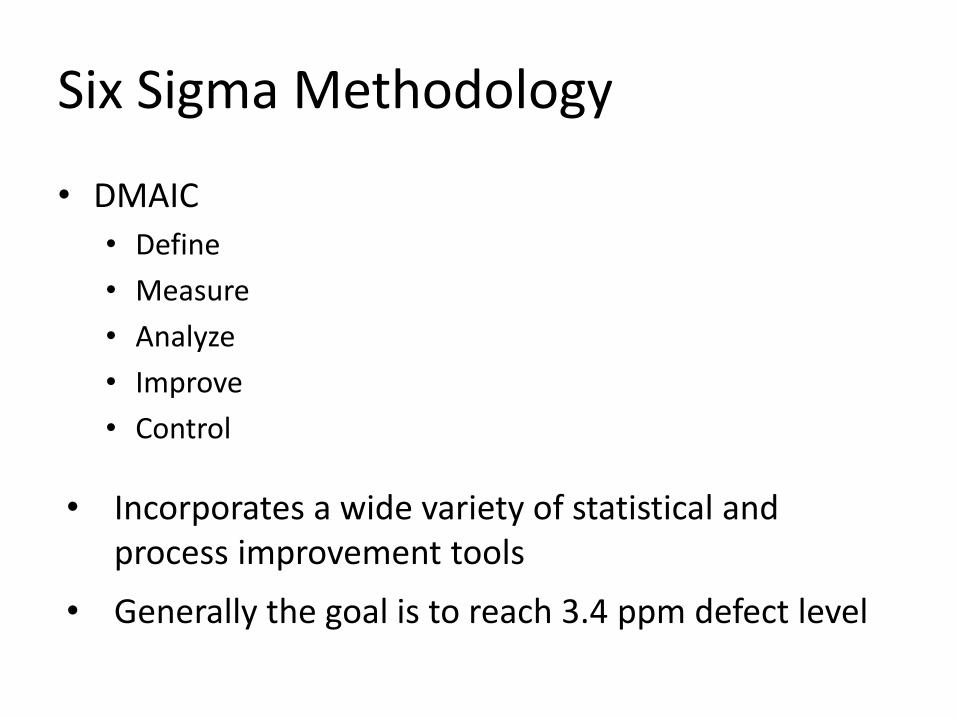
Six Sigma Methodology
• DMAIC
• Define
• Measure
• Analyze
• Improve
• Control
• Incorporates a wide variety of statistical and process improvement tools
• Generally the goal is to reach 3.4 ppm defect level
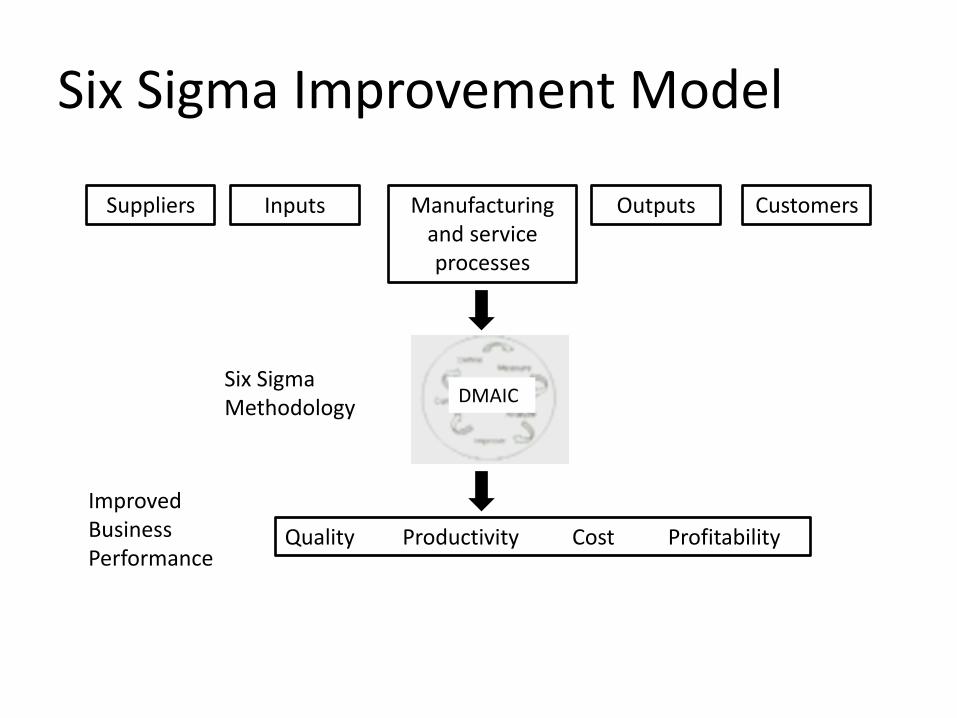
Six Sigma Improvement Model
Improved Business Performance
Quality Productivity Cost Profitability
Suppliers Inputs Manufacturing and service processes
Outputs Customers
Six Sigma Methodology
DMAIC
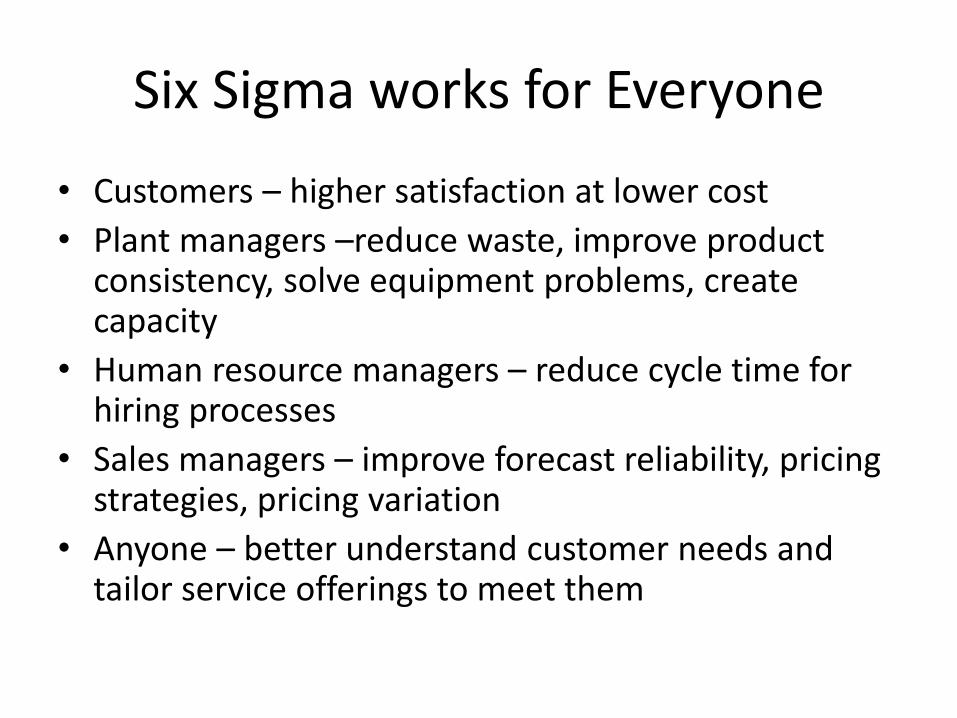
Six Sigma works for Everyone
• Customers – higher satisfaction at lower cost
• Plant managers –reduce waste, improve product consistency, solve equipment problems, create capacity
• Human resource managers – reduce cycle time for hiring processes
• Sales managers – improve forecast reliability, pricing strategies, pricing variation
• Anyone – better understand customer needs and tailor service offerings to meet them
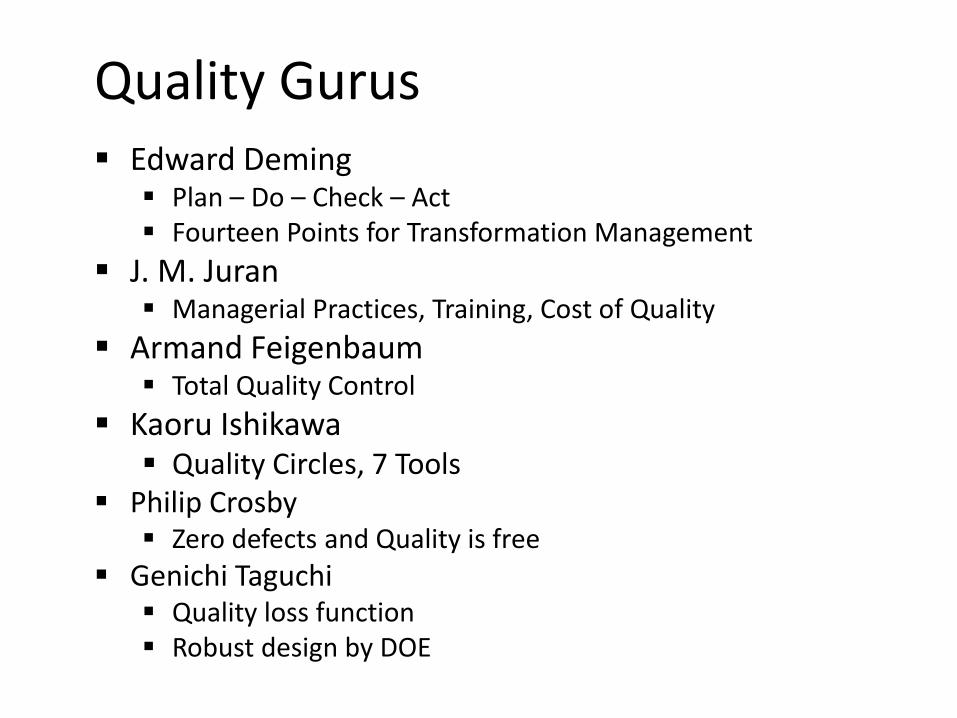
Quality Gurus Edward Deming
Plan – Do – Check – Act Fourteen Points for Transformation Management
J. M. Juran Managerial Practices, Training, Cost of Quality
Armand Feigenbaum Total Quality Control
Kaoru Ishikawa Quality Circles, 7 Tools
Philip Crosby Zero defects and Quality is free
Genichi Taguchi Quality loss function Robust design by DOE
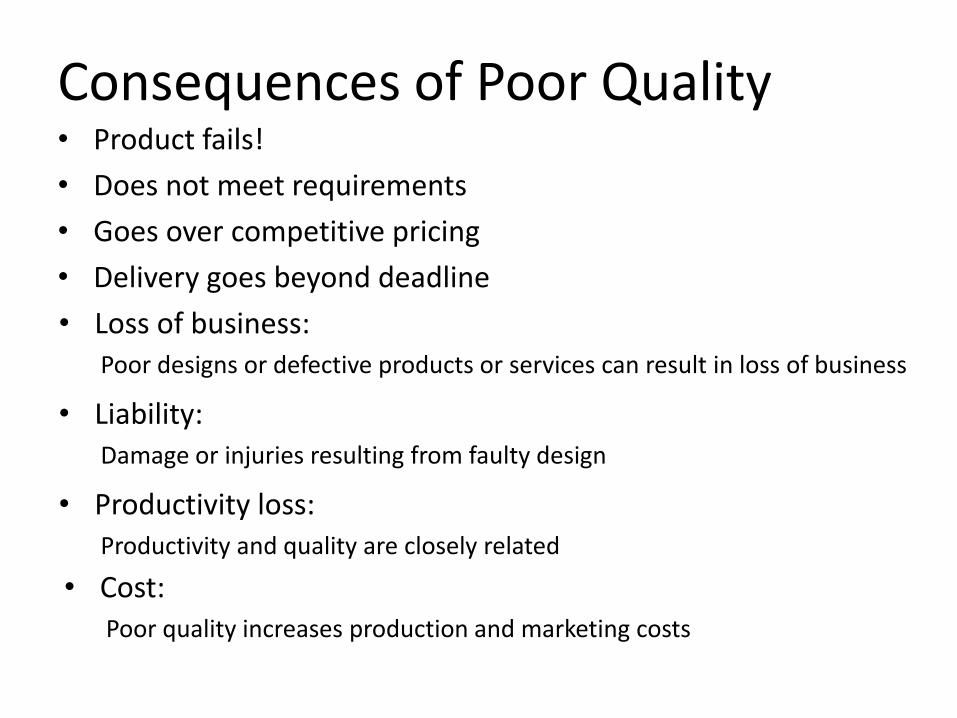
Consequences of Poor Quality • Product fails!
• Does not meet requirements
• Goes over competitive pricing
• Delivery goes beyond deadline
• Loss of business: Poor designs or defective products or services can result in loss of business
• Liability: Damage or injuries resulting from faulty design
• Productivity loss: Productivity and quality are closely related
• Cost: Poor quality increases production and marketing costs
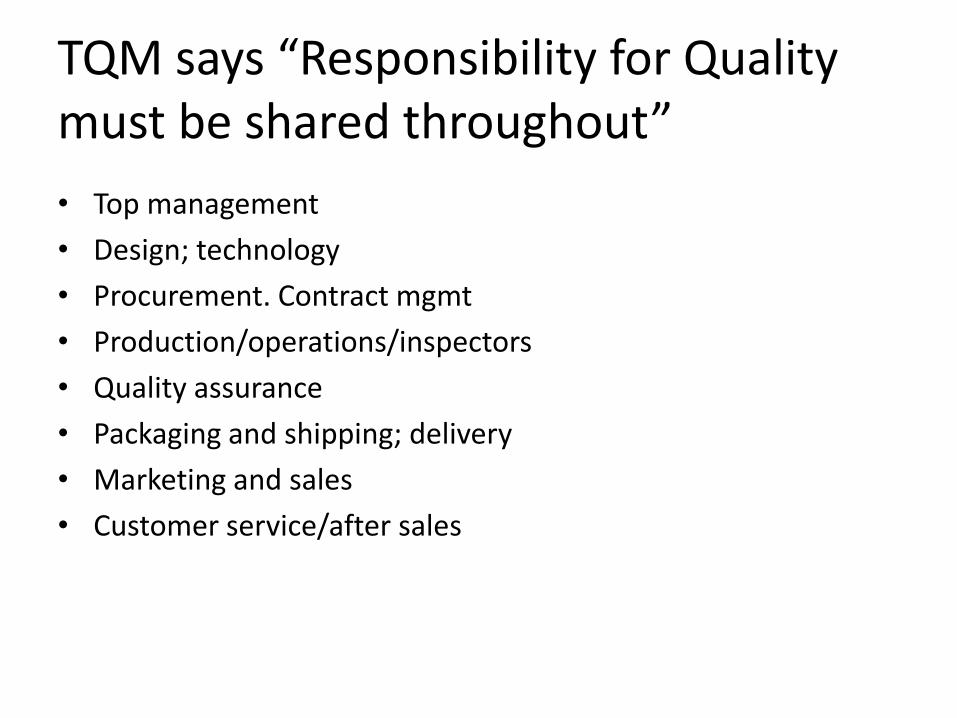
TQM says “Responsibility for Quality must be shared throughout”
• Top management
• Design; technology
• Procurement. Contract mgmt
• Production/operations/inspectors
• Quality assurance
• Packaging and shipping; delivery
• Marketing and sales
• Customer service/after sales
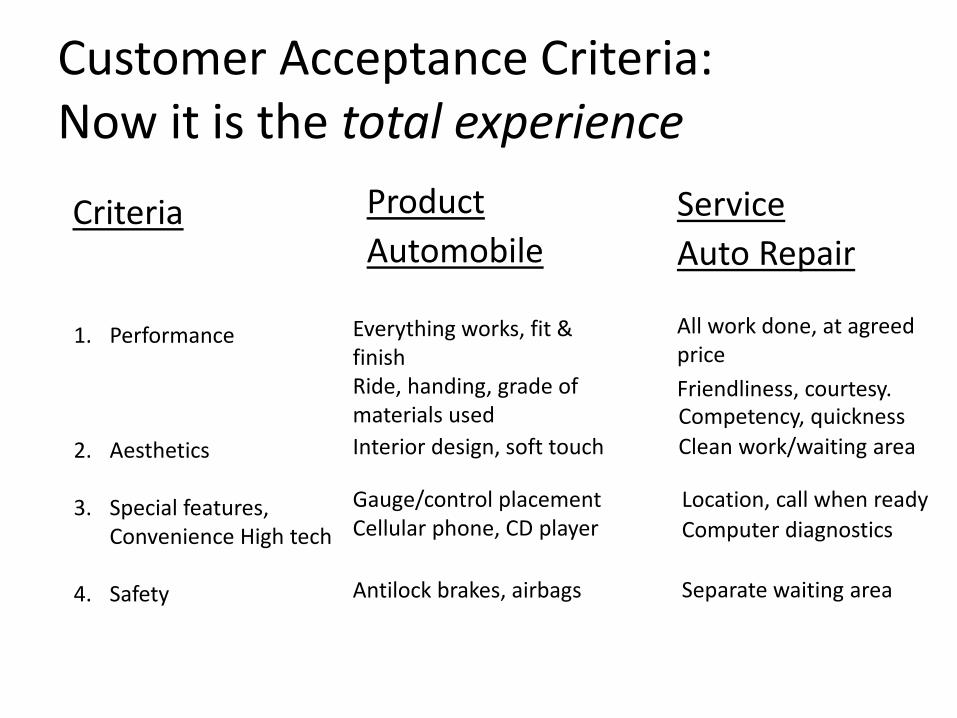
Customer Acceptance Criteria: Now it is the total experience
Criteria
1. Performance
2. Aesthetics
3. Special features, Convenience High tech
4. Safety
Product
Automobile
Everything works, fit & finish Ride, handing, grade of materials used Interior design, soft touch Gauge/control placement Cellular phone, CD player
Antilock brakes, airbags
Service
Auto Repair
All work done, at agreed price Friendliness, courtesy. Competency, quickness Clean work/waiting area Location, call when ready Computer diagnostics
Separate waiting area
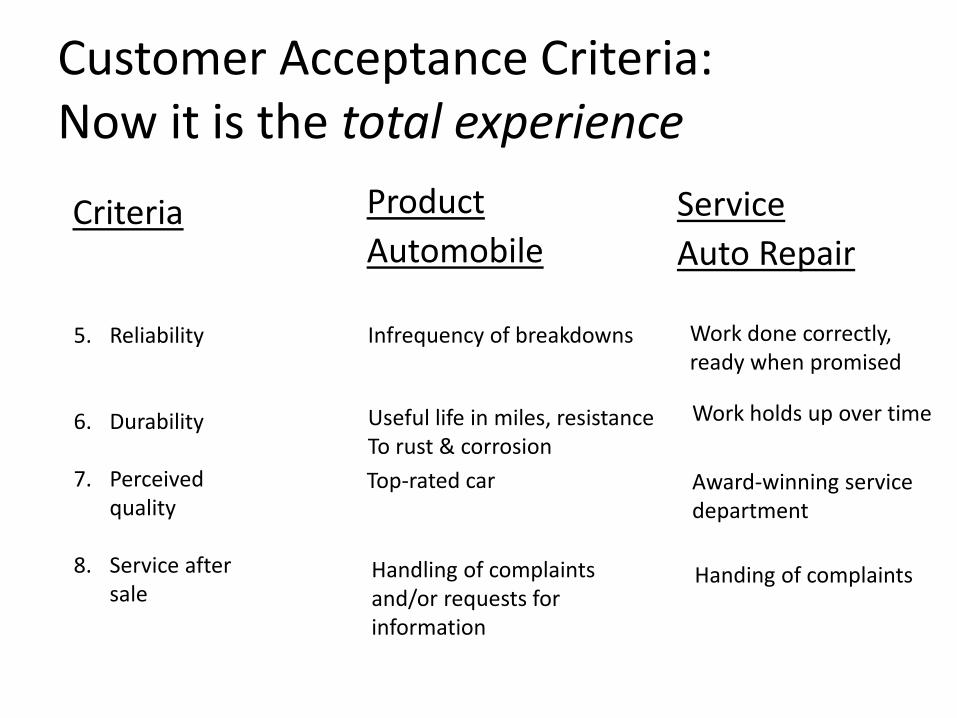
Customer Acceptance Criteria: Now it is the total experience
Criteria Product
Automobile
Service
Auto Repair
5. Reliability
6. Durability
7. Perceived quality
8. Service after sale
Infrequency of breakdowns
Useful life in miles, resistance To rust & corrosion Top-rated car
Handling of complaints and/or requests for information
Work done correctly, ready when promised Work holds up over time
Award-winning service department
Handing of complaints
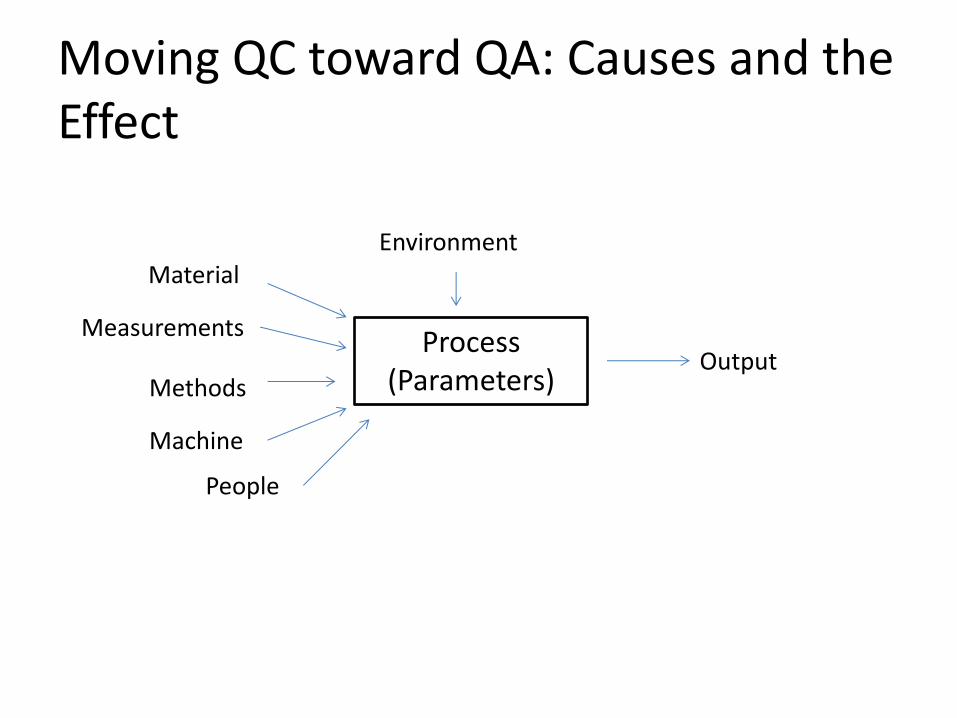
Moving QC toward QA: Causes and the Effect
Process (Parameters)
Environment Material
Measurements
Methods
Machine
People
Output

Moving QC toward QA: Causes and the Effect
Process (Parameters)
Environment Material
Measurements
Methods
Machine
People
Output
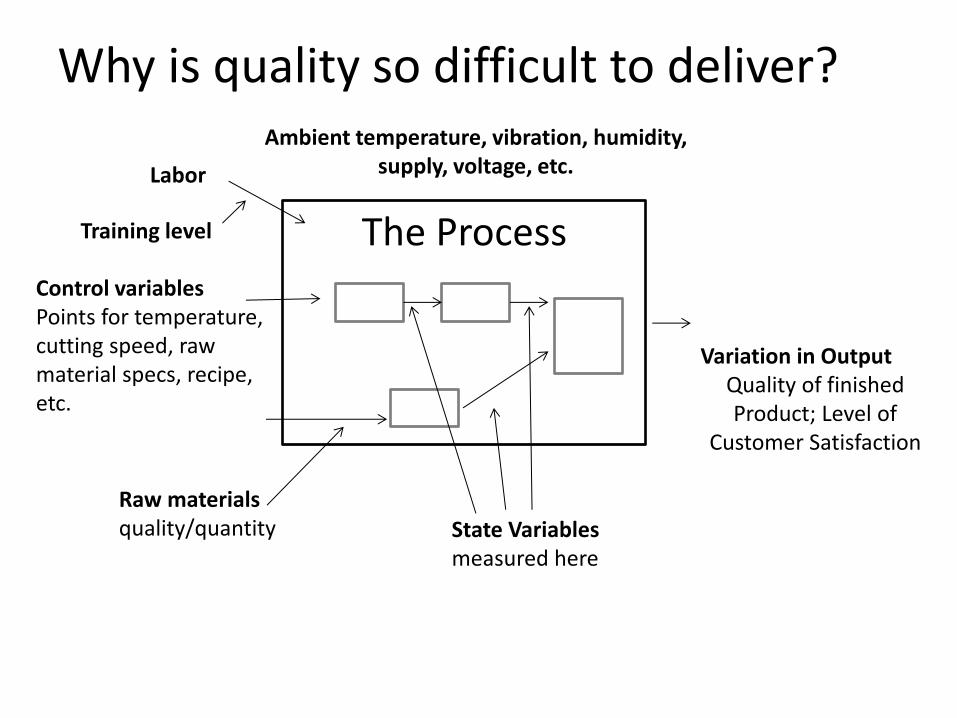
Why is quality so difficult to deliver?
The Process
State Variables measured here
Ambient temperature, vibration, humidity, supply, voltage, etc. Labor
Training level
Raw materials quality/quantity
Control variables Points for temperature, cutting speed, raw material specs, recipe, etc.
Variation in Output Quality of finished Product; Level of
Customer Satisfaction
Traditional Quality Management
• Focus on short term profits, stock price
• No clear strategic position in target sectors (poor competitive positioning)
• Clamping down on costs while tolerating high levels of waste
• Take-it-or-leave-it attitude to customers
• Buying at lowest price
• Managers are troubleshooters
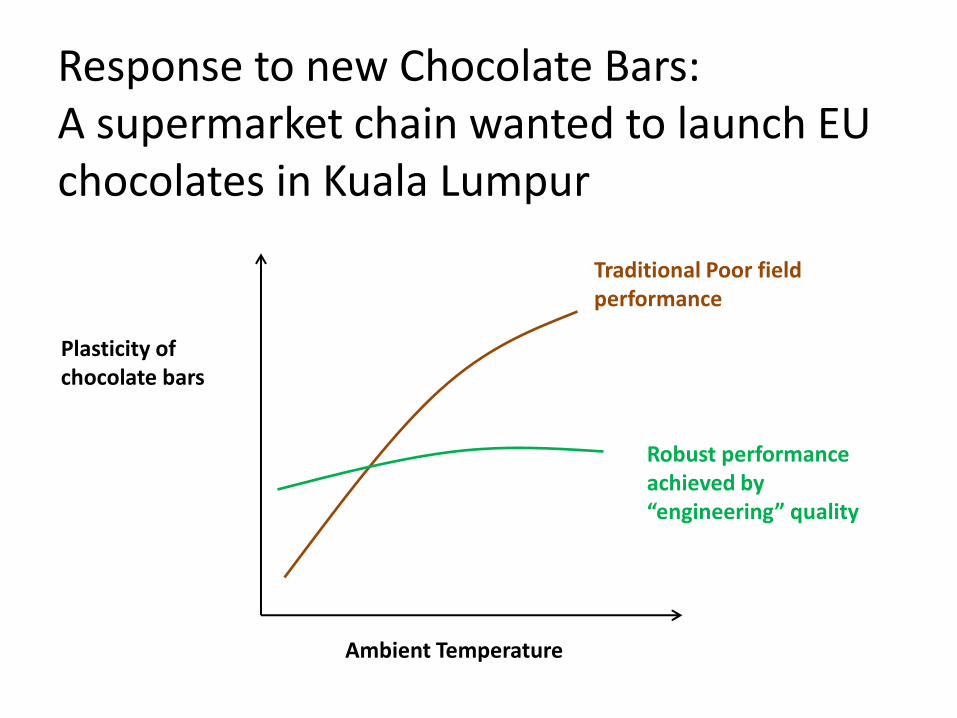
Response to new Chocolate Bars: A supermarket chain wanted to launch EU chocolates in Kuala Lumpur
Ambient Temperature
Plasticity of chocolate bars
Traditional Poor field performance
Robust performance achieved by “engineering” quality
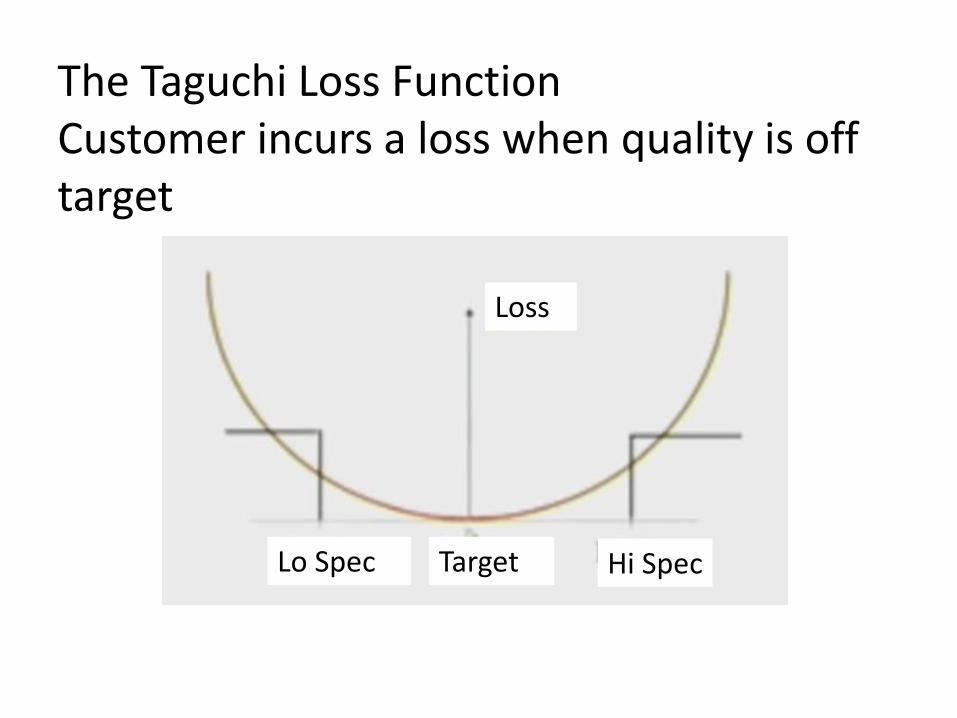
The Taguchi Loss Function Customer incurs a loss when quality is off target
Loss
Target Hi Spec Lo Spec
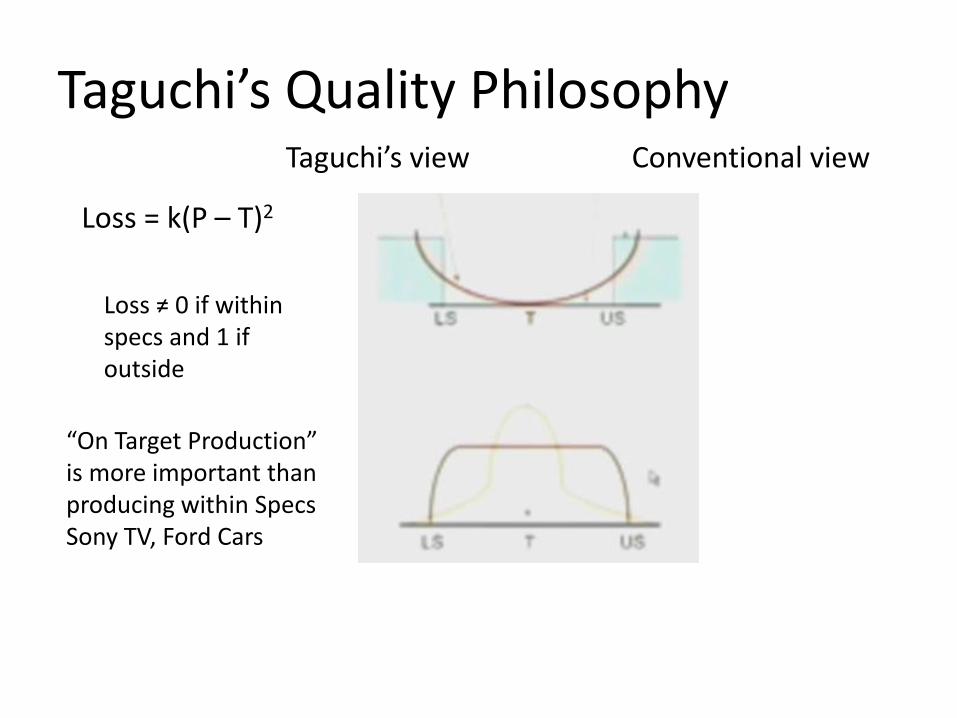
Taguchi’s Quality Philosophy Taguchi’s view Conventional view
Loss = k(P – T)2
Loss ≠ 0 if within specs and 1 if outside
“On Target Production” is more important than producing within Specs Sony TV, Ford Cars
Current Situation Worldwide
• More competitors than ever
• Fiercely competitive strategies in play
• Fluid and unpredictable financial systems
• Customers’ expectations increasing
• Employees’ expectations increasing
• Investors expect more
• Rapid changes in technology
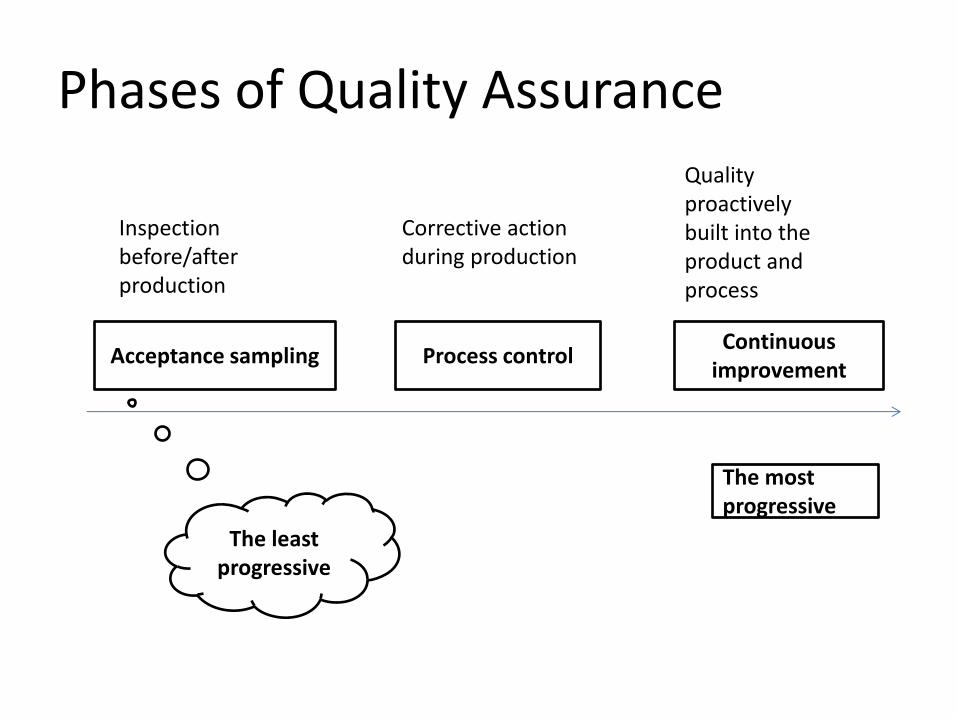
Phases of Quality Assurance
Acceptance sampling Process control Continuous
improvement
Inspection before/after production
Corrective action during production
Quality proactively built into the product and process
The most progressive
The least progressive
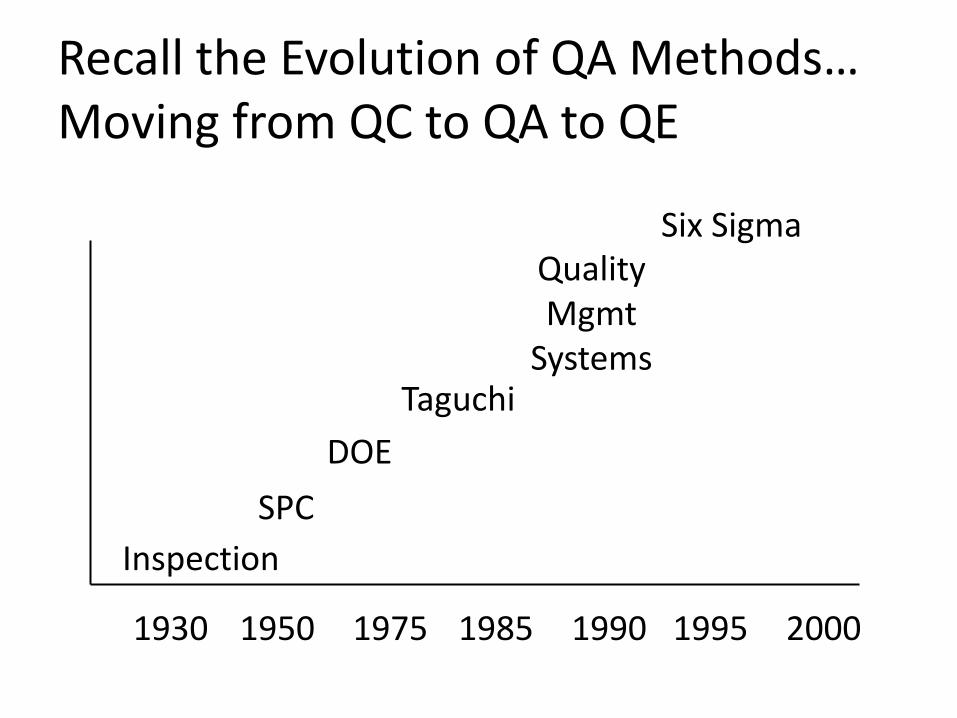
Recall the Evolution of QA Methods… Moving from QC to QA to QE
Inspection
SPC
DOE
Taguchi
Quality Mgmt
Systems
Six Sigma
2000 1995 1990 1985 1975 1930 1950
How to tell ‘TQM’
• Top Management’s direct involvement
• Strong customer orientation
• Problems solved by systematic methods
• Everyone participates
• Continuous improvement is the theme
TQM encourages problem solving at all levels
• A different management policy
• Appropriate organizational structure to put this into effect
• Use of the simple and advanced statistical tools
• Training at all levels
• The power to delegate to those who can make the necessary changes
TQM is not a collection of tools and techniques. It is a culture.
TQM is an attitude of mind based on pride in job, teamwork, and management commitment extending to all employees at all levels and in all departments
A TQM view: Quality Chains
• Throughout and beyond the organization a series of quality chains exist
• Quality chains exist within the organization also
• Chains may be broken by
One person, or
One equipment, not meeting the requirements of the customer—internal or external
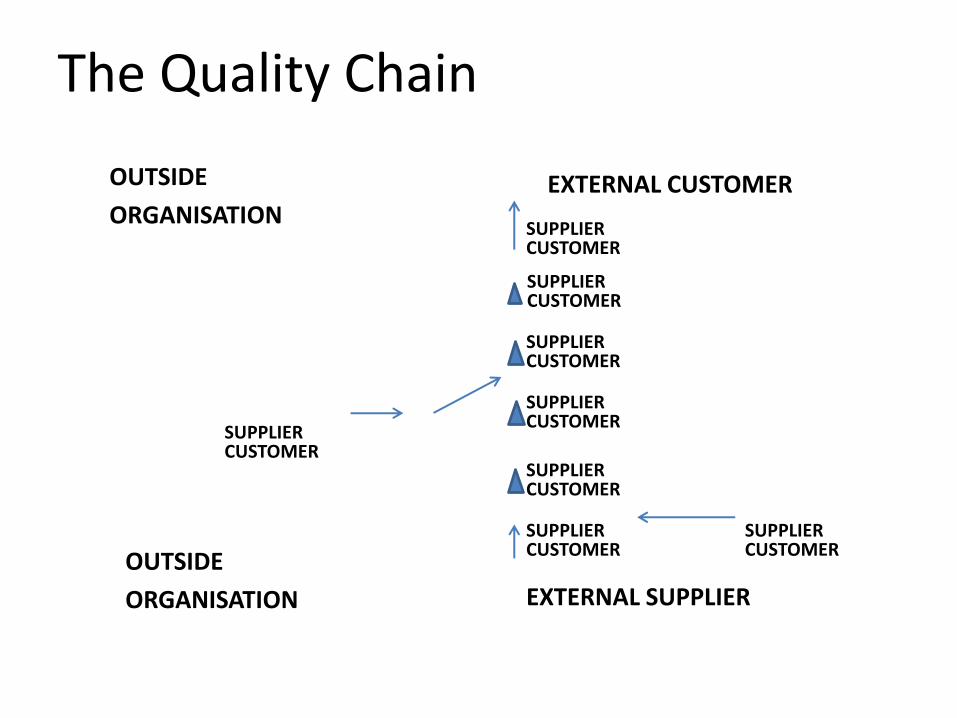
The Quality Chain
OUTSIDE
ORGANISATION
OUTSIDE
ORGANISATION
EXTERNAL CUSTOMER
EXTERNAL SUPPLIER
SUPPLIER CUSTOMER
SUPPLIER CUSTOMER
SUPPLIER CUSTOMER
SUPPLIER CUSTOMER
SUPPLIER CUSTOMER
SUPPLIER CUSTOMER
SUPPLIER CUSTOMER
SUPPLIER CUSTOMER
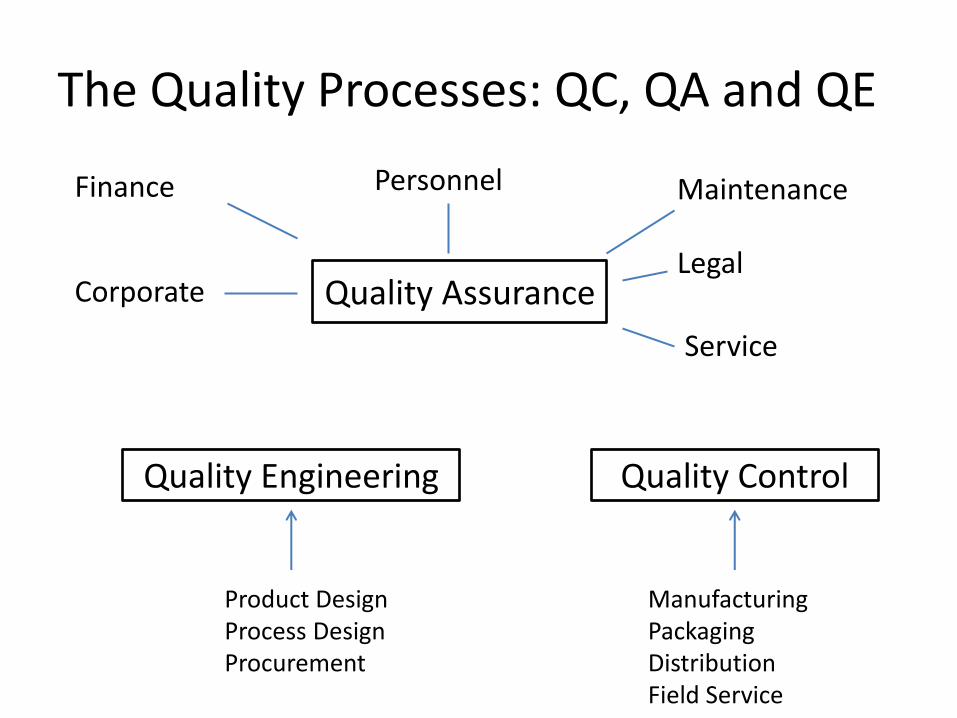
The Quality Processes: QC, QA and QE
Personnel Finance
Corporate
Maintenance
Legal
Service
Quality Assurance
Quality Engineering Quality Control
Product Design Process Design Procurement
Manufacturing Packaging Distribution Field Service
Quality Awards recognize good performance
Baldrige Award
Deming Prize
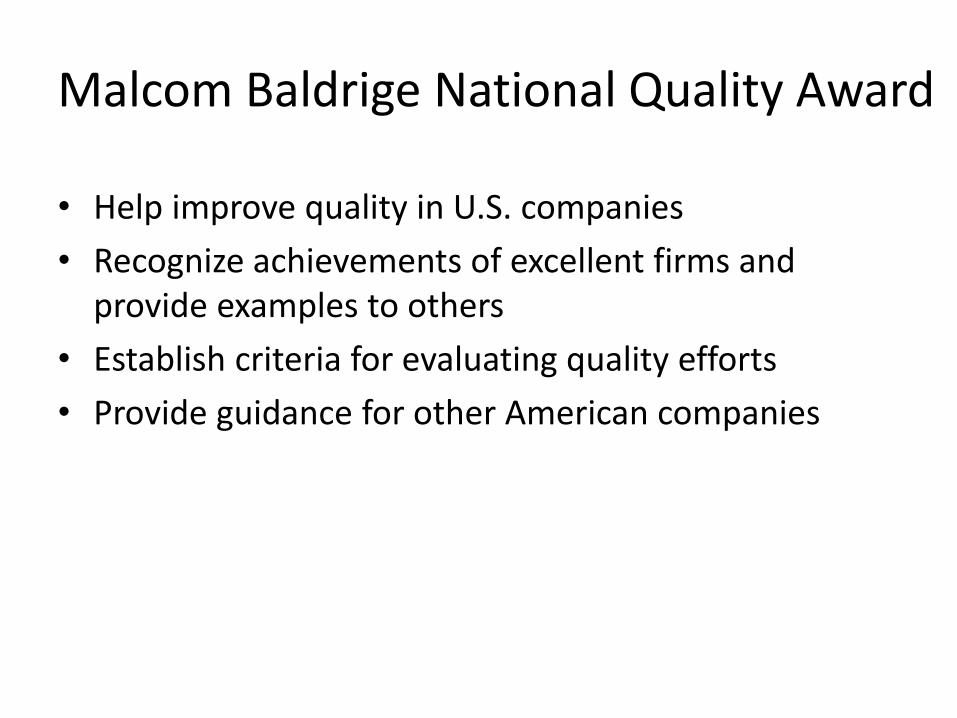
Malcom Baldrige National Quality Award
• Help improve quality in U.S. companies
• Recognize achievements of excellent firms and provide examples to others
• Establish criteria for evaluating quality efforts
• Provide guidance for other American companies
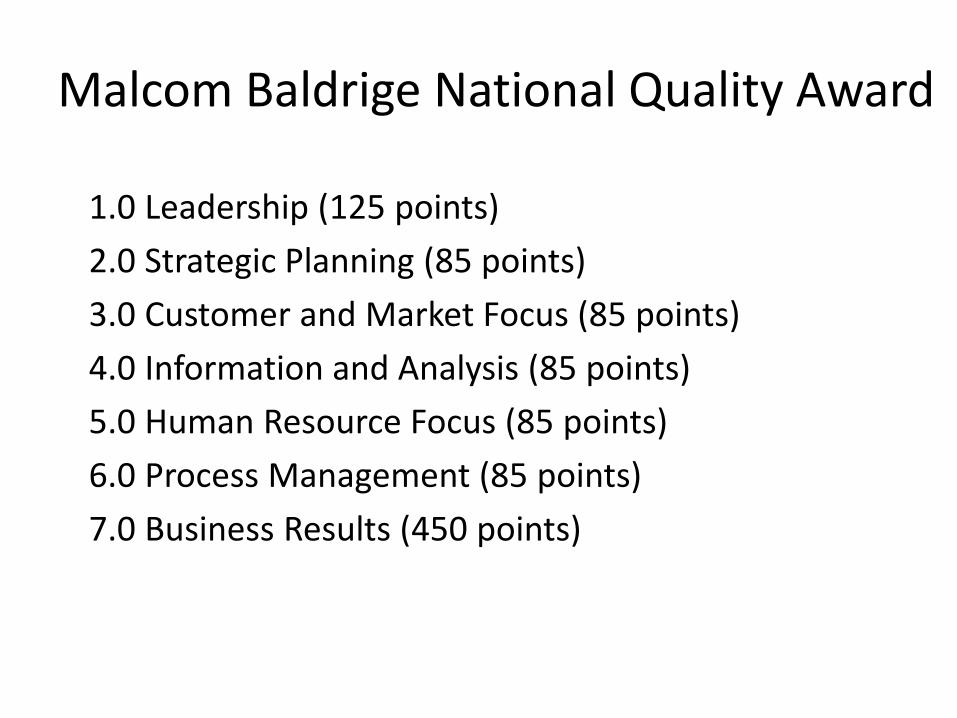
1.0 Leadership (125 points)
2.0 Strategic Planning (85 points)
3.0 Customer and Market Focus (85 points)
4.0 Information and Analysis (85 points)
5.0 Human Resource Focus (85 points)
6.0 Process Management (85 points)
7.0 Business Results (450 points)
Malcom Baldrige National Quality Award
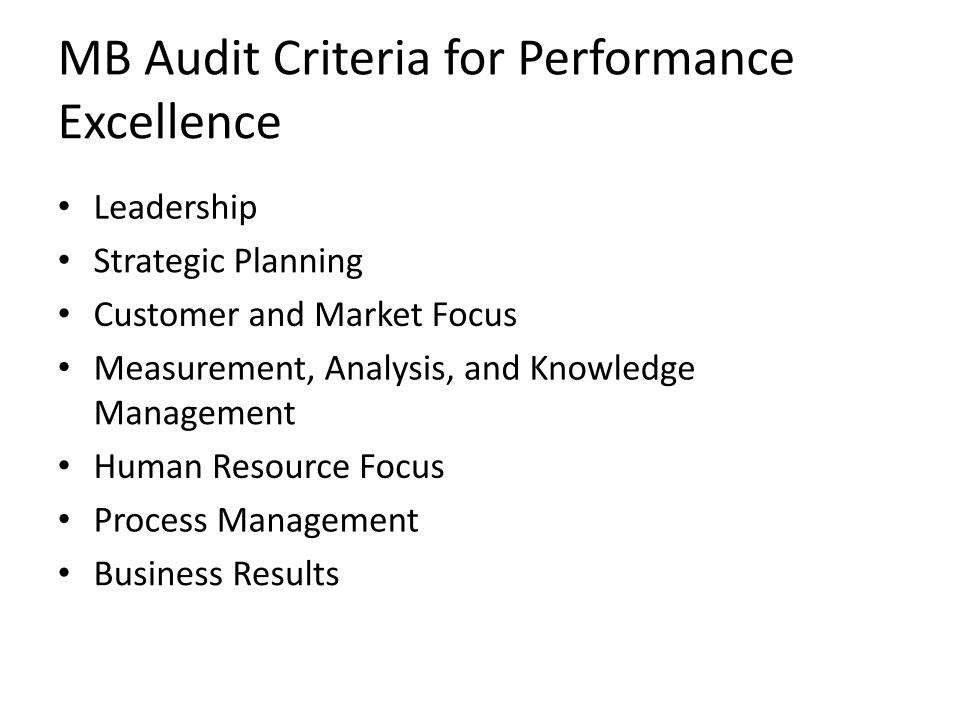
MB Audit Criteria for Performance Excellence
• Leadership
• Strategic Planning
• Customer and Market Focus
• Measurement, Analysis, and Knowledge Management
• Human Resource Focus
• Process Management
• Business Results
Benefits of Baldrige Competition
• Financial success
• Winners share their knowledge
• The process motivates employees
• The process provides a well-designed quality system
• The process requires obtaining data
• The process provides feedback
The Deming Prize
• Instituted 1951 by Union of Japanese Scientists and Engineers (JUSE)
• Several categories including prizes for individuals, factories, small companies, and Deming application prize
• American company winners include Florida Power & Light and AT&T Power Systems Division
The Deming Prize
• Honoring W. Edwards Deming
• Japan’s highly coveted award
• Main focus on statistical quality control
European Quality Award
Prizes intended to identify role models
• Leadership
• Customer focus
• Corporate social responsibility
• People development and involvement
• Results orientation
Other Quality Awards
• Canadian Awards for Business Excellence
• Australian Business Excellence Award
• Rajiv Gandhi Quality Award—patterned after Baldrige (TQM)
Contemporary Quality Philosophies and Management Strategies
• Total Quality Management (TQM)
• Quality Standards and Registration
ISO 9000 & QS 9000
• Just-in-time, Lean Manufacturing, Poka-Yoke, etc.
• Six Sigma- Black Belt Program
TQM was the first major QM initiative
• Top management’s direct involvement
• Strong customer orientation
• Systematic problem solving
• Companywide participation
• Continuous improvement is the theme
But!
• Quantification of incentives is missing in TQM
• Six Sigma is the extended QA paradigm
ISO 9000: 2000
• A big help in housekeeping in most organizations
• A Quality system standard adopted by International Organization for Standardization in 1987; revides in 1994 and 2000
• Technical specifications and criteria to be used as rules, guidelines, or definitions of characteristics to ensure that materials, products, processes, and services are fit for their purpose
Rationale for ISO 9000
• ISO 9000 defines quality system standards, based on the premise that certain generic characteristics of management practices can be standardized, and carefully managed quality system provides confidence that the out-puts will meet customer expectations and requirements.
Objectives of ISO Standards
• Achieve, maintain, and continuously improve product quality
• Improve quality of operations to continually meet customers’ and stakeholders needs
• Provide confidence to internal management and other employees that quality requirements are being fulfilled

Objectives of ISO Standards
• Provide confidence to customers and other stakeholders that quality requirements are being achieved
• Provide confidence that quality system requirements are fulfilled
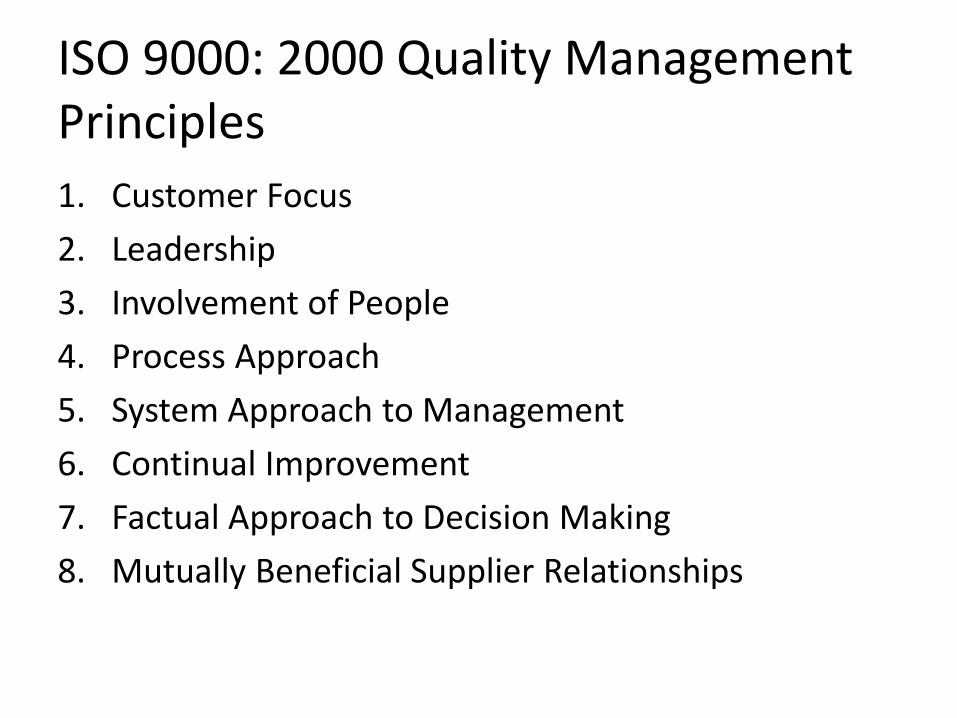
ISO 9000: 2000 Quality Management Principles
1. Customer Focus
2. Leadership
3. Involvement of People
4. Process Approach
5. System Approach to Management
6. Continual Improvement
7. Factual Approach to Decision Making
8. Mutually Beneficial Supplier Relationships
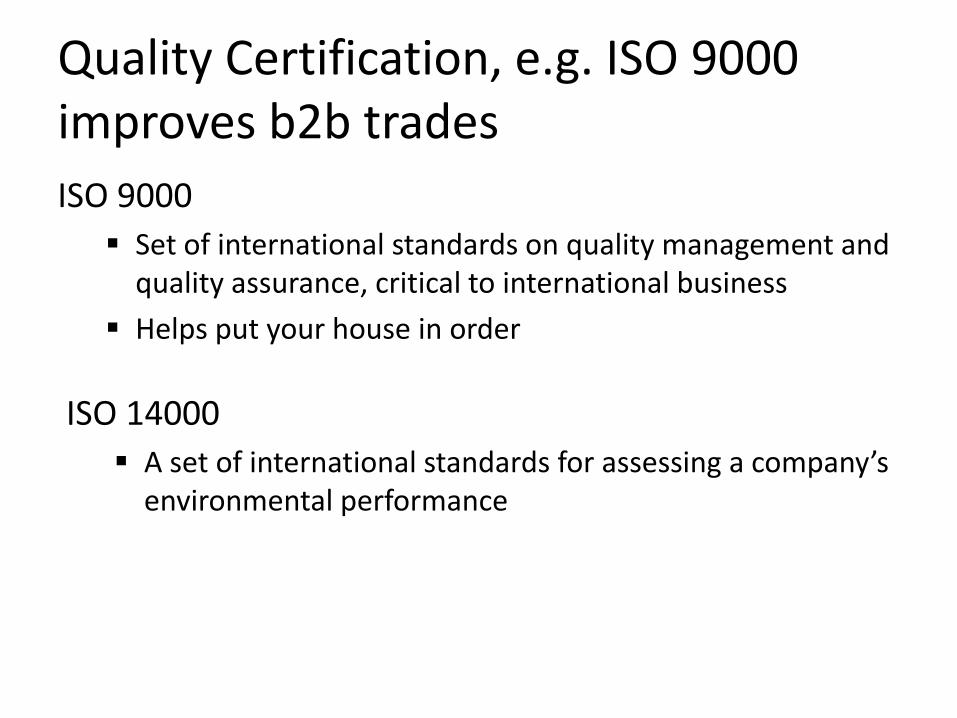
Quality Certification, e.g. ISO 9000 improves b2b trades
ISO 9000
Set of international standards on quality management and quality assurance, critical to international business
Helps put your house in order
ISO 14000
A set of international standards for assessing a company’s environmental performance
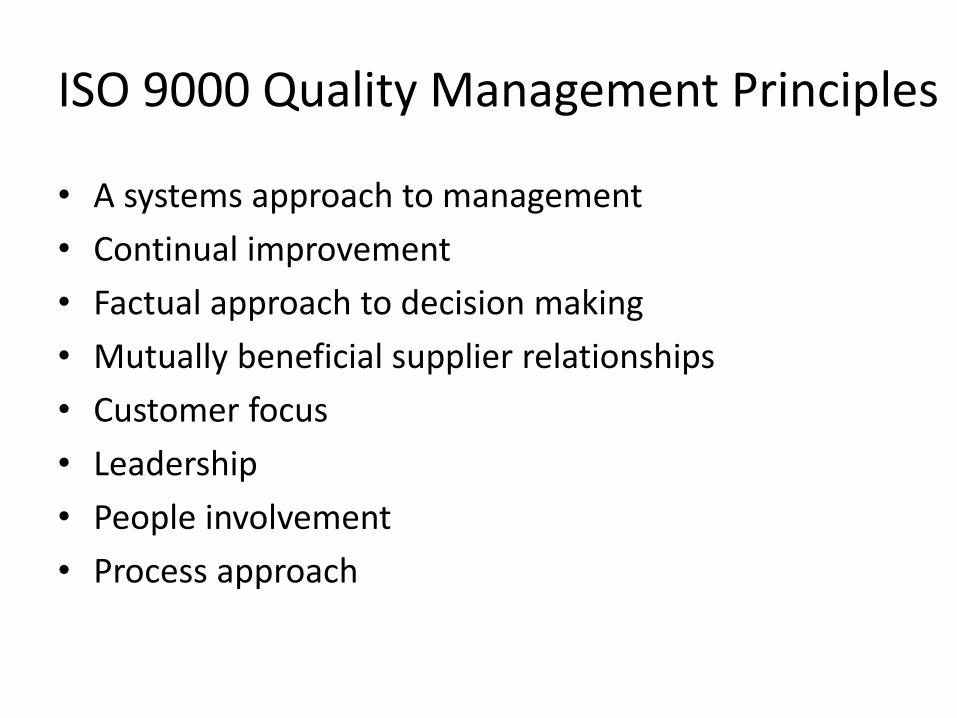
ISO 9000 Quality Management Principles
• A systems approach to management
• Continual improvement
• Factual approach to decision making
• Mutually beneficial supplier relationships
• Customer focus
• Leadership
• People involvement
• Process approach
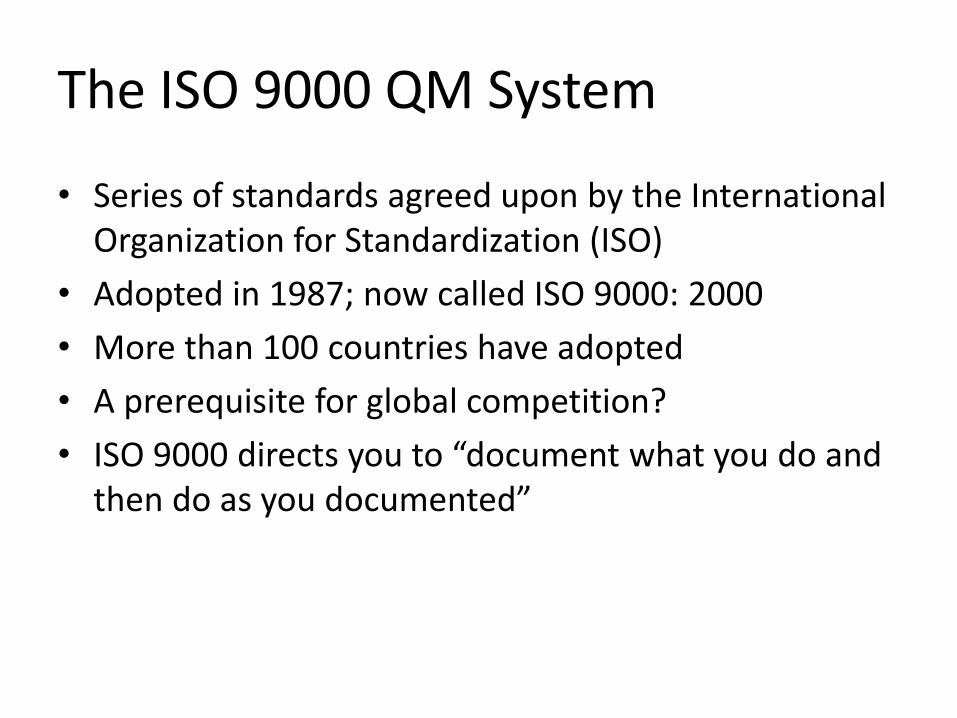
The ISO 9000 QM System
• Series of standards agreed upon by the International Organization for Standardization (ISO)
• Adopted in 1987; now called ISO 9000: 2000
• More than 100 countries have adopted
• A prerequisite for global competition?
• ISO 9000 directs you to “document what you do and then do as you documented”
Three parties in ISO Certification
1. First party: A firm (the supplier) audits itself against ISO 9000 standards
2. Second party: A customer audits its supplier
3. Third party: A “qualified” national or international standards or certifying agency serves as auditor the basis for getting ISO 9000
Objectives of ISO Standards
• Provide confidence to customers and other stakeholders that quality requirements are being achieved
• Provide confidence that quality system requirements are fulfilled
ISO 14000
• ISO 14000 – A set of international standards for assessing a company’s environmental performance
• Standards in three major areas
Management systems
Operations
Environmental systems
ISO 14000
• Management systems
Systems development and integration of environmental responsibilities into business planning
• Operations
Consumption of natural resources and energy
• Environmental systems
Measuring, assessing and managing omissions, effluents, and other waste
Getting Started to improve Quality
• The most effective approach is to launch DMAIC projects
• Recognize customers: discover their needs and expectations
• Set performance standards that meet customer requirements
• Control processes and improve their capability
• Establish quality management systems
• Set quality policy, motivate through leadership and equip people to achieve
• Empower everyone to act for quality improvement
Doing “QFD” (Quality Function Deployment) can be a good start
• Captures the Customer’s voice
• QFD Facilities
Finding what customers want
Comparisons to competitors
Setting target values for operating requirements—the product or service you are going to produce
How you capture the customer’s wants and preferences
• QFD Provides Structure for Integrating Product and Process Design
• Multiple Matrix Representation (House of Quality) Walls: customer requirements (what’s): competitive evaluation
Ceiling: operating requirements (how’s)
Interior: correlation between what’s and how’s
Roof: correlation among how’s
Basement: target values for how’s
Foundation: competitive evaluation of how’s
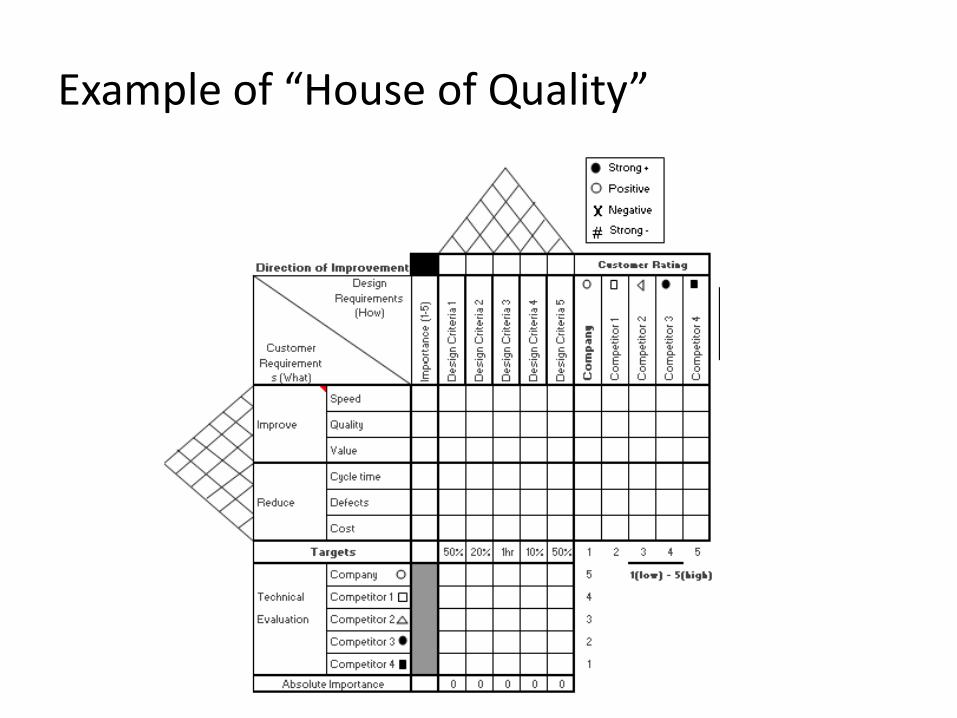
Example of “House of Quality”
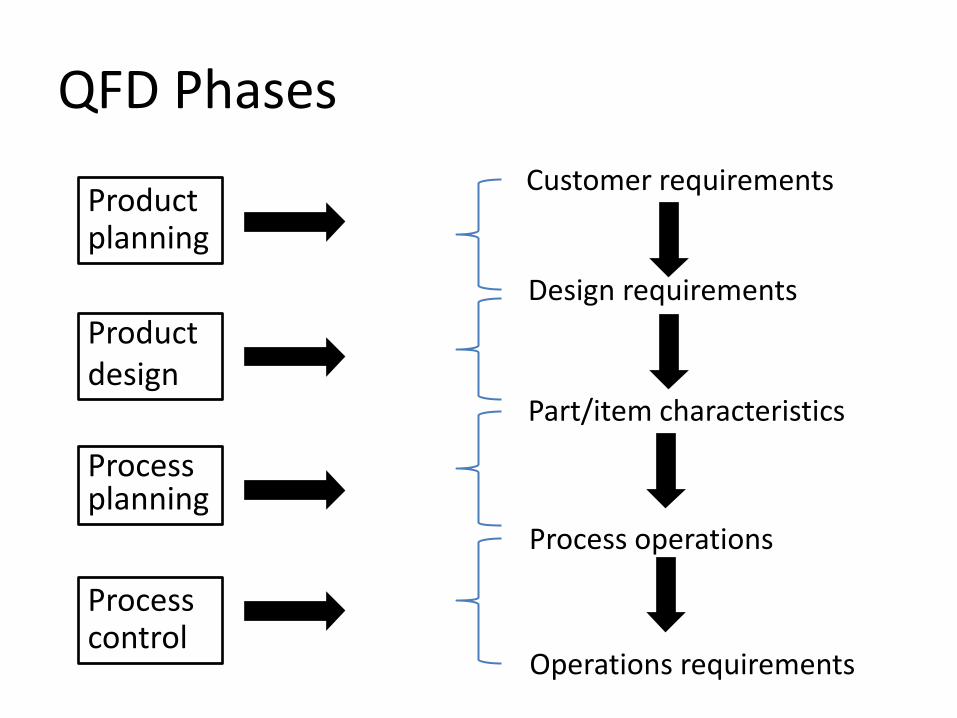
QFD Phases
Product planning
Product design
Process planning
Process control
Customer requirements
Design requirements
Part/item characteristics
Process operations
Operations requirements
Cost of Mismanaging Quality is Enormous—it can set the stage for improvement
• 15-30% manufacturing sales revenue goes in Failing to satisfy customer’s needs and expectations
Not doing it right the first time – re-work and returns
• Up to 40% service effort goes in extra work to fix problems
• Mismanagement pushes away new customers
• Intangible losses are not quantifiable
Commitment to quality is easy to detect
• It shows on the shop floor, in hospital wards, in classrooms, in customer interaction…
• Things happen: Material problems are corrected with suppliers
equipment faults are put right by improved maintenance programs or replacement
people are trained
partnerships are built
continuous improvement is observable
business grows
Some distinctions
• TQM is a culture not a program
• ISO 9000 is a set of guidelines to conduct all quality-related activities
• Six Sigma is heavy on techniques and results; it is a business process
Competitive Positioning
• Must decide first how you want to complete: Low price or differentiation
Target market broad or niche marketing
Assess strength of buyers, suppliers, competition
• Determine how the value added will be distributed among suppliers, you, and your customers
• TQM starts with identifying needs and expectations of targeted potential customers
The TQM Approach to competitive positioning
1. Find out what the customer wants
2. Design a product or service that meets or exceeds customer wants
3. Design processes that facilitates doing the job right the first time
4. Keep track of the results
5. Extend these concepts to suppliers
Elements of TQM are several
• Continual improvement
• Competitive benchmarking
• Employee empowerment
• Team approach
• Decisions based on facts
• Knowledge of tools
• Supplier quality
• Champion
• Quality at the source
• Suppliers
Continuous Improvement
• Philosophy that seeks to make never-ending improvements to the process of converting inputs into outputs.
• Kaizen: Japanese word for continuous improvement.
Targeting attainment of Quality at the Source
The philosophy of making each worker responsible for the quality of his or her work.
1. Steam Turbine Example 2. Parachute Factory
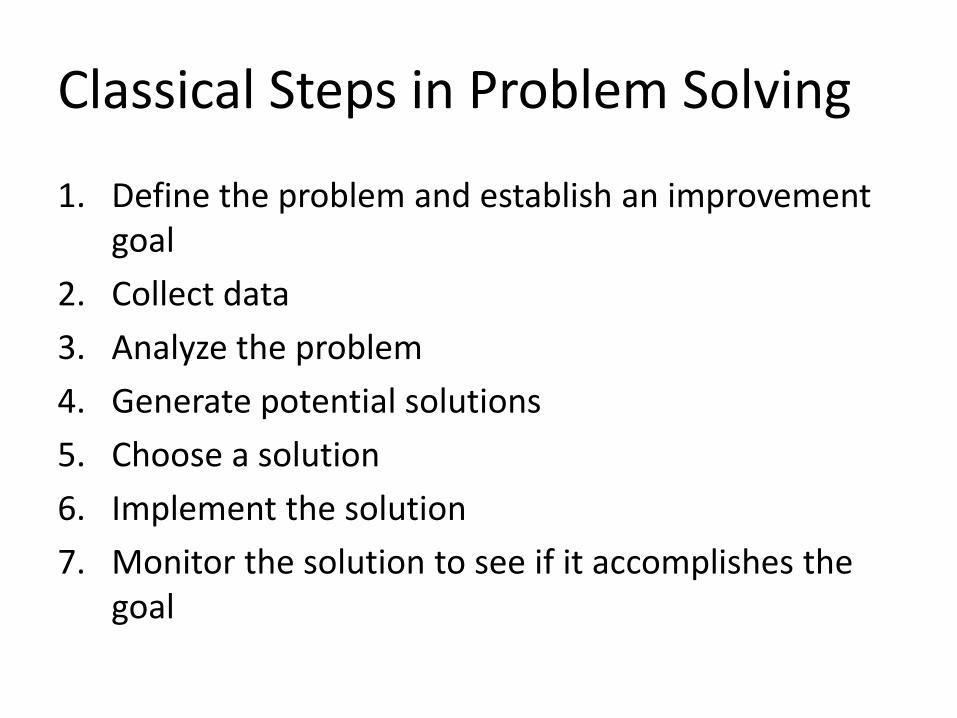
Classical Steps in Problem Solving
1. Define the problem and establish an improvement goal
2. Collect data
3. Analyze the problem
4. Generate potential solutions
5. Choose a solution
6. Implement the solution
7. Monitor the solution to see if it accomplishes the goal
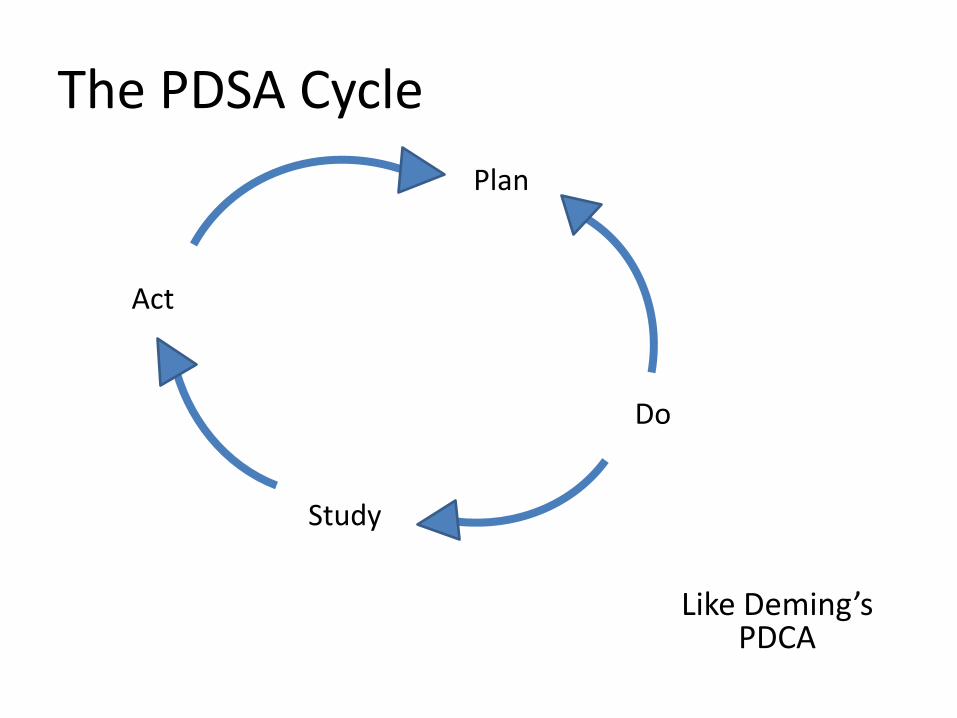
The PDSA Cycle
Like Deming’s PDCA
Act
Plan
Do
Study
Process Improvement
• Process Improvement: A systematic approach to improving a process
• Process mapping
• Analyze the process
• Redesign the process
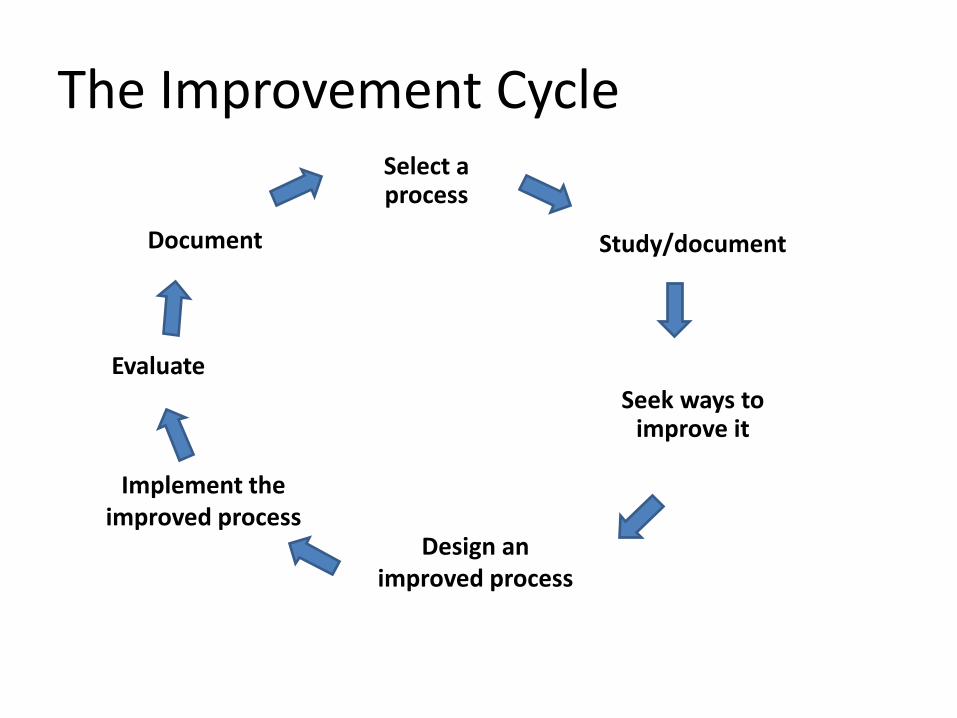
The Improvement Cycle Select a process
Study/document
Seek ways to improve it
Design an improved process
Implement the improved process
Evaluate
Document
Six Sigma provides a much more powerful framework for quality improvement -- DMAIC
Process Improvement and Tools
Process improvement – a systematic approach to improving a process
Process mapping
Analyze the process
Redesign the process
Tools
There are a number of tools that can be used for problem solving and process improvement
Tools aid in data collection and interpretation, and provide the basis for decision making
Basic TQM Tools
• Flowcharts
• Check sheets
• Histograms
• Pareto charts
• Scatter diagrams
• Control charts
• Cause-and-effect diagrams
• Run charts
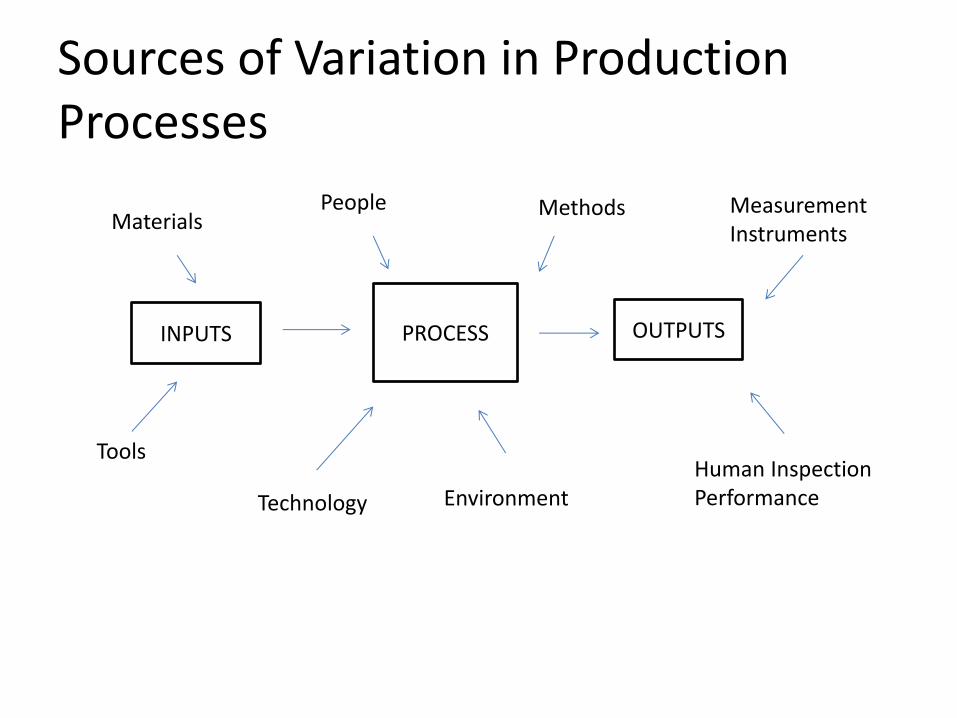
Sources of Variation in Production Processes
INPUTS OUTPUTS PROCESS
People Methods Measurement Instruments
Human Inspection Performance Environment Technology
Tools
Materials
Variation
• Many sources of uncontrollable variation exist (common causes)
• Special assigned causes of variation can be recognized and controlled
• Failure to understand these differences can increase variation in a system

7 Tools for TQM and Continuous Improvement Tool # 1 Flow Chart – Map the Process first!
Material Received from
Supplier Inspect
Materials for Defect
Defects found?
No Continue
Return to Supplier for
Credit
Yes
A Flowchart Can be used to find Quality problems
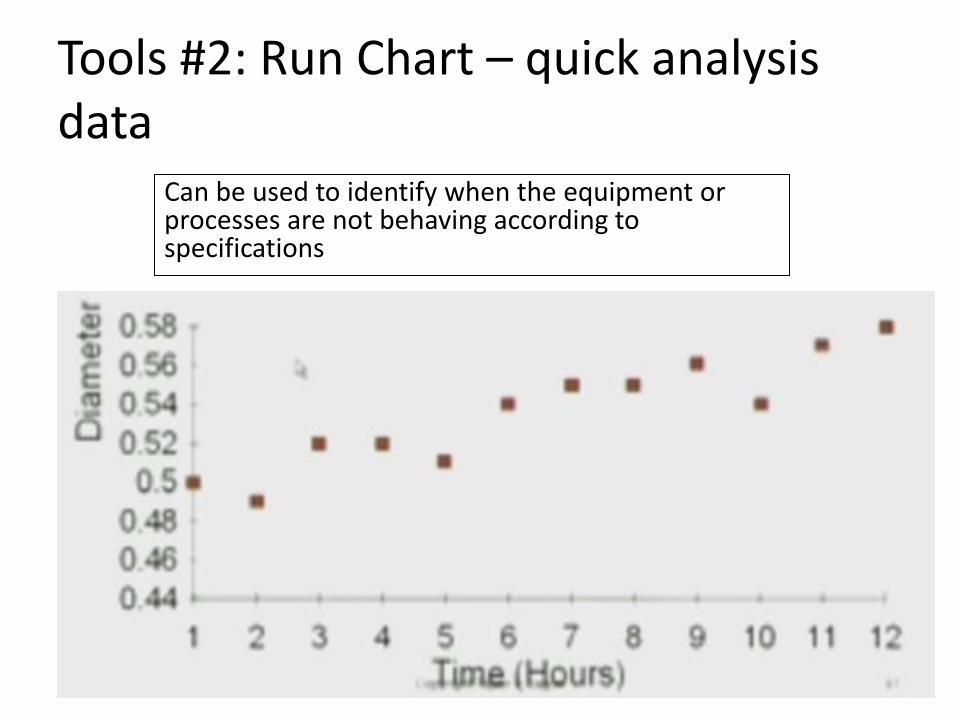
Tools #2: Run Chart – quick analysis data
Can be used to identify when the equipment or processes are not behaving according to specifications
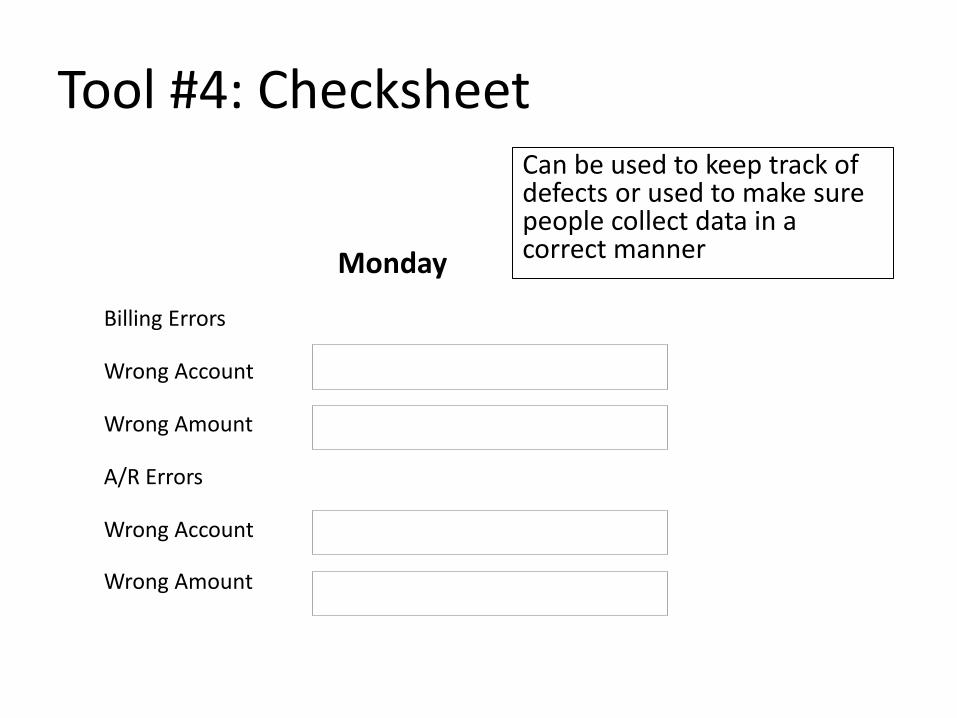
Tool #4: Checksheet Can be used to keep track of defects or used to make sure people collect data in a correct manner Monday
Billing Errors
Wrong Account
Wrong Amount
A/R Errors
Wrong Account
Wrong Amount
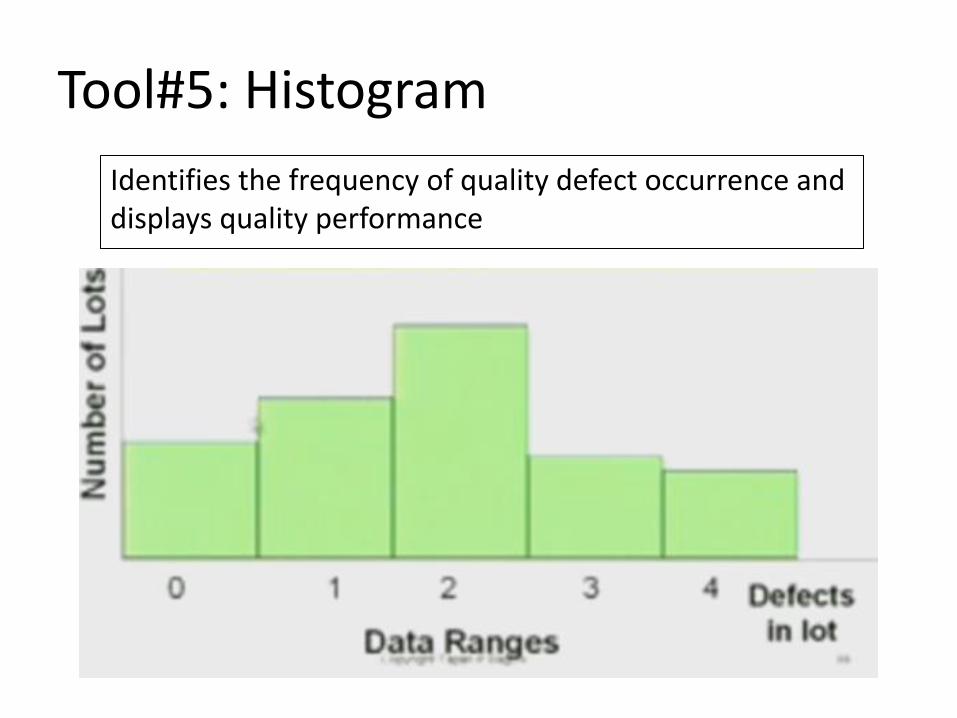
Tool#5: Histogram
Identifies the frequency of quality defect occurrence and displays quality performance
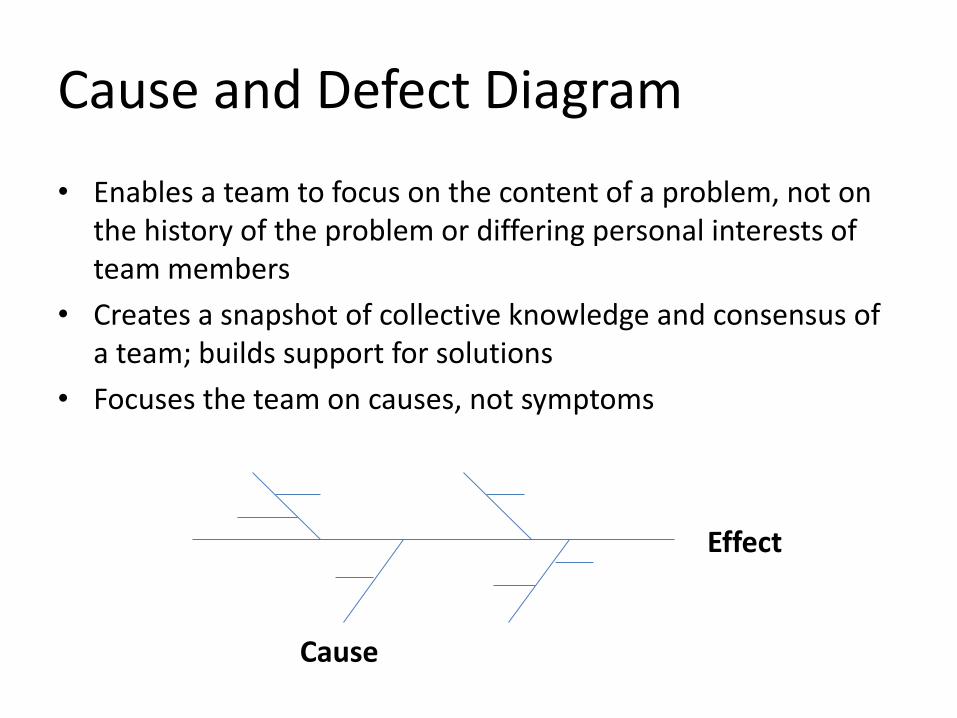
Cause and Defect Diagram
• Enables a team to focus on the content of a problem, not on the history of the problem or differing personal interests of team members
• Creates a snapshot of collective knowledge and consensus of a team; builds support for solutions
• Focuses the team on causes, not symptoms
Effect
Cause
Root Cause Analysis
• Root causes – “that condition (or interrelated set of conditions) having allowed or caused a defect to occur, which once corrected properly, permanently prevents recurrence of the defect in the same, or subsequent, product or service generated by the process.”
• “5 Why” technique
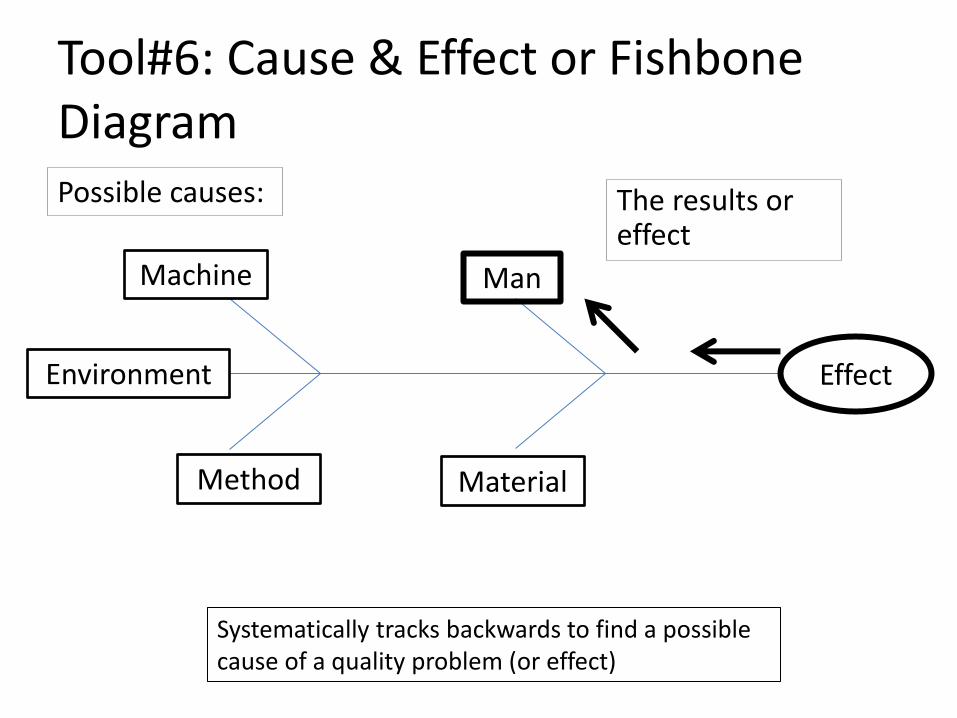
Tool#6: Cause & Effect or Fishbone Diagram Possible causes: The results or
effect
Systematically tracks backwards to find a possible cause of a quality problem (or effect)
Man
Effect
Machine
Material Method
Environment
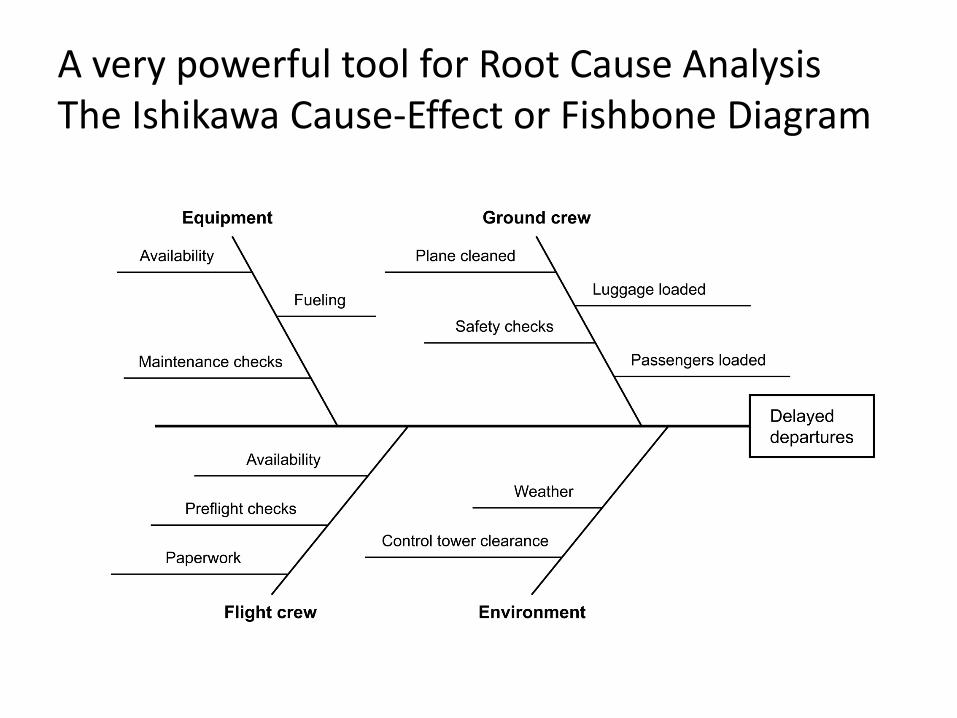
A very powerful tool for Root Cause Analysis The Ishikawa Cause-Effect or Fishbone Diagram
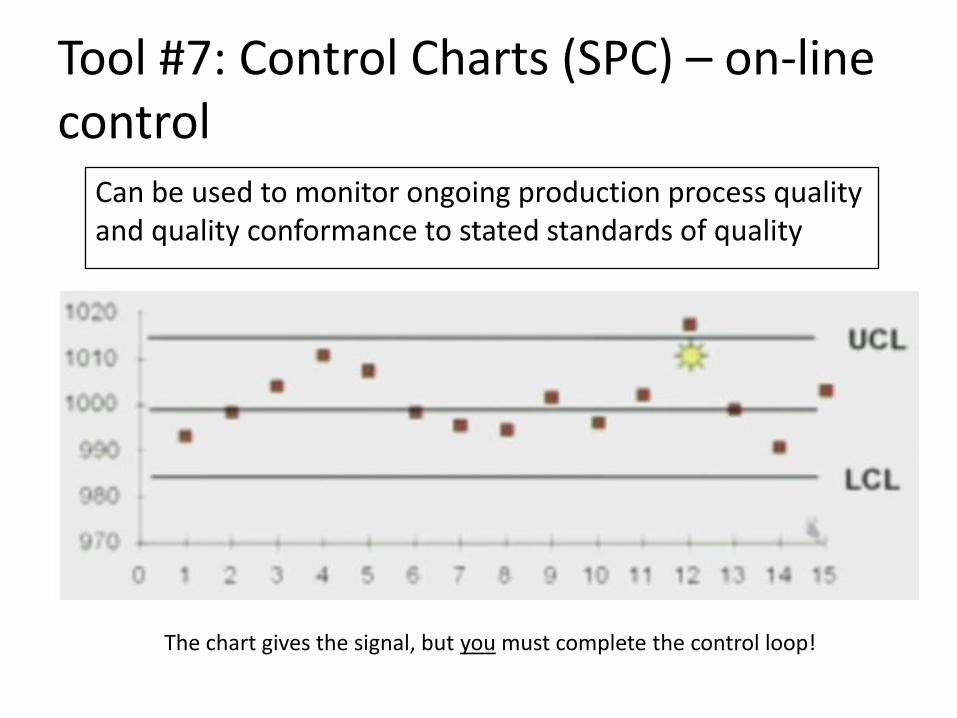
Tool #7: Control Charts (SPC) – on-line control
Can be used to monitor ongoing production process quality and quality conformance to stated standards of quality
The chart gives the signal, but you must complete the control loop!
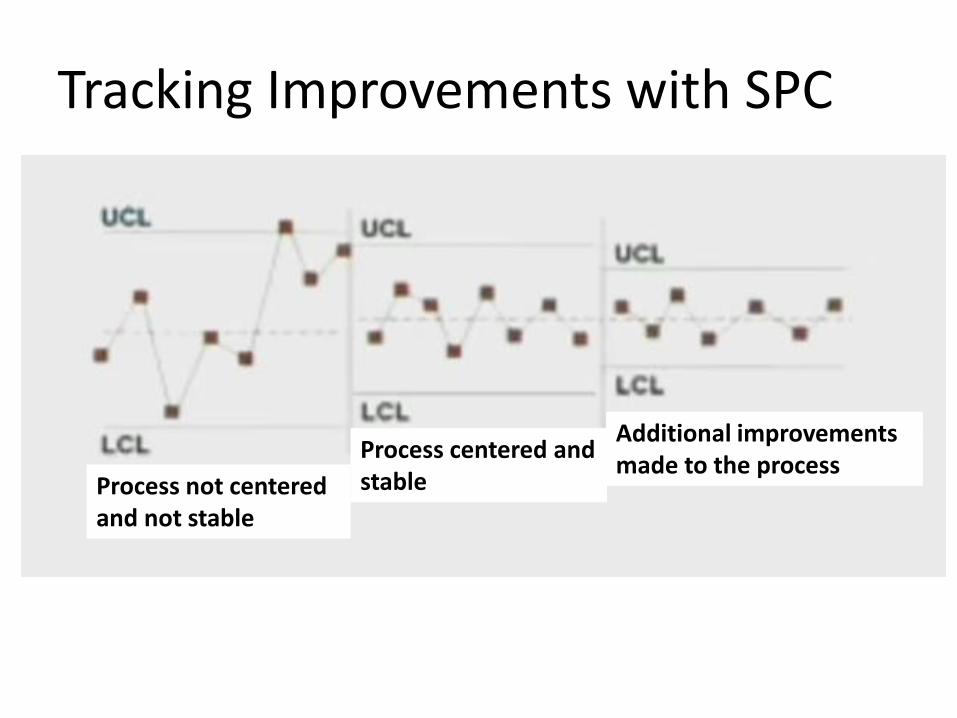
Tracking Improvements with SPC
Process not centered and not stable
Process centered and stable
Additional improvements made to the process
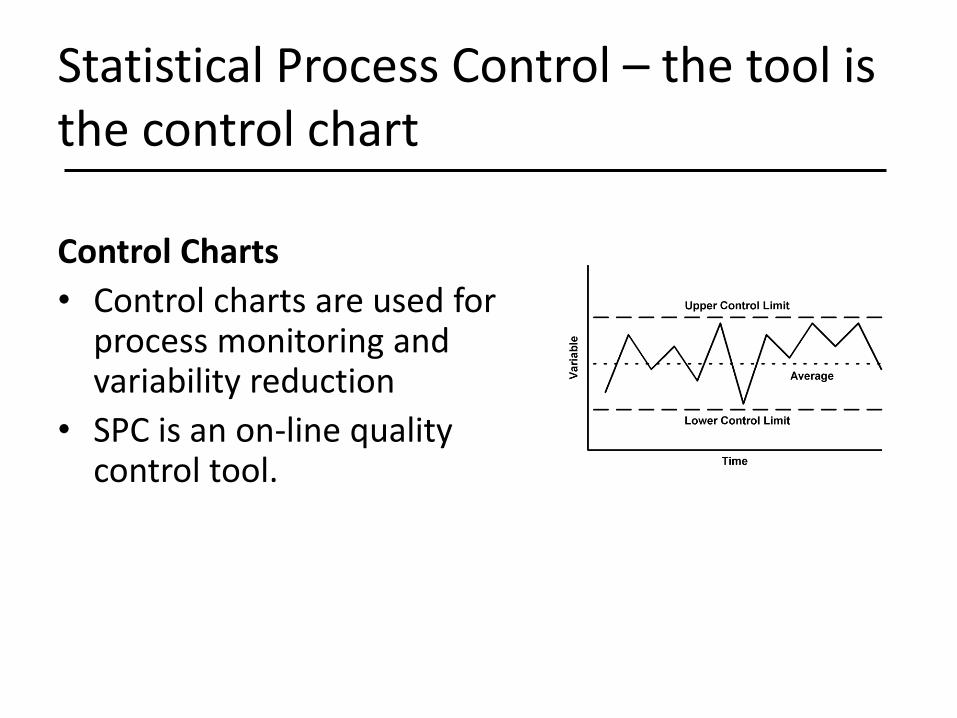
Statistical Process Control – the tool is the control chart
Control Charts
• Control charts are used for process monitoring and variability reduction
• SPC is an on-line quality control tool.
Soft Methods for Generating Ideas to impact quality problems
• Brainstorming
• Quality Circles
• Interviewing
• Benchmarking
• 5W2H
Quality Circles
• Team approach – a team is formed to explore solutions
• The facilitator encourages idea generation
• Good people skills is critical
• Works well in Eastern cultures
Methods for Generating Solutions
Brainstorming: Technique for generating a free flow of ideas to solve a problem
Quality Circles:
Groups of workers who voluntarily meet to discuss ways of improving products or process
The circle comprises a number of workers who get together periodically to discuss ways of improving products and processes
Quality circles are usually less structured and more informal than taskforces entrusted with a project
Benchmarking – a source of good ideas • Involves identifying companies or other organizations that are
best at something and studying how they do it, to learn how to improve your operation
• The other organizations need not be in the same line of business as yours
• Xerox used a mail-order company, L L Bean, to benchmark order filling. Others are …
1. American Express is well-known for its ability to get customers to pay up quickly.
2. Disney World: for its employees commitment.
3. Federal Express: for its speed
4. McDonald’s: for its consistency.
5. Xerox: for its benchmarking techniques.
Benchmarking Process
• Identify a critical process that needs improving
• Identify an organization that excels in this process
• Contact that organization
• Analyze the data
• Improve the critical process
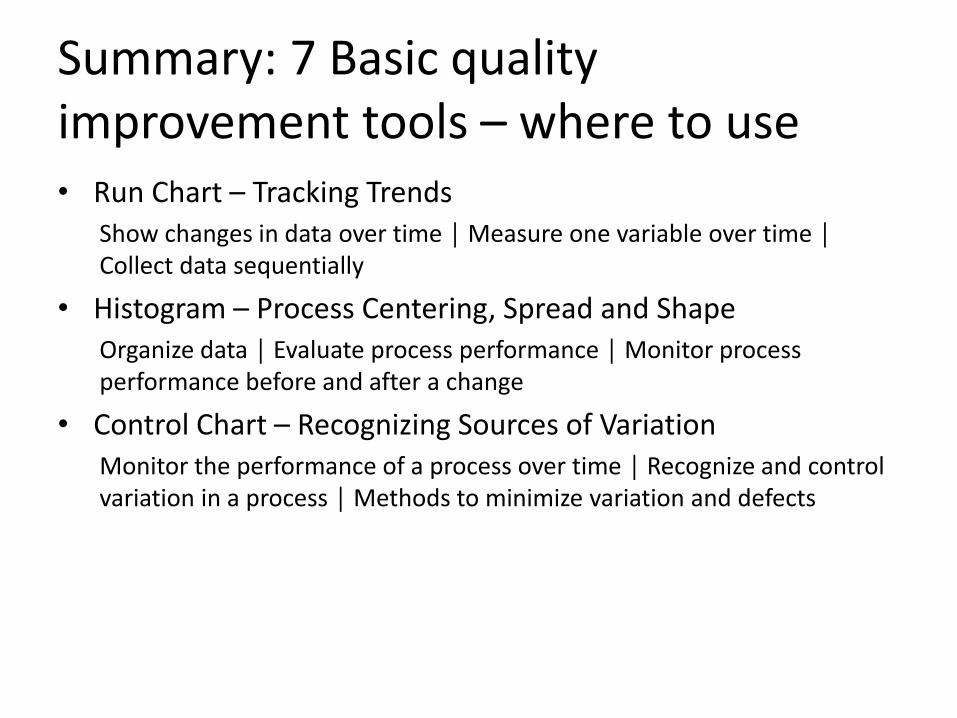
Summary: 7 Basic quality improvement tools – where to use • Run Chart – Tracking Trends
Show changes in data over time │ Measure one variable over time │ Collect data sequentially
• Histogram – Process Centering, Spread and Shape Organize data │ Evaluate process performance │ Monitor process performance before and after a change
• Control Chart – Recognizing Sources of Variation Monitor the performance of a process over time │ Recognize and control variation in a process │ Methods to minimize variation and defects
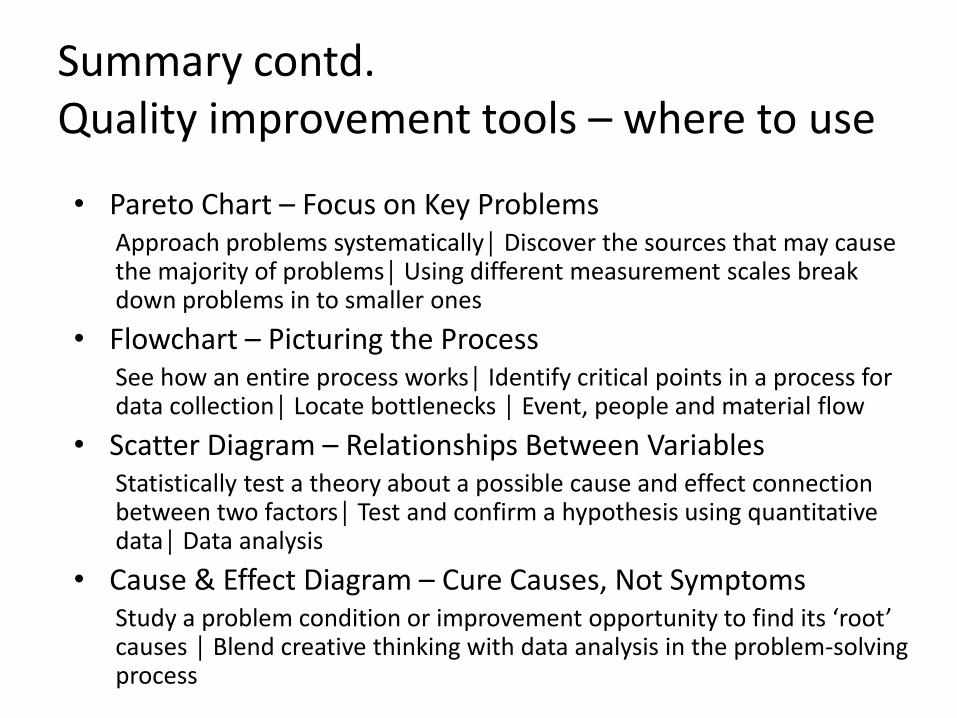
Summary contd. Quality improvement tools – where to use
• Pareto Chart – Focus on Key Problems Approach problems systematically│ Discover the sources that may cause the majority of problems│ Using different measurement scales break down problems in to smaller ones
• Flowchart – Picturing the Process See how an entire process works│ Identify critical points in a process for data collection│ Locate bottlenecks │ Event, people and material flow
• Scatter Diagram – Relationships Between Variables Statistically test a theory about a possible cause and effect connection between two factors│ Test and confirm a hypothesis using quantitative data│ Data analysis
• Cause & Effect Diagram – Cure Causes, Not Symptoms Study a problem condition or improvement opportunity to find its ‘root’ causes │ Blend creative thinking with data analysis in the problem-solving process
To control, you have to measure!
Discrimination
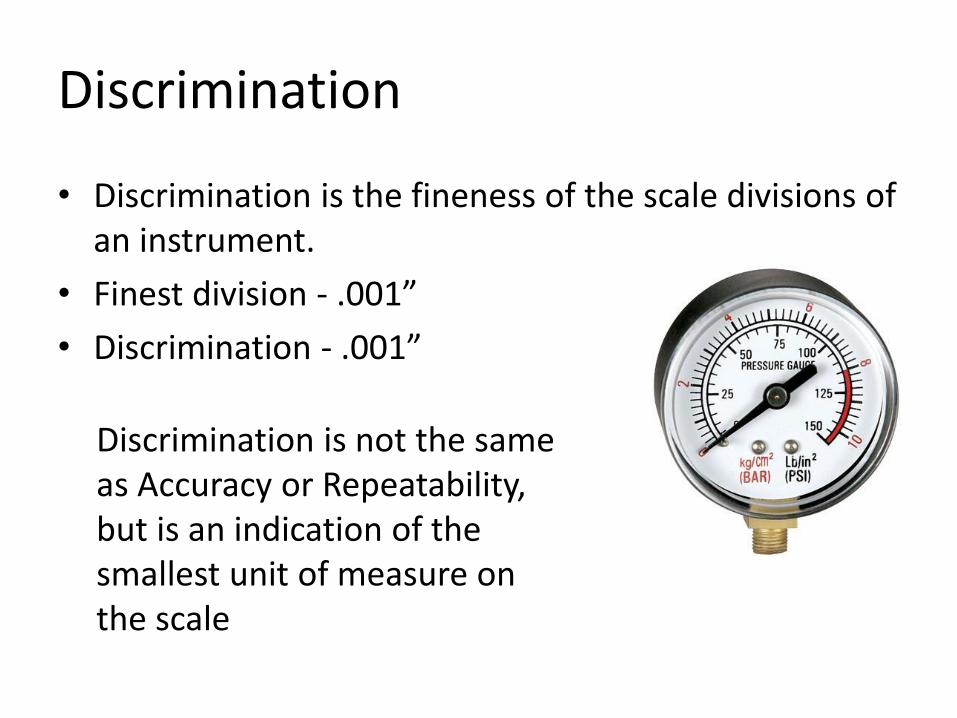
• Discrimination is the fineness of the scale divisions of an instrument.
• Finest division - .001”
• Discrimination - .001”
Discrimination is not the same as Accuracy or Repeatability, but is an indication of the smallest unit of measure on the scale
Calibration Plot
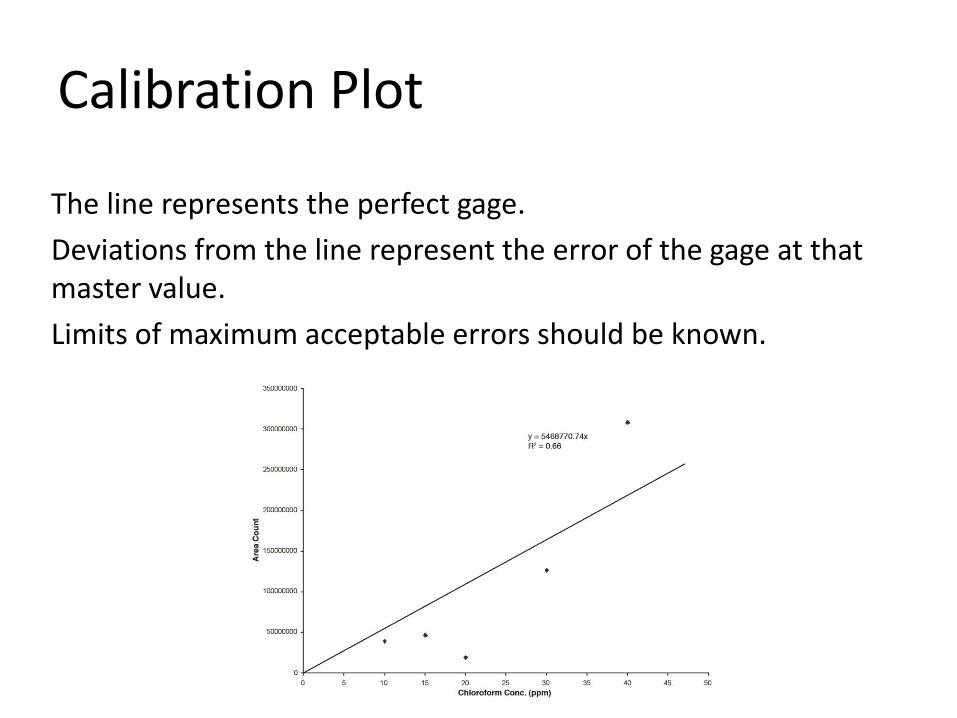
The line represents the perfect gage.
Deviations from the line represent the error of the gage at that master value.
Limits of maximum acceptable errors should be known.
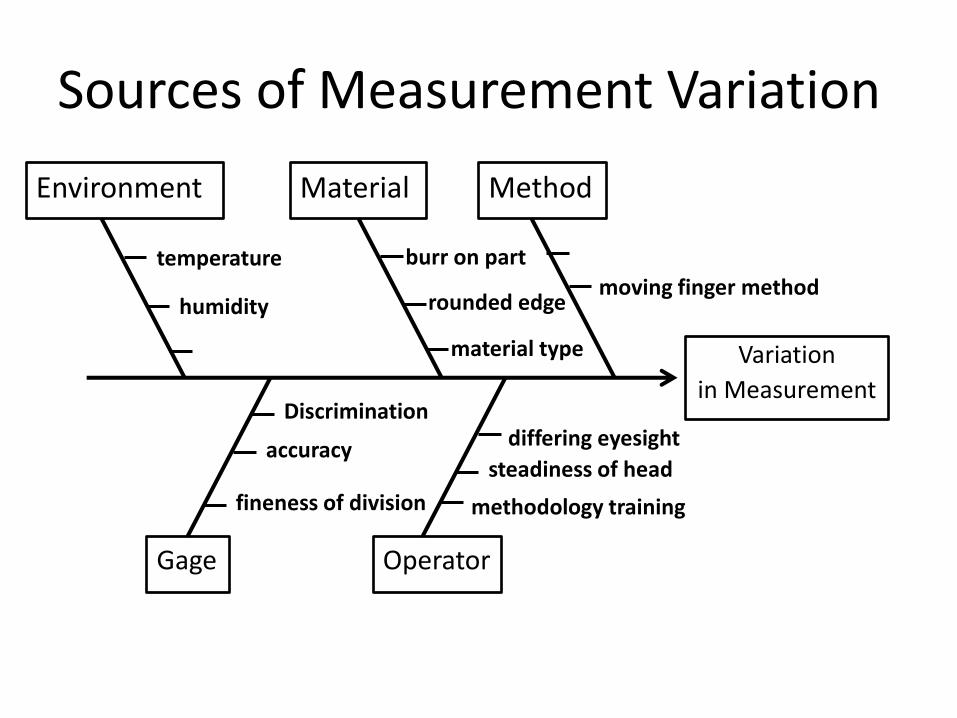
Sources of Measurement Variation
Environment Material Method
Variation
in Measurement
Gage Operator
temperature
humidity
burr on part
rounded edge
material type
moving finger method
differing eyesight
steadiness of head accuracy
methodology training fineness of division
Discrimination
Terminology
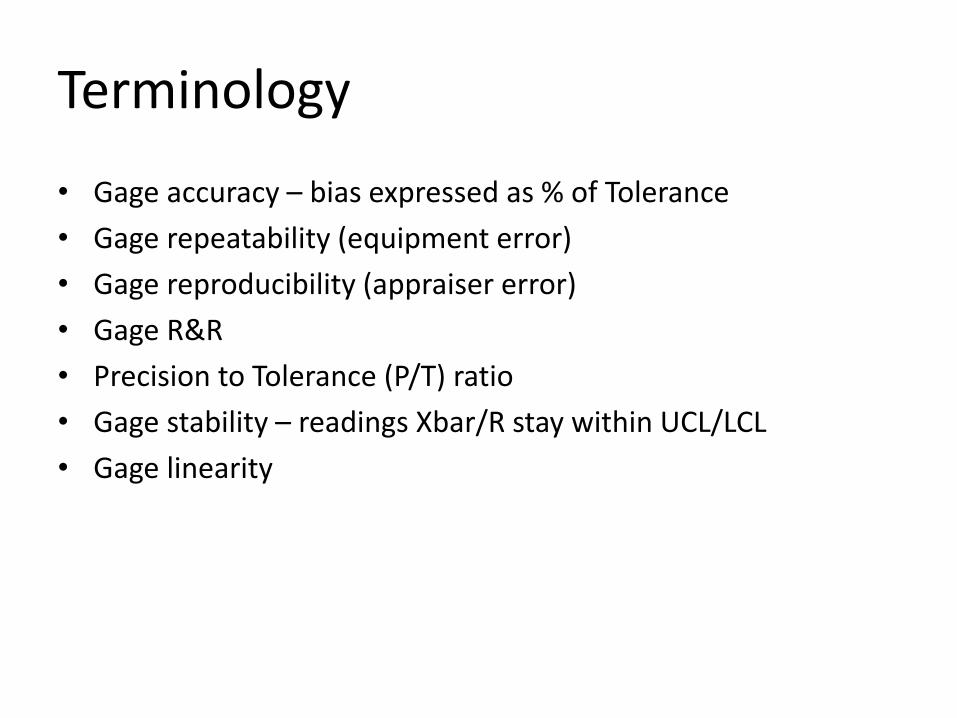
• Gage accuracy – bias expressed as % of Tolerance
• Gage repeatability (equipment error)
• Gage reproducibility (appraiser error)
• Gage R&R
• Precision to Tolerance (P/T) ratio
• Gage stability – readings Xbar/R stay within UCL/LCL
• Gage linearity
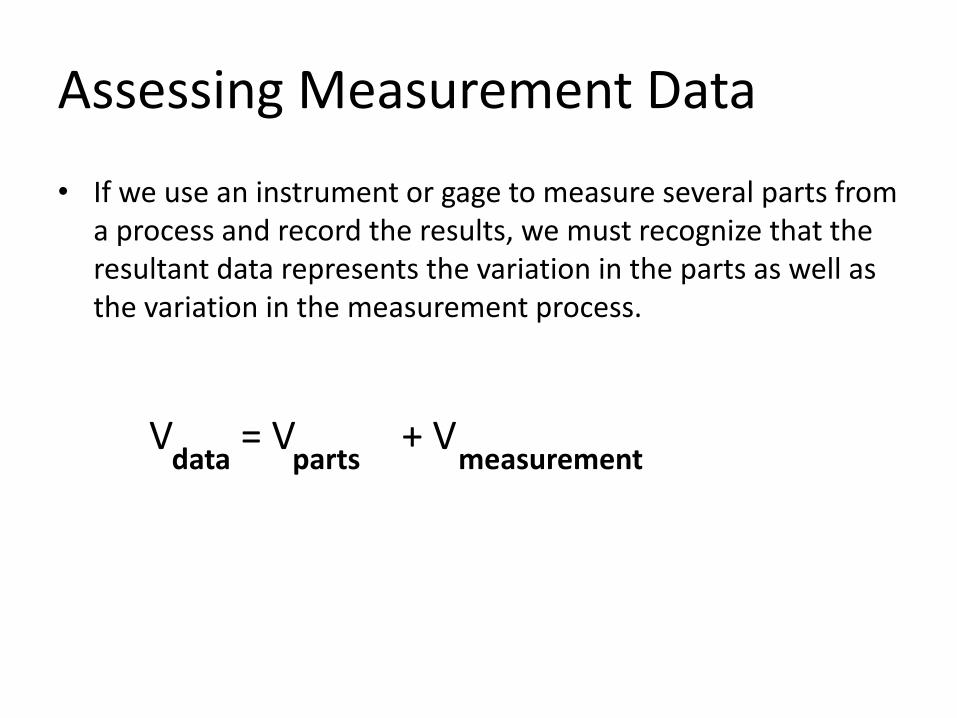
Assessing Measurement Data
• If we use an instrument or gage to measure several parts from a process and record the results, we must recognize that the resultant data represents the variation in the parts as well as the variation in the measurement process.
V = V + V data parts measurement
Interpretation?
Here Operator B has a greater average range than A. This means that his repeatability is worse than A. We should investigate by focussing on the method that B is using in comparison to A. How can we get B to be as repeatable as A?
Gage R&R Studies
Gage repeatability and reproducibility (R&R) studies involve breaking the total measurement variability or “gage variability” into two portions:
• repeatability is the basic inherent precision of the gage
• reproducibility is the variability due to different operators using the gage.
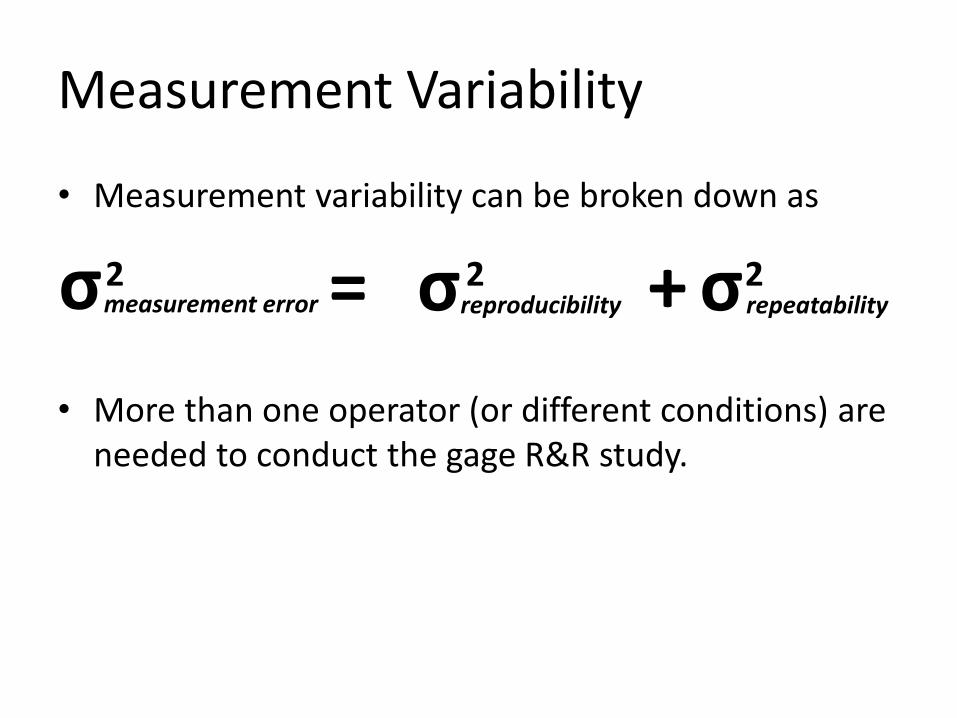
Measurement Variability
• Measurement variability can be broken down as
• More than one operator (or different conditions) are needed to conduct the gage R&R study.
repeatability reproducibility measurement error = σ σ + 2 2 2 σ
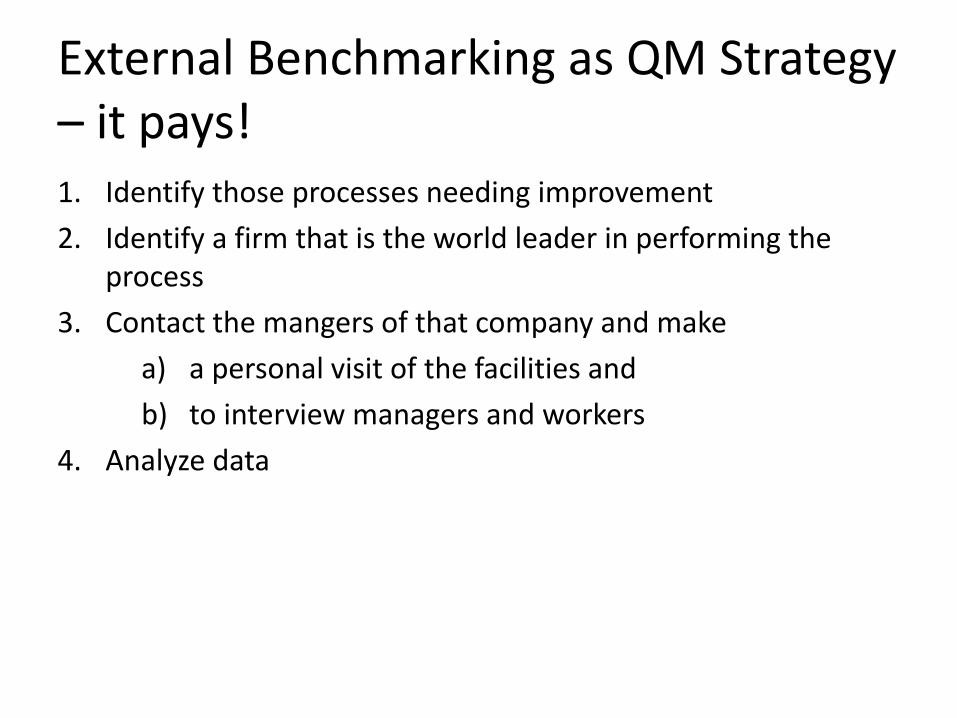
External Benchmarking as QM Strategy – it pays! 1. Identify those processes needing improvement
2. Identify a firm that is the world leader in performing the process
3. Contact the mangers of that company and make
a) a personal visit of the facilities and
b) to interview managers and workers
4. Analyze data
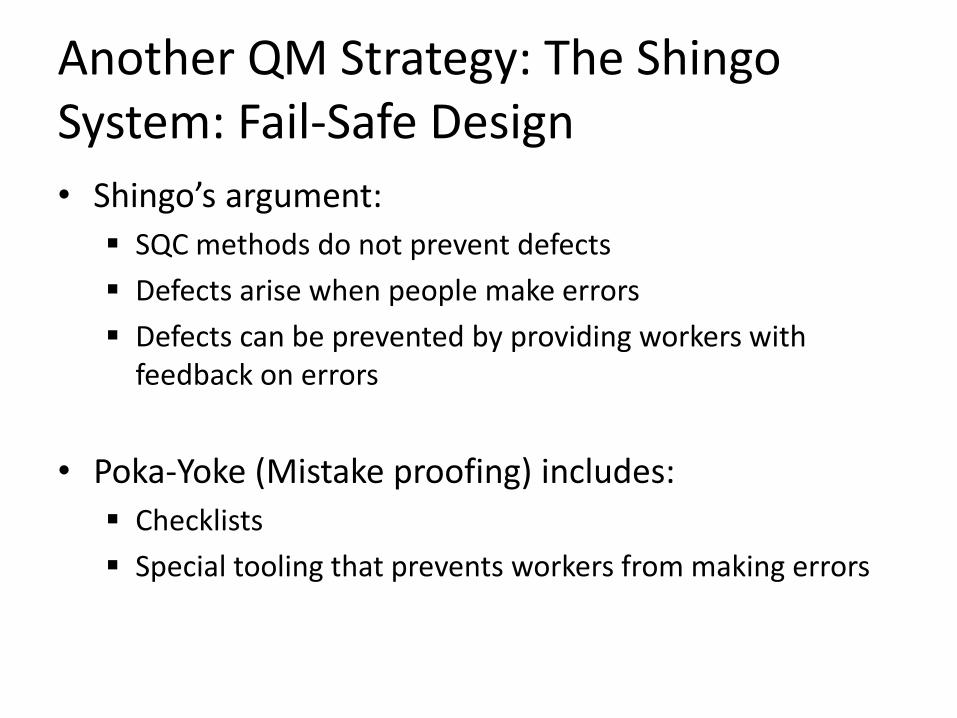
Another QM Strategy: The Shingo System: Fail-Safe Design
• Shingo’s argument:
SQC methods do not prevent defects
Defects arise when people make errors
Defects can be prevented by providing workers with feedback on errors
• Poka-Yoke (Mistake proofing) includes:
Checklists
Special tooling that prevents workers from making errors
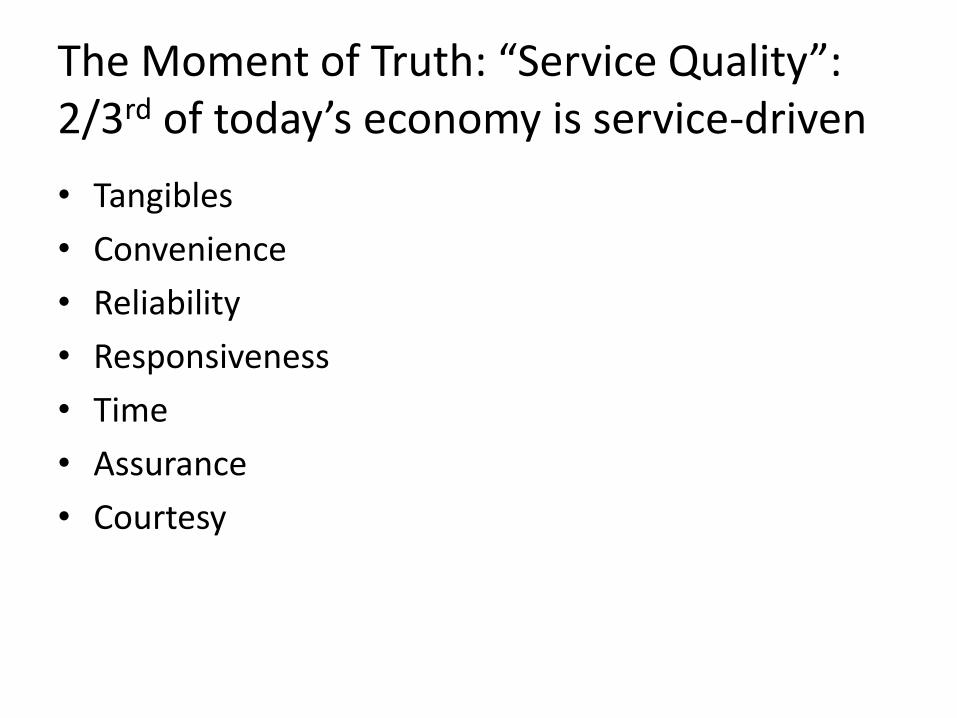
The Moment of Truth: “Service Quality”: 2/3rd of today’s economy is service-driven
• Tangibles
• Convenience
• Reliability
• Responsiveness
• Time
• Assurance
• Courtesy
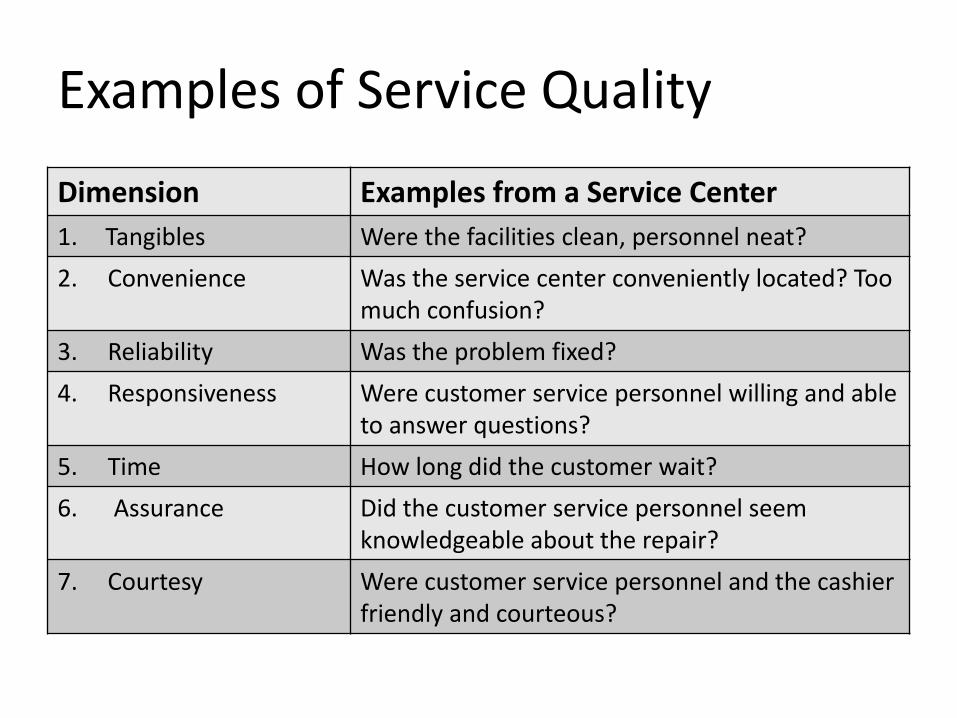
Examples of Service Quality
Dimension Examples from a Service Center
1. Tangibles Were the facilities clean, personnel neat?
2. Convenience Was the service center conveniently located? Too much confusion?
3. Reliability Was the problem fixed?
4. Responsiveness Were customer service personnel willing and able to answer questions?
5. Time How long did the customer wait?
6. Assurance Did the customer service personnel seem knowledgeable about the repair?
7. Courtesy Were customer service personnel and the cashier friendly and courteous?