engines of growth & development by dr t.h. chowdary director: center for telecom management and...
TRANSCRIPT
Engines of Growth & Development
By
Dr T.H. CHOWDARY Director: Center for Telecom Management and Studies
Chairman: Pragna Bharati (intellect India )Former: Chairman & Managing Director
Videsh Sanchar Nigam Limited &Information Technology Advisor, Government of Andhra Pradesh
T: +91(40) 6667-1191/ 2784-6137(O) 2784-3121®F: +91 (40) 6667-1111, 2789-6103
[email protected]@satyam.com
Talk @ Osmania University, Hyderabad : 16 April 2008
THC_CTMS S381_April'08 2
Development
• Economic:– Family Income– Old Age Pensions– Insurance
• Life, Health, Work
• Human:– Health– Longevity– Education– Quality of Life ( air, water, leisure, communion…)– Stable Family– Stress
THC_CTMS S381_April'08 3
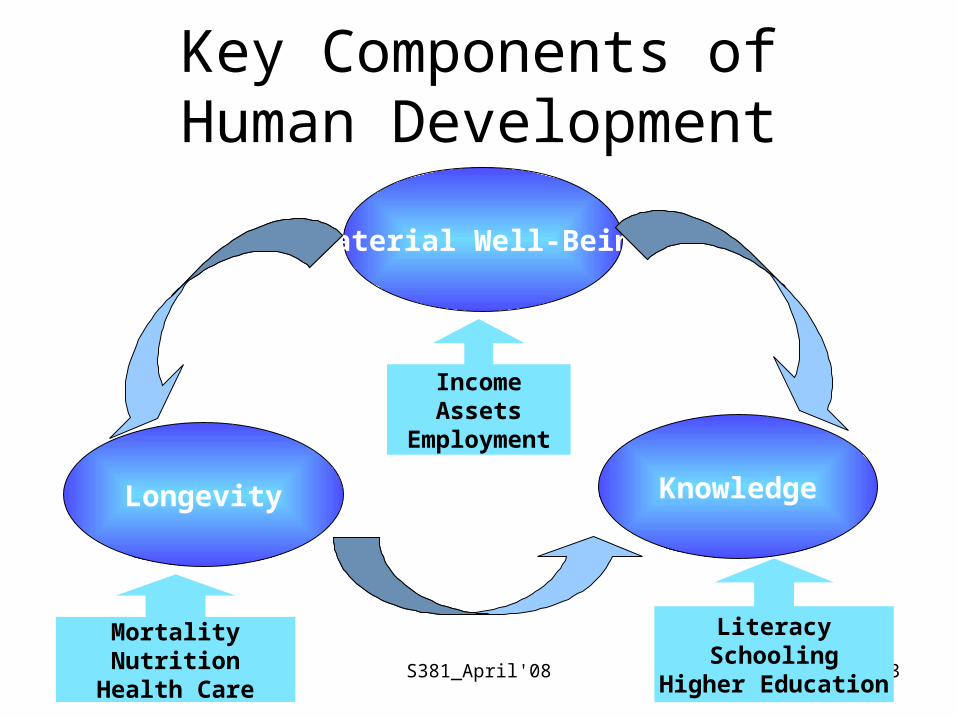
Key Components of Human Development
Material Well-Being
KnowledgeLongevity
MortalityNutrition
Health Care
IncomeAssets
Employment
LiteracySchooling
Higher Education
THC_CTMS S381_April'08 4
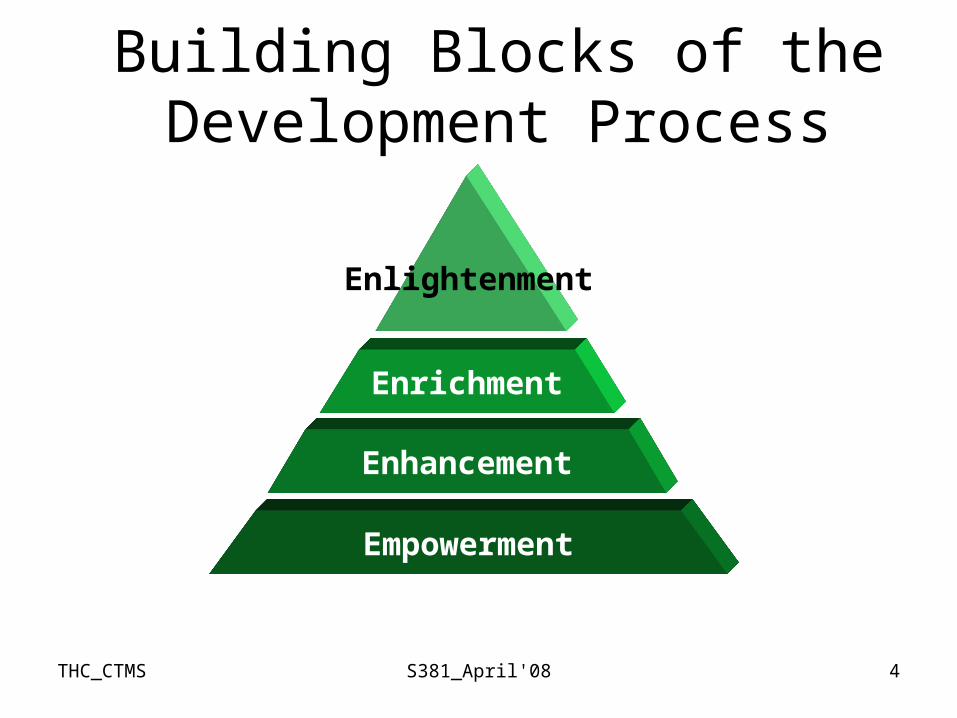
Building Blocks of the Development Process
Enlightenment
Empowerment
Enhancement
Enrichment
THC_CTMS S381_April'08 5
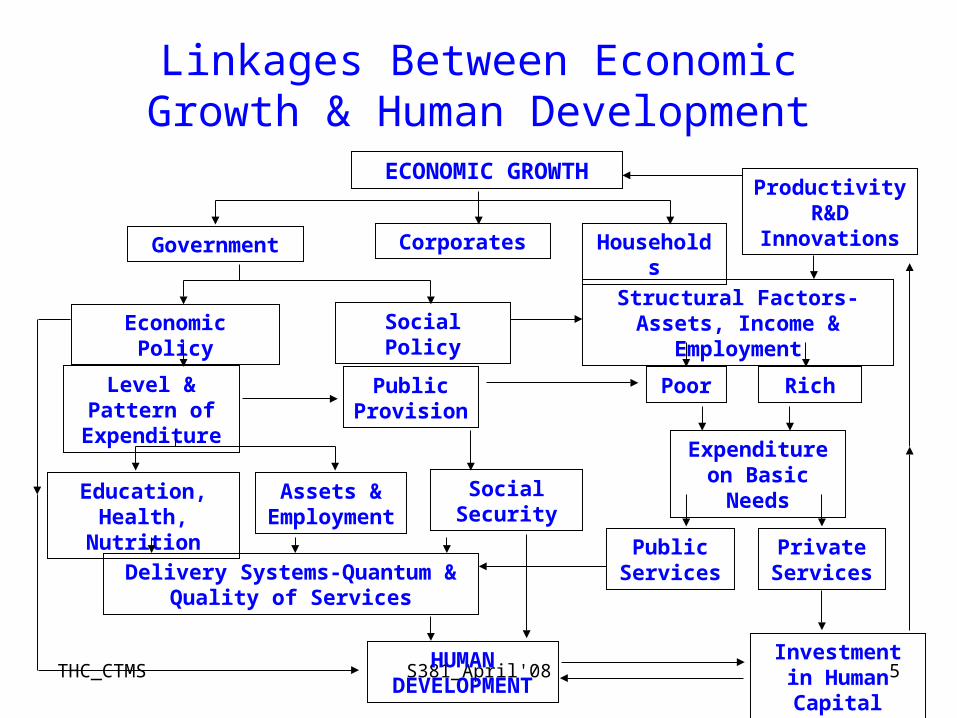
Linkages Between Economic Growth & Human Development
ECONOMIC GROWTH
Government Households
Productivity R&D
Innovations
Economic Policy Social Policy
Public Provision
Structural Factors- Assets, Income & Employment
Level & Pattern of Expenditure
Poor Rich
Expenditure on Basic Needs
Education, Health, Nutrition
Assets & Employment
Social Security
Delivery Systems-Quantum & Quality of Services
Public Services
Private Services
Corporates
HUMAN DEVELOPMENT
Investment in Human Capital
THC_CTMS S381_April'08 6
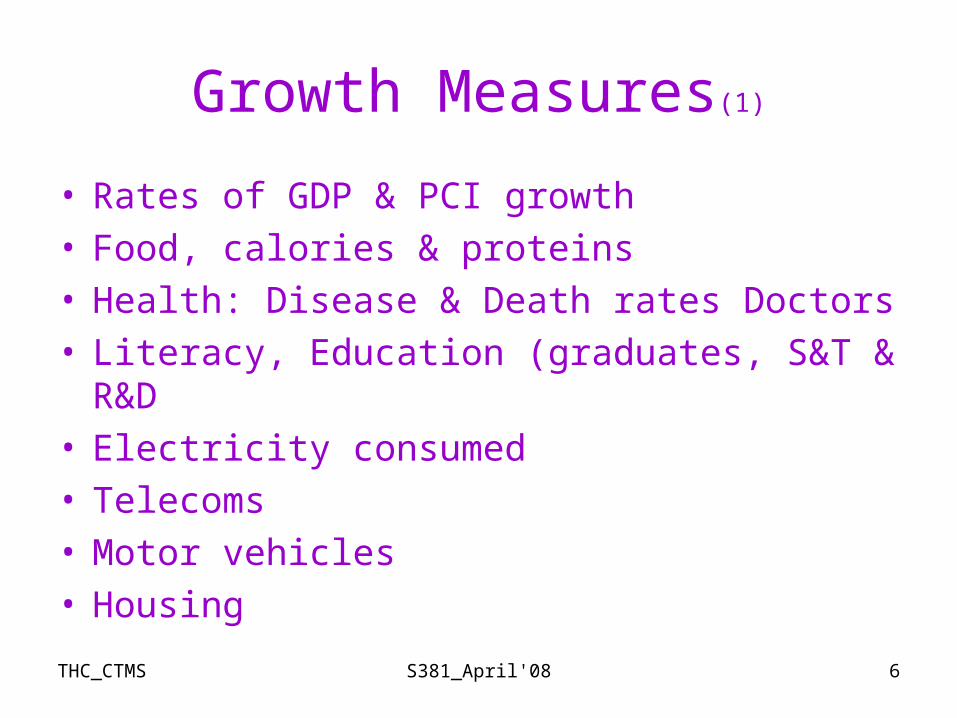
Growth Measures(1)
• Rates of GDP & PCI growth• Food, calories & proteins• Health: Disease & Death rates Doctors• Literacy, Education (graduates, S&T & R&D• Electricity consumed• Telecoms• Motor vehicles• Housing
THC_CTMS S381_April'08 7
Growth Measures(2)
• Trade
• Foreign Exchange Resources
• Tourism
• Roads, Railways, Ports (sea & air)
THC_CTMS S381_April'08 8
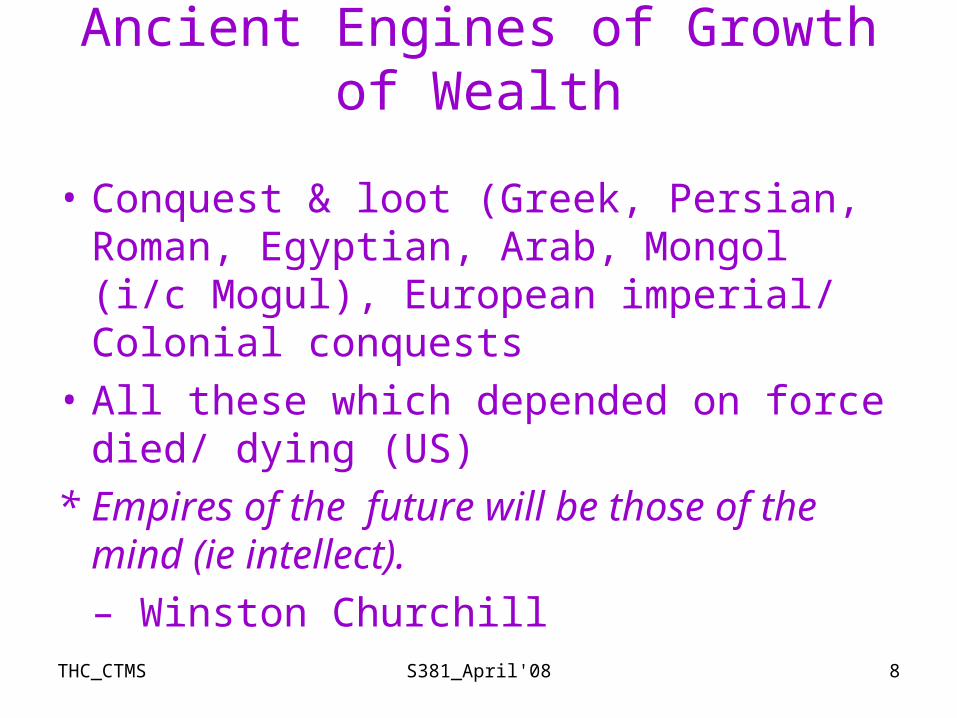
Ancient Engines of Growth of Wealth
• Conquest & loot (Greek, Persian, Roman, Egyptian, Arab, Mongol (i/c Mogul), European imperial/ Colonial conquests
• All these which depended on force died/ dying (US)
* Empires of the future will be those of the mind (ie intellect).
– Winston Churchill
THC_CTMS S381_April'08 9
Fuel for Modern Engines of Growth
• Education
• S&T
• Knowledge Creation – R&D
• Health
• Human Resources ( can overcome lack of natural resources. Eg: Singapore, Israel, Japan)

THC_CTMS S381_April'08 10
Prosperity & Poverty
THC_CTMS S381_April'08 11
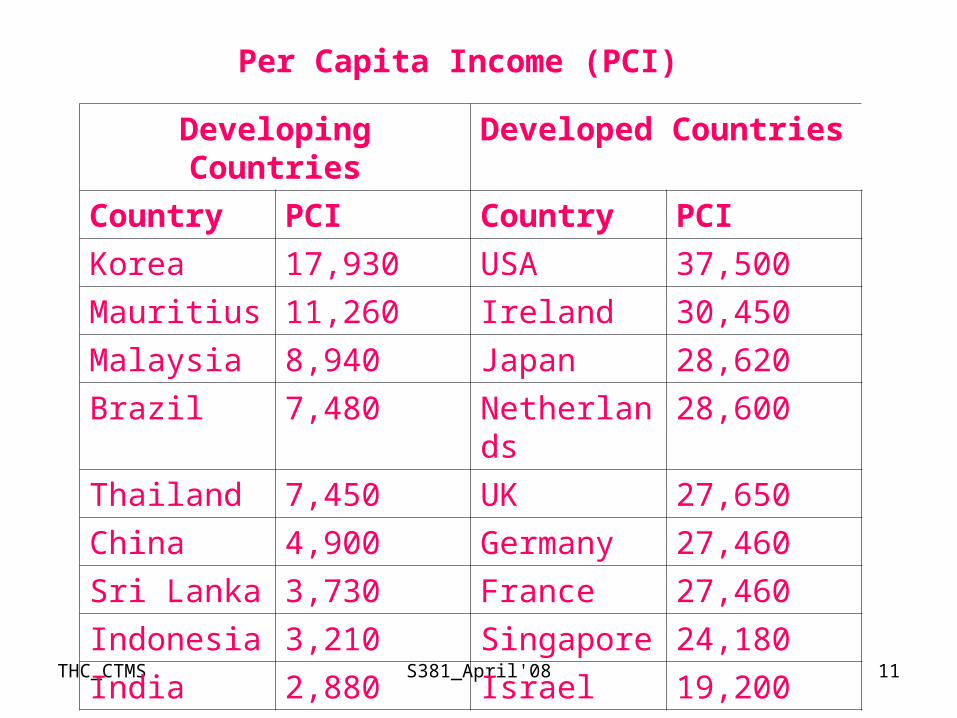
Developing Countries Developed Countries
Country PCI Country PCI
Korea 17,930 USA 37,500
Mauritius 11,260 Ireland 30,450
Malaysia 8,940 Japan 28,620
Brazil 7,480 Netherlands 28,600
Thailand 7,450 UK 27,650
China 4,900 Germany 27,460
Sri Lanka 3,730 France 27,460
Indonesia 3,210 Singapore 24,180
India 2,880 Israel 19,200
Per Capita Income (PCI)
THC_CTMS S381_April'08 12
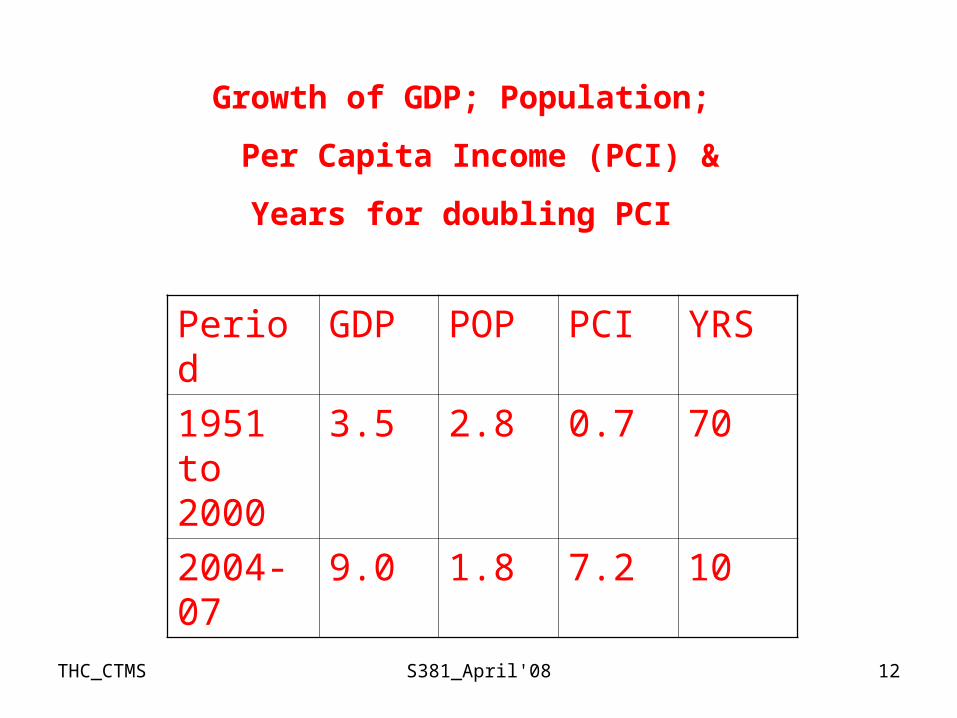
Period GDP POP PCI YRS
1951 to 2000
3.5 2.8 0.7 70
2004-07
9.0 1.8 7.2 10
Growth of GDP; Population;
Per Capita Income (PCI) &
Years for doubling PCI

THC_CTMS S381_April'08 13
Poverty Ratio in Selected States (1)
Contd.
1973-74 1993-94 1999-2000
All India 54.9 36.0 26.1
Low poverty ratios
Goa 44.3 14.9 4.4
Kerala 59.8 25.4 12.7
Gujarat 48.2 24.2 14.1
Rajasthan 46.1 27.4 15.3
THC_CTMS S381_April'08 14
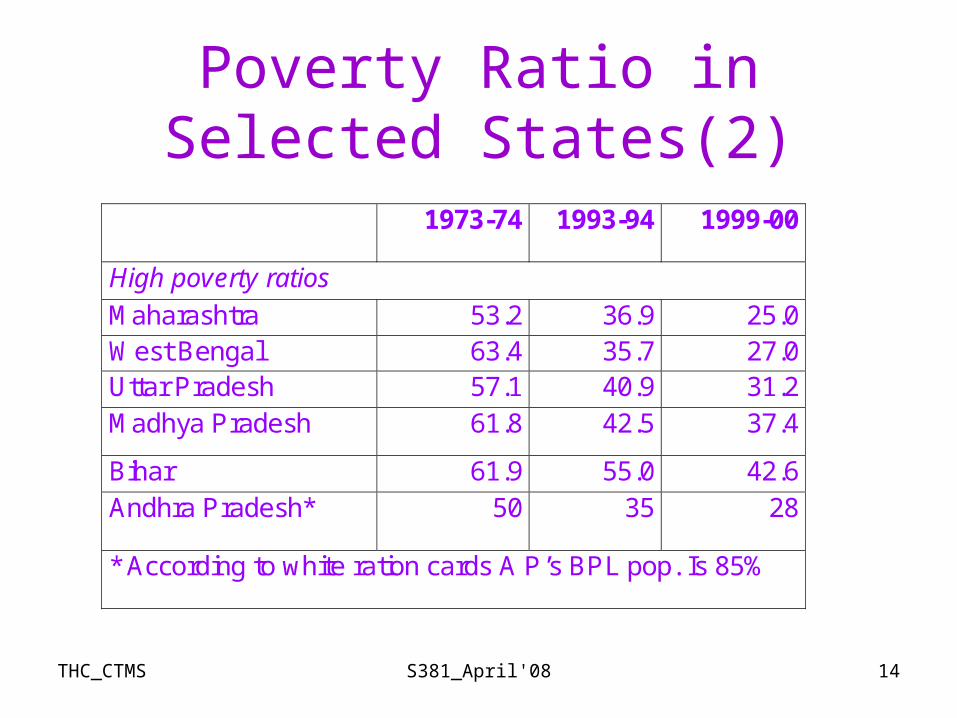
Poverty Ratio in Selected States(2)
1973-74 1993-94 1999-00
High poverty ratios
Maharashtra 53.2 36.9 25.0 West Bengal 63.4 35.7 27.0 Uttar Pradesh 57.1 40.9 31.2 Madhya Pradesh 61.8 42.5 37.4
Bihar 61.9 55.0 42.6 Andhra Pradesh* 50 35 28
* According to white ration cards A P’s BPL pop. Is 85%
THC_CTMS S381_April'08 15
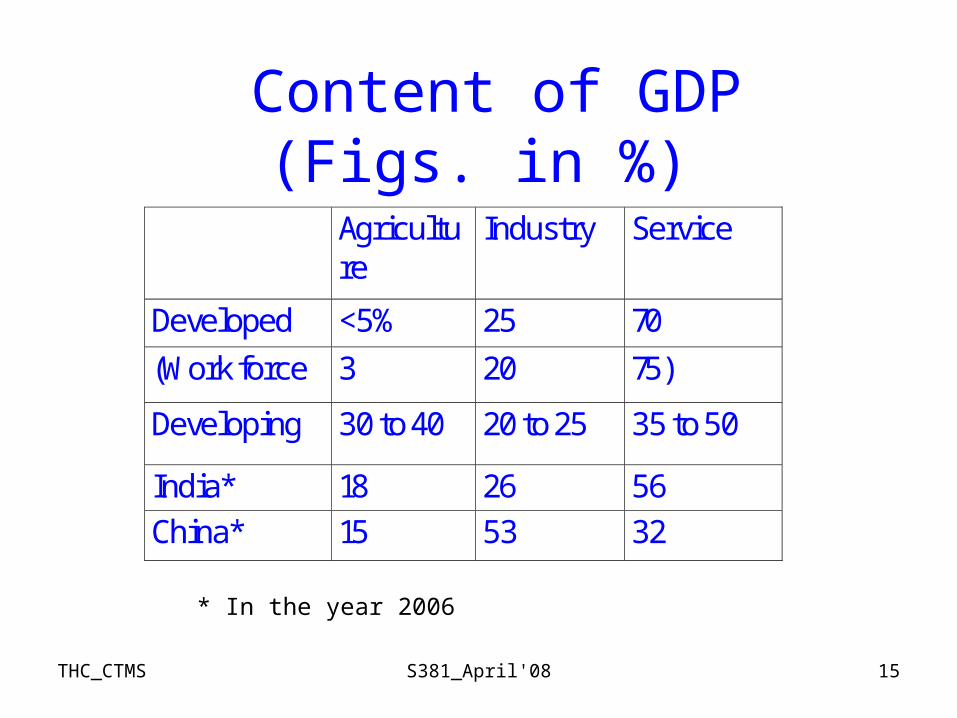
Agriculture
Industry Service
Developed <5% 25 70
(Work force 3 20 75)
Developing 30 to 40 20 to 25 35 to 50
India* 18 26 56 China* 15 53 32
Content of GDP(Figs. in %)
* In the year 2006
THC_CTMS S381_April'08 16
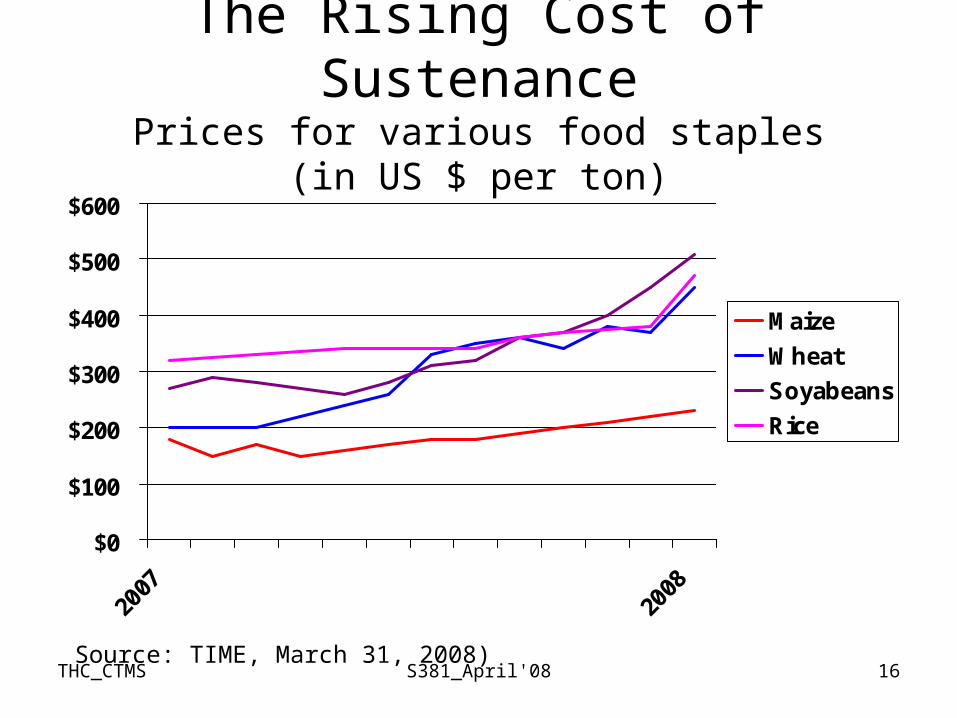
The Rising Cost of SustenancePrices for various food staples
(in US $ per ton)
$0
$100
$200
$300
$400
$500
$600
2007
2008
Maize
Wheat
Soyabeans
Rice
Source: TIME, March 31, 2008)
THC_CTMS S381_April'08 17
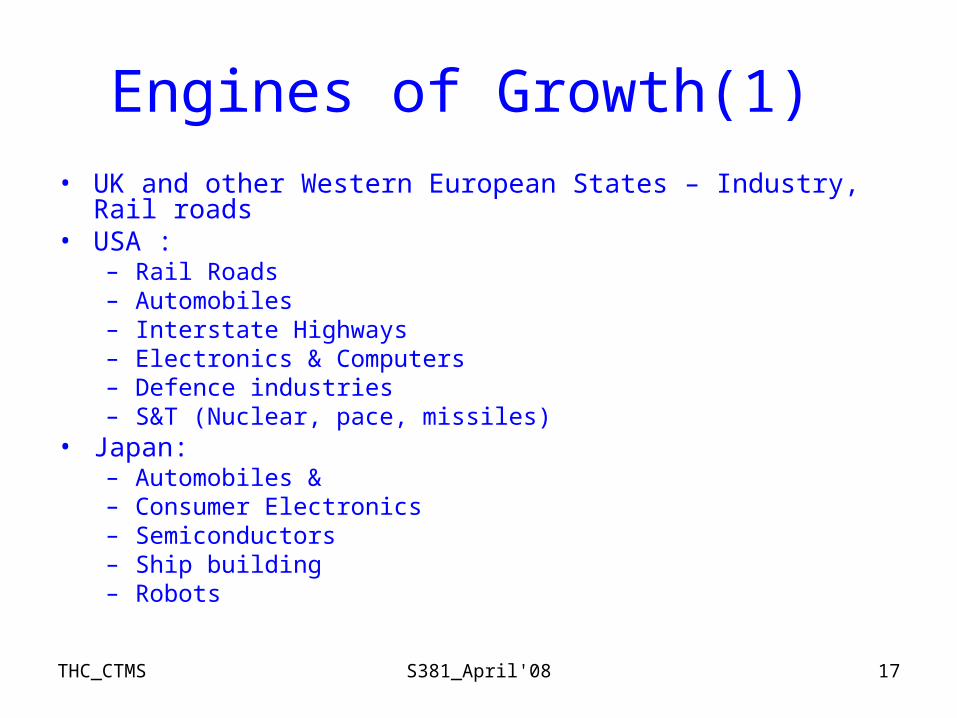
Engines of Growth(1) • UK and other Western European States – Industry, Rail roads • USA :
– Rail Roads– Automobiles– Interstate Highways– Electronics & Computers– Defence industries– S&T (Nuclear, pace, missiles)
• Japan: – Automobiles & – Consumer Electronics– Semiconductors– Ship building– Robots
THC_CTMS S381_April'08 18
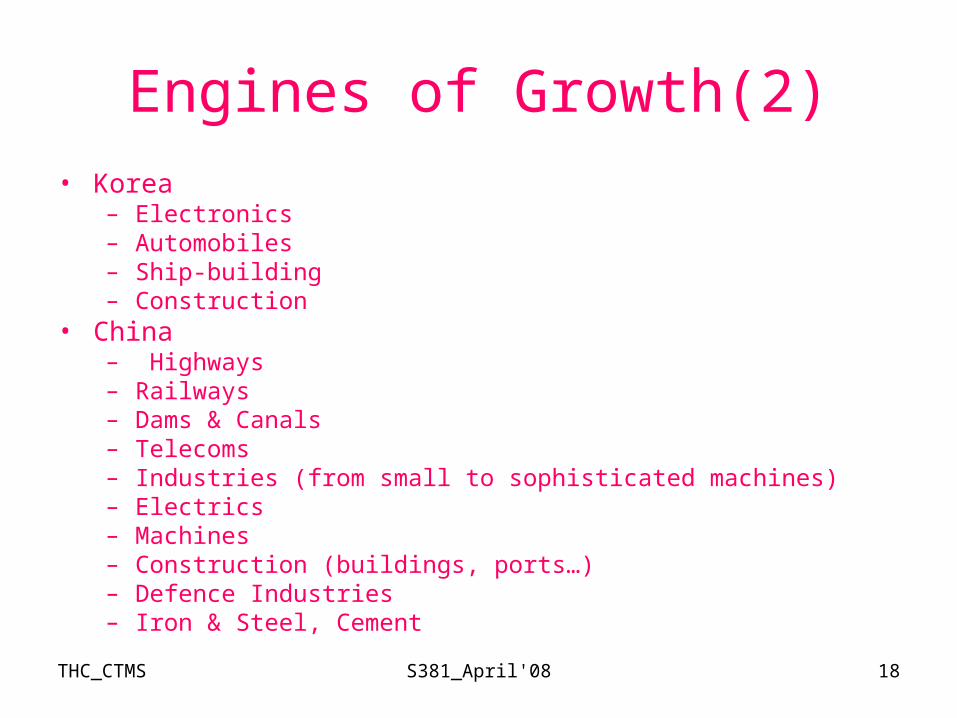
Engines of Growth(2)• Korea
– Electronics– Automobiles– Ship-building– Construction
• China– Highways– Railways – Dams & Canals– Telecoms– Industries (from small to sophisticated machines)– Electrics– Machines– Construction (buildings, ports…)– Defence Industries– Iron & Steel, Cement
THC_CTMS S381_April'08 19
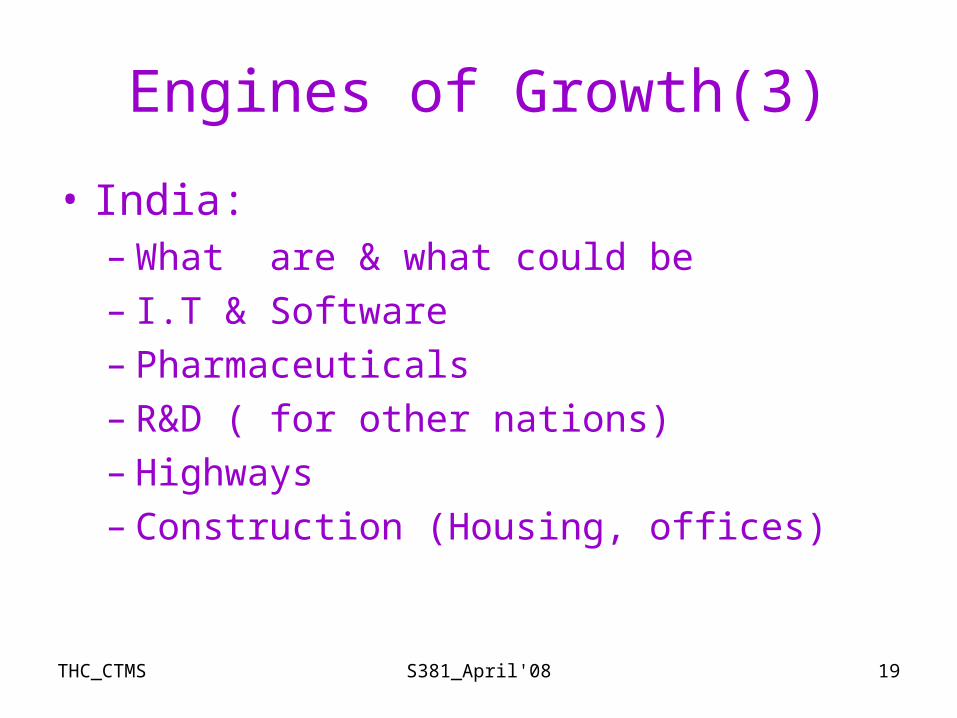
Engines of Growth(3)
• India: – What are & what could be– I.T & Software– Pharmaceuticals– R&D ( for other nations)– Highways– Construction (Housing, offices)
THC_CTMS S381_April'08 20
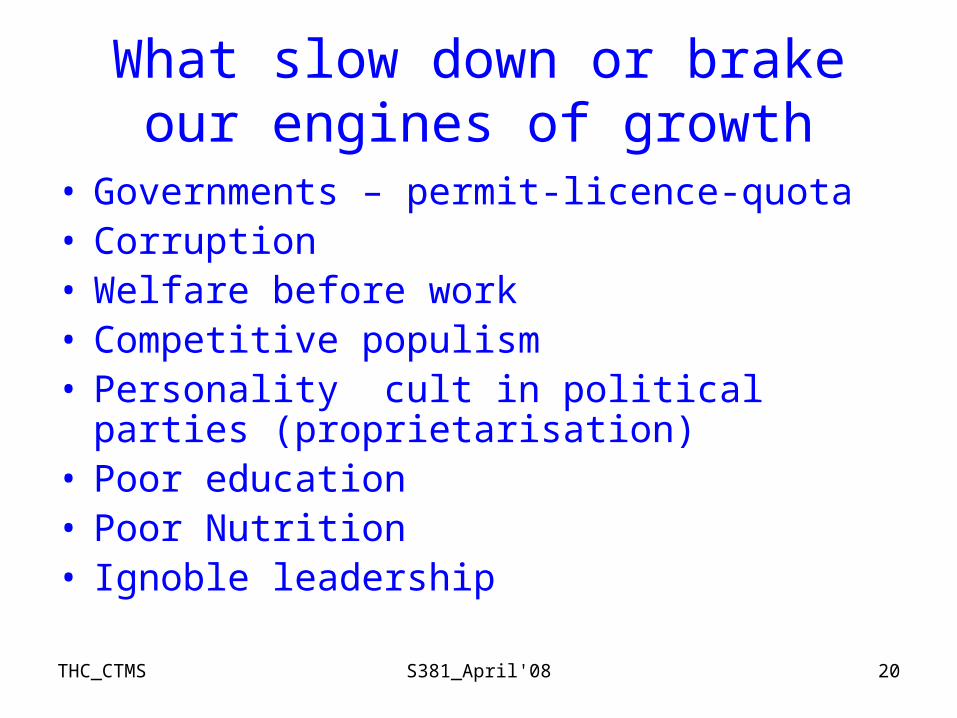
What slow down or brake our engines of growth
• Governments – permit-licence-quota• Corruption• Welfare before work• Competitive populism• Personality cult in political parties
(proprietarisation)• Poor education• Poor Nutrition• Ignoble leadership
THC_CTMS S381_April'08 21
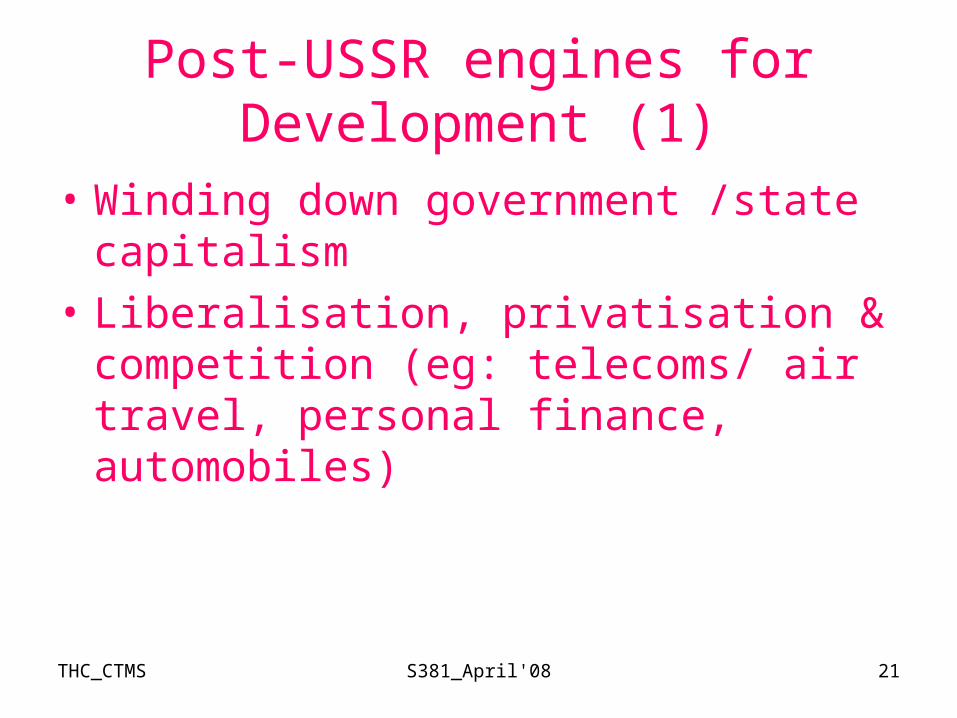
Post-USSR engines for Development (1)
• Winding down government /state capitalism
• Liberalisation, privatisation & competition (eg: telecoms/ air travel, personal finance, automobiles)
THC_CTMS S381_April'08 22
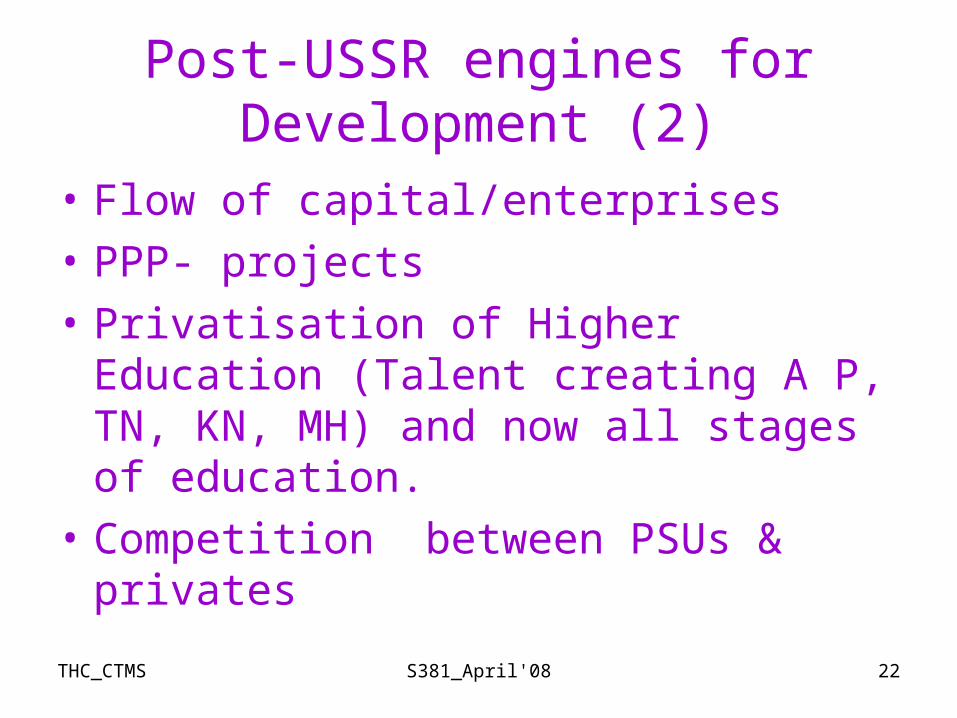
Post-USSR engines for Development (2)
• Flow of capital/enterprises
• PPP- projects
• Privatisation of Higher Education (Talent creating A P, TN, KN, MH) and now all stages of education.
• Competition between PSUs & privates
THC_CTMS S381_April'08 23
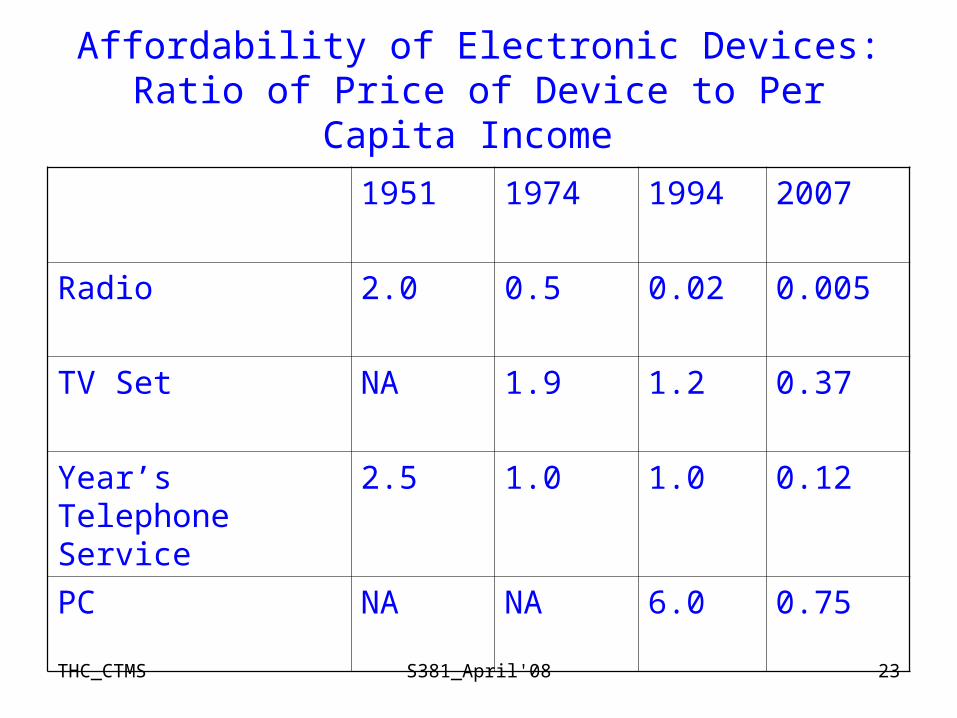
Affordability of Electronic Devices:Ratio of Price of Device to Per Capita Income
1951 1974 1994 2007
Radio 2.0 0.5 0.02 0.005
TV Set NA 1.9 1.2 0.37
Year’s Telephone Service
2.5 1.0 1.0 0.12
PC NA NA 6.0 0.75
THC_CTMS S381_April'08 24
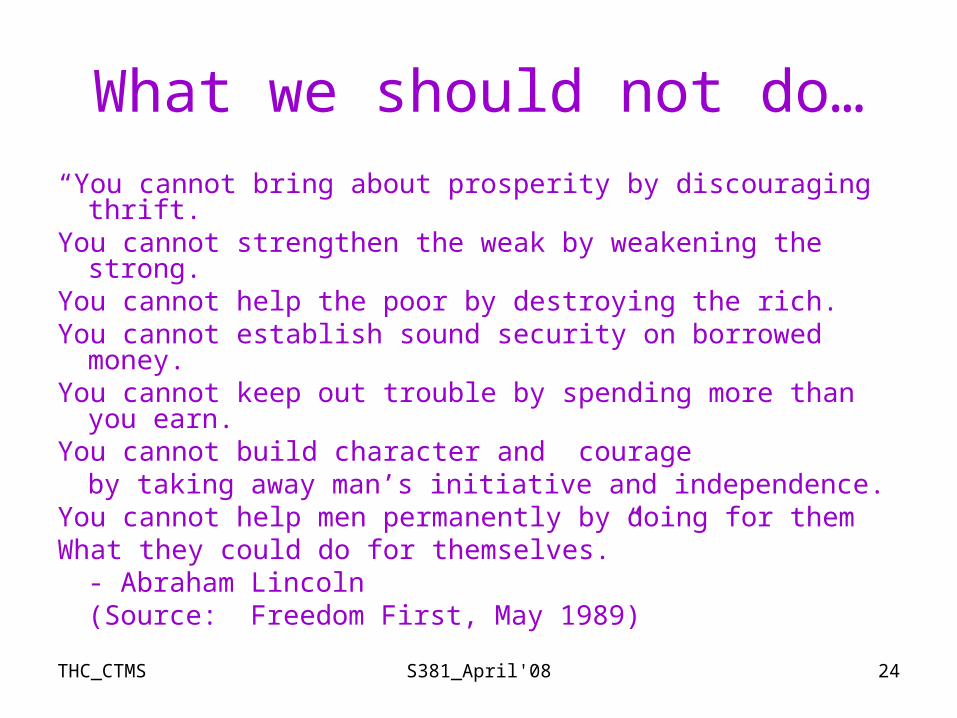
What we should not do…
“You cannot bring about prosperity by discouraging thrift.You cannot strengthen the weak by weakening the strong.You cannot help the poor by destroying the rich.You cannot establish sound security on borrowed money.You cannot keep out trouble by spending more than you
earn.You cannot build character and courage
by taking away man’s initiative and independence.You cannot help men permanently by doing for themWhat they could do for themselves.”
- Abraham Lincoln(Source: Freedom First, May 1989)
THC_CTMS S381_April'08 25
Dhanyawad:Thank You

THC_CTMS S381_April'08 26
Subsidies (Central) in crores of Rs.
Year 2004-05 ‘06 ‘07 ‘08 ‘09
Total 45,957 47,522 57,125 69,742 71,431
Of which food
25,798 23,077 24,014 31,546 32,667
Education: (Rs. crores)
Total Py Sy High
34,400 19,777 4,554 10,853
Health 2006-07 08 09
11,366 14,500 16,968
THC_CTMS S381_April'08 27
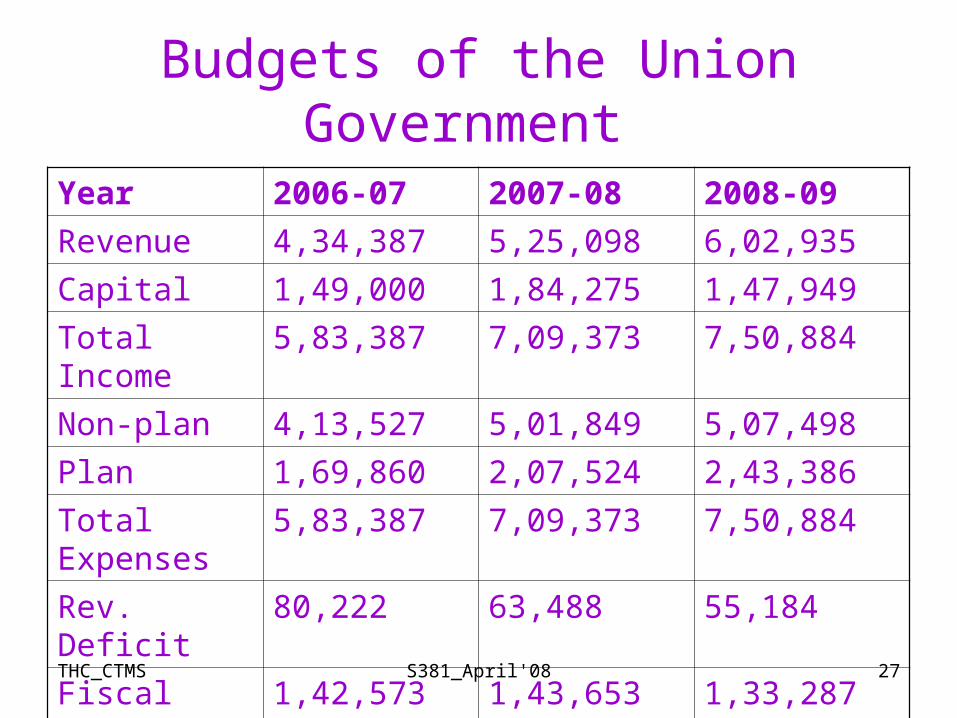
Budgets of the Union Government
Year 2006-07 2007-08 2008-09
Revenue 4,34,387 5,25,098 6,02,935
Capital 1,49,000 1,84,275 1,47,949
Total Income 5,83,387 7,09,373 7,50,884
Non-plan 4,13,527 5,01,849 5,07,498
Plan 1,69,860 2,07,524 2,43,386
Total Expenses
5,83,387 7,09,373 7,50,884
Rev. Deficit 80,222 63,488 55,184
Fiscal Deficit 1,42,573 1,43,653 1,33,287