india’s economic development – challenges to the young by dr t.h. chowdary director: center for...
TRANSCRIPT
India’s Economic Development – Challenges to the Young
By DR T.H. CHOWDARY
Director: Center for Telecom Management and StudiesFellow: Tata Consultancy Services
Chairman: Pragna Bharati (intellect India )Former: Chairman & Managing Director
Videsh Sanchar Nigam Limited &Information Technology Advisor, Government of Andhra Pradesh
T: +91(40) 6667-1191(O) 2784-6137& 2784-3121®F: +91 (40) 6667-1111
HYD: 23 Feb 2014
THC_CTMS 1S707_Feb2014
S707_Feb2014 2
3 categories of people
• Entitlement• Employment • Entrepreneurship
What do you want to be?
THC_CTMS
S707_Feb2014 3
All are born equal: But
• Nurture• Education• EffortMake persons unequal
THC_CTMS
S707_Feb2014 4
Which is the source of all wealth
• Nature• Sunlight• Ores, geysers, water• Rivers, forests, seas, mountains, deserts,
marshes and fawna
THC_CTMS
S707_Feb2014 5
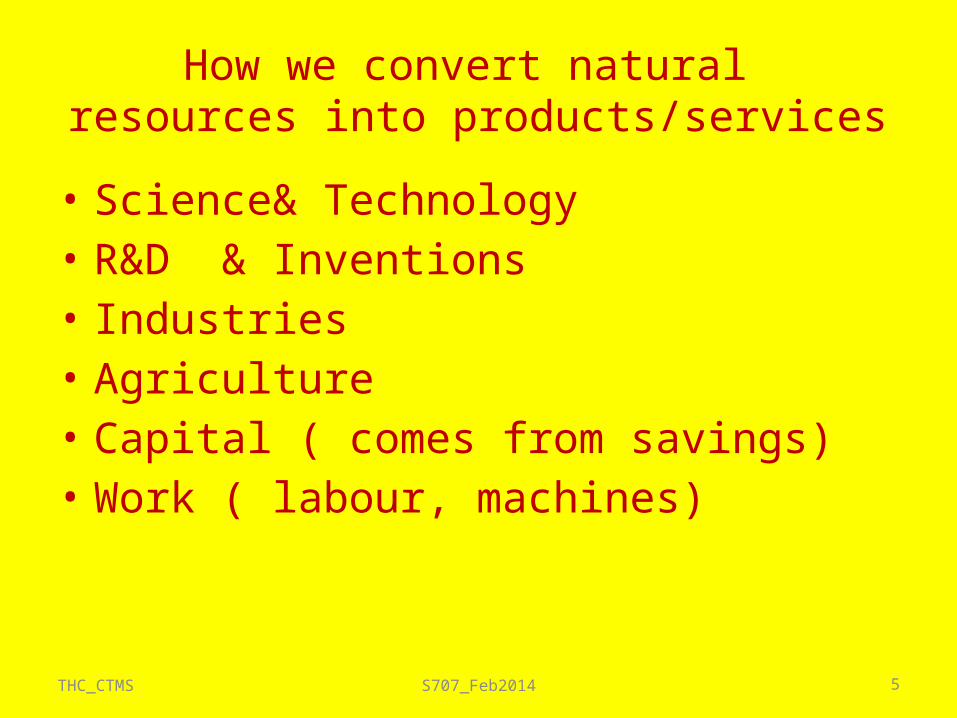
How we convert natural resources into products/services
• Science& Technology• R&D & Inventions • Industries• Agriculture• Capital ( comes from savings)• Work ( labour, machines)
THC_CTMS
THC_CTMS S707_Feb2014 6
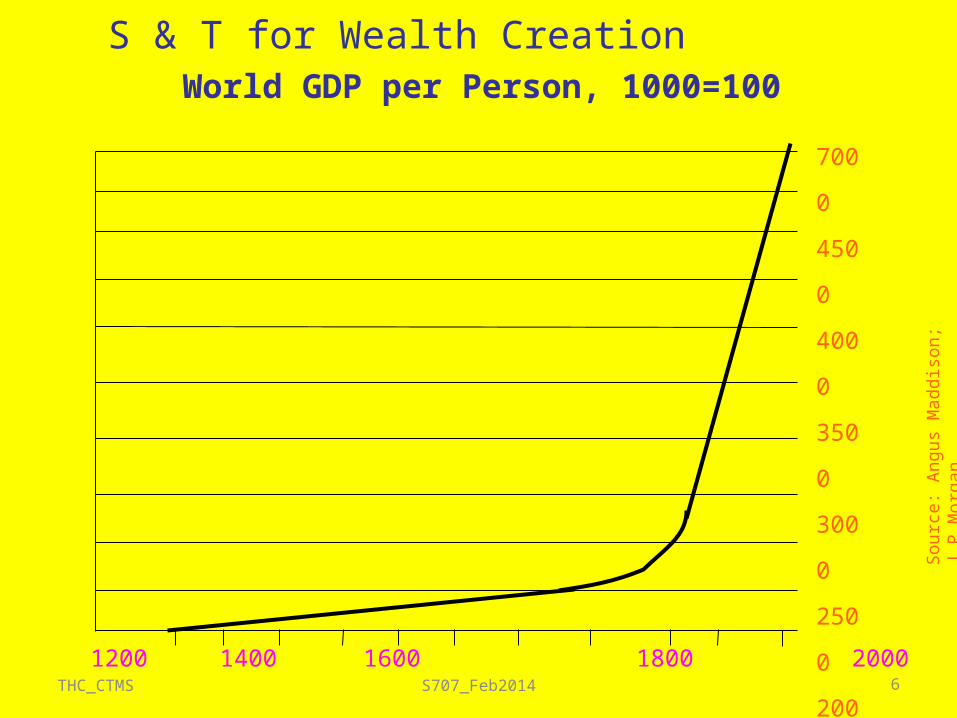
7000
4500
4000
3500
3000
2500
2000
1500
1000
500
0
1000 1200 1400 1600 1800 2000 2012
Sour
ce: A
ngus
Mad
diso
n; J.
P.M
orga
n
World GDP per Person, 1000=100S & T for Wealth Creation
THC_CTMS S707_Feb2014 7
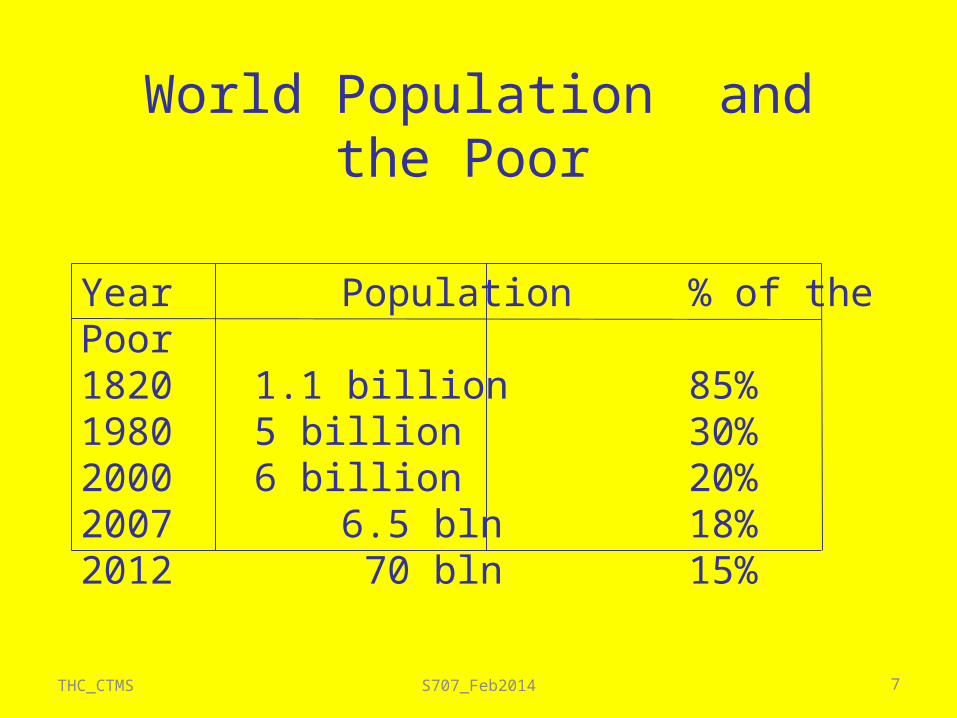
World Population and the Poor
Year Population % of the Poor1820 1.1 billion 85%1980 5 billion 30%2000 6 billion 20%2007 6.5 bln 18%2012 70 bln 15%
THC_CTMS S707_Feb2014 8
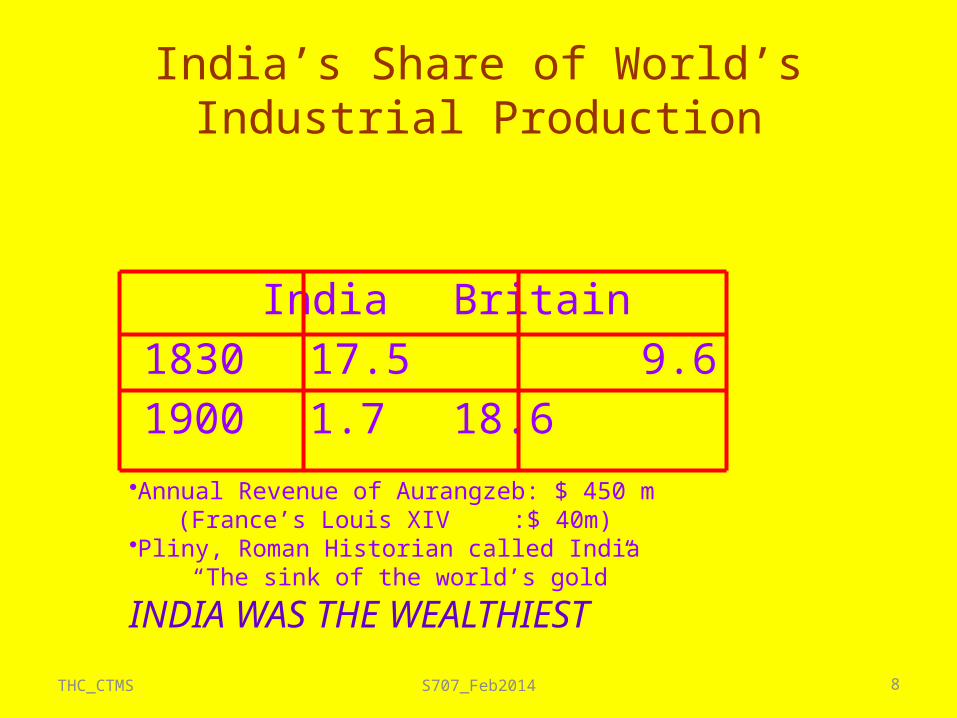
India’s Share of World’s Industrial Production
India Britain 1830 17.5 9.6 1900 1.7 18.6•Annual Revenue of Aurangzeb: $ 450 m
(France’s Louis XIV :$ 40m)•Pliny, Roman Historian called India
“The sink of the world’s gold”
INDIA WAS THE WEALTHIEST
THC_CTMS S707_Feb2014 9
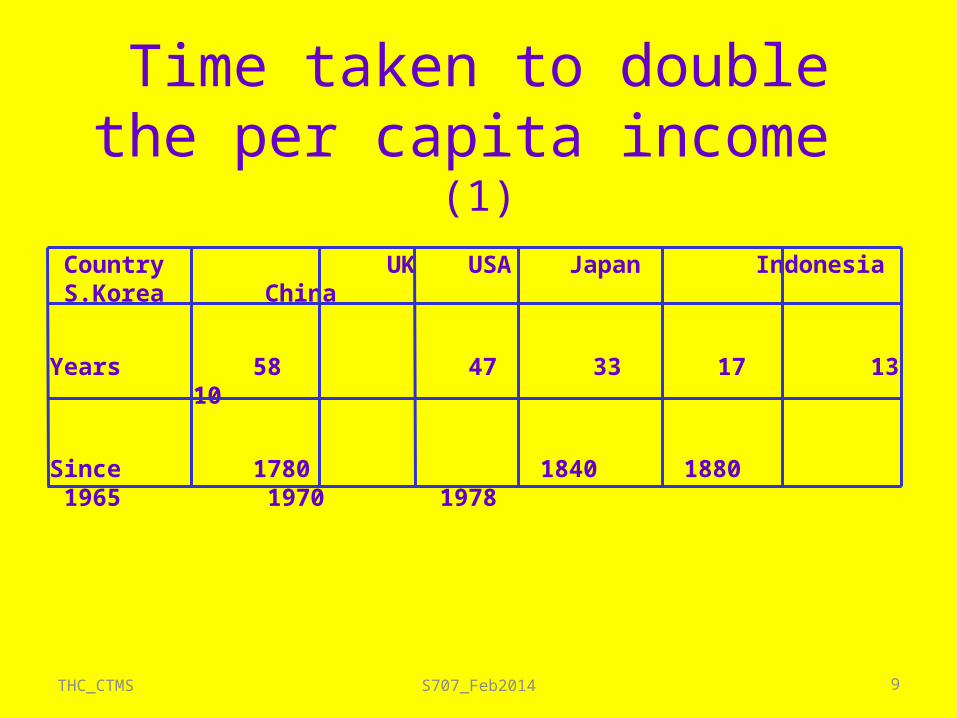
Time taken to double the per capita income (1)
Country UK USA Japan Indonesia S.Korea China
Years 58 47 33 17 13 10
Since 1780 1840 1880 1965 1970 1978
THC_CTMS S707_Feb2014 10
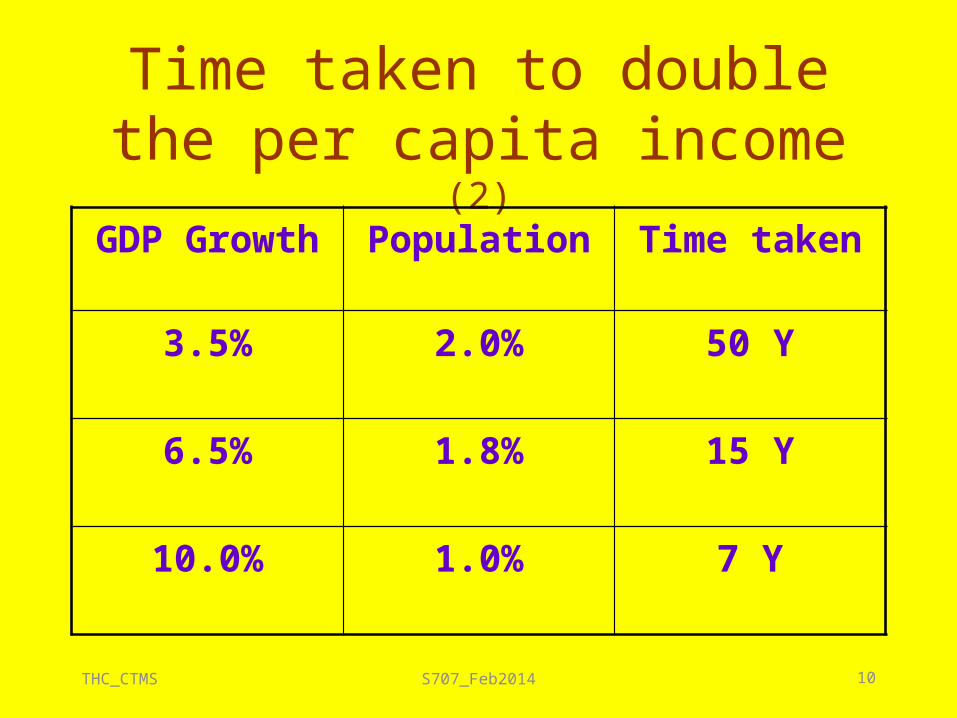
Time taken to double the per capita income (2)
GDP Growth Population Time taken
3.5% 2.0% 50 Y
6.5% 1.8% 15 Y
10.0% 1.0% 7 Y
THC_CTMS S707_Feb2014 11
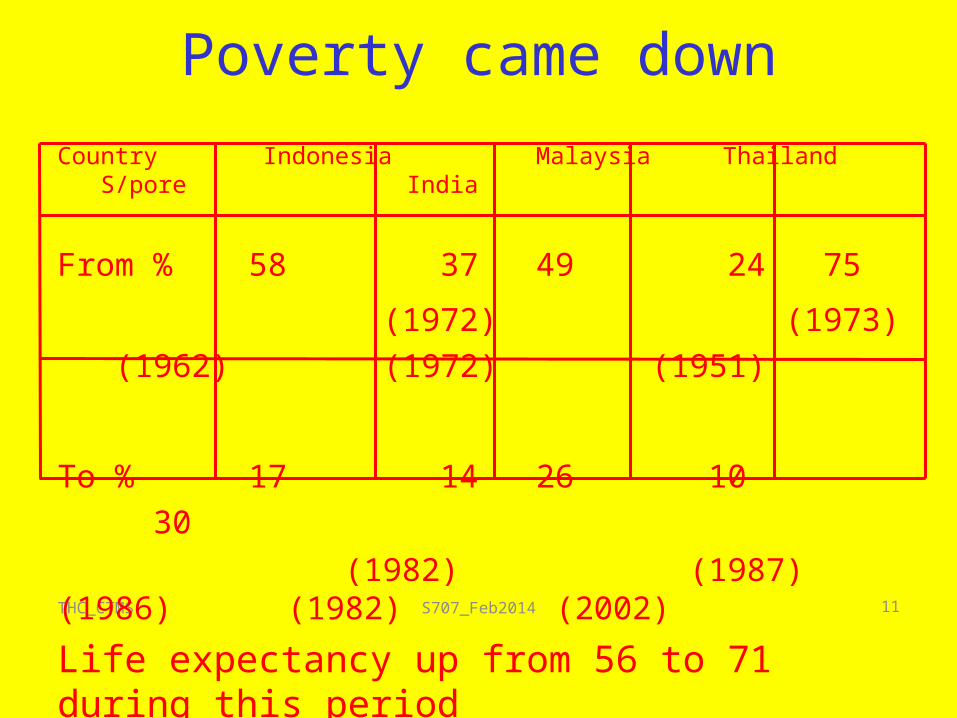
Poverty came downCountry Indonesia Malaysia Thailand S/pore India
From % 58 37 49 24 75
(1972) (1973) (1962) (1972) (1951)
To % 17 14 26 10 30 (1982) (1987) (1986) (1982) (2002)
Life expectancy up from 56 to 71 during this period* UPA II puts the poor at 66% under Food Security Act & Programme
S707_Feb2014 12
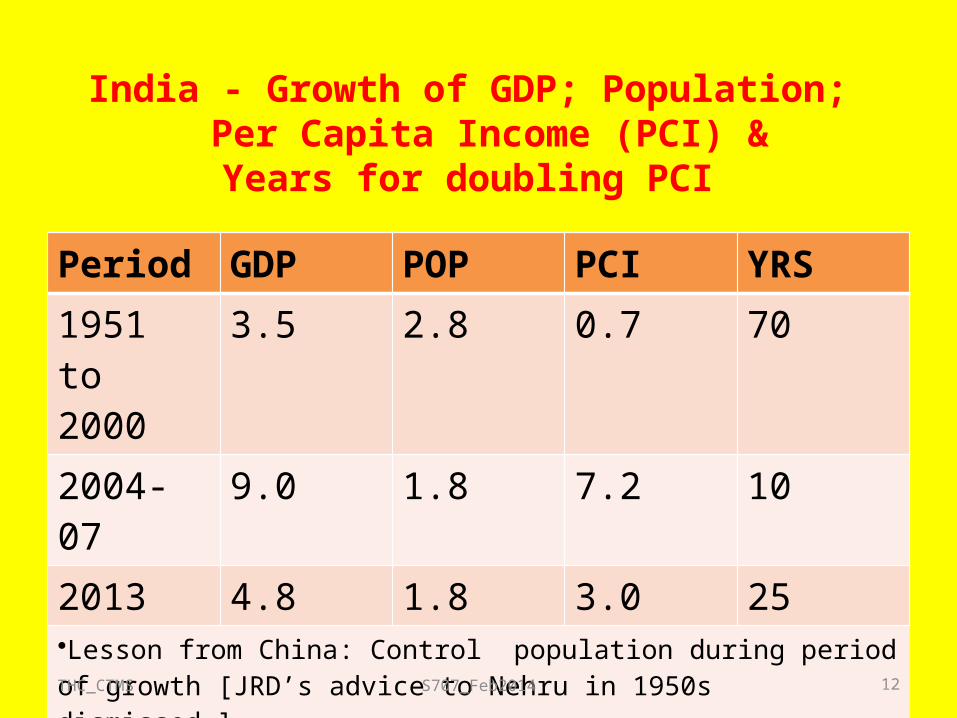
India - Growth of GDP; Population; Per Capita Income (PCI) &
Years for doubling PCI
Period GDP POP PCI YRS1951 to 2000
3.5 2.8 0.7 70
2004-07 9.0 1.8 7.2 102013 4.8 1.8 3.0 25•Lesson from China: Control population during period of growth [JRD’s advice to Nehru in 1950s dismissed.]•BPL ratio is the index: in India it came down from 70% in the 1950s to about 30% now [BPL ratio in A P is 85% according to white ration cards & increasing.]
THC_CTMS
S707_Feb2014 13THC_CTMS
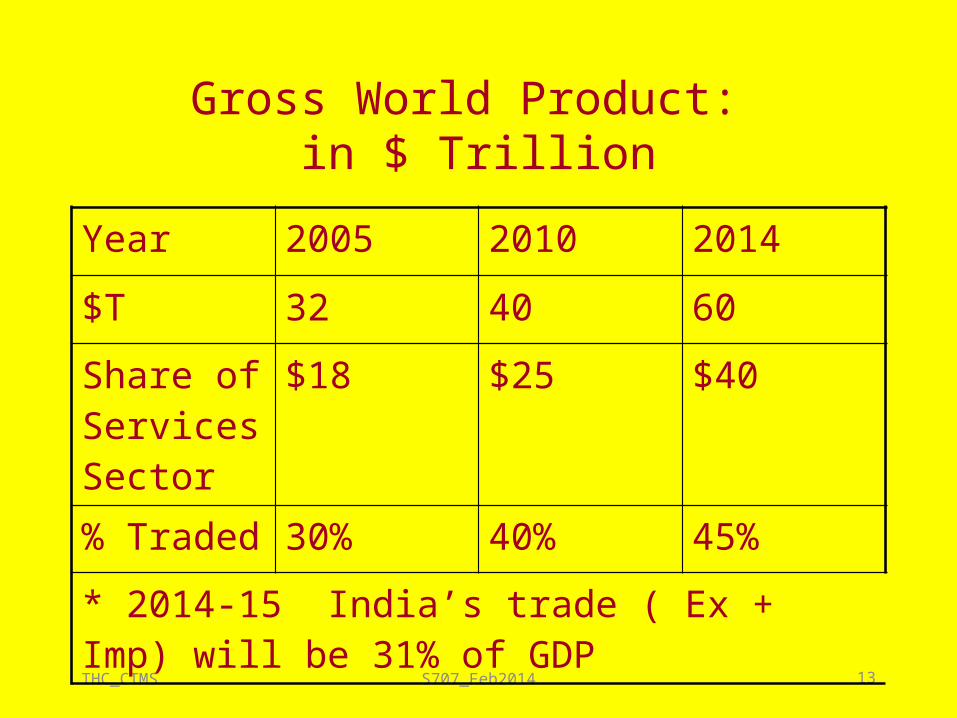
Gross World Product: in $ Trillion
Year 2005 2010 2014
$T 32 40 60
Share of Services Sector
$18 $25 $40
% Traded 30% 40% 45%
* 2014-15 India’s trade ( Ex + Imp) will be 31% of GDP

S707_Feb2014 14
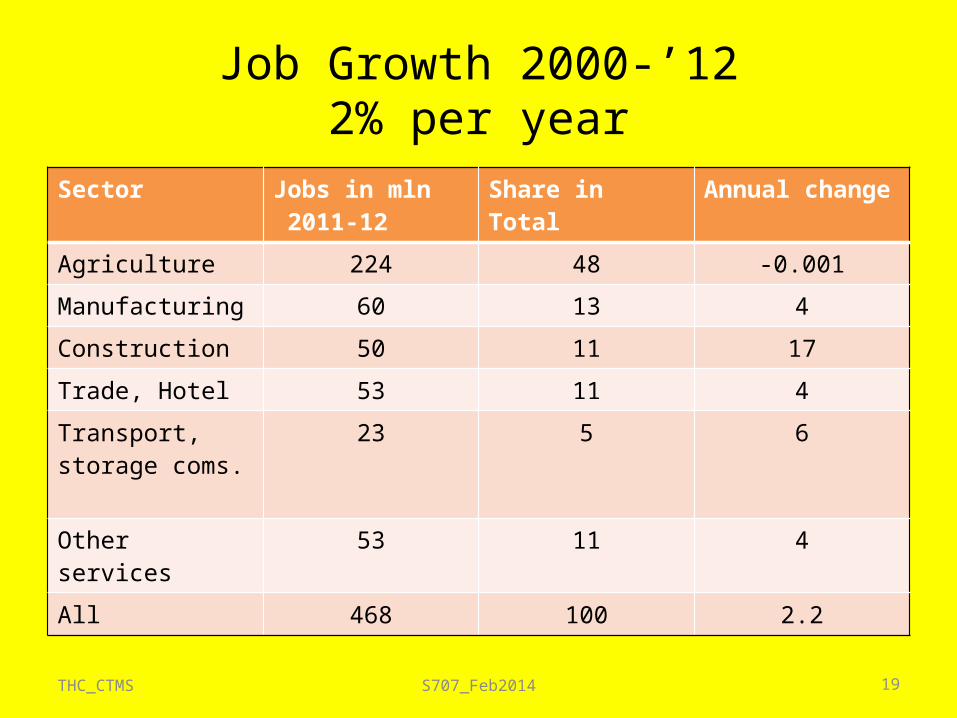
Jobs lost/created in the last 10 years in different sectors in India
• 2000-2012 jobs grew by a mere 2% p.a• Pop. growing @ 1.8% i.e adding about 20 mln • Job creation never> 10 mln• Unproductive spend GOI’s Interest Payments Rs.
3,64,244 cr• Welfare spend & subsidies Rs. 5,00,000 cr• Subsidies (Rs. 2,42,255 cr in 2013-14) (i/c Haj Rs. 1000 cr)• Give aways NREGA- Rs. 40,000 cr SHGTHC_CTMS
S707_Feb2014 15
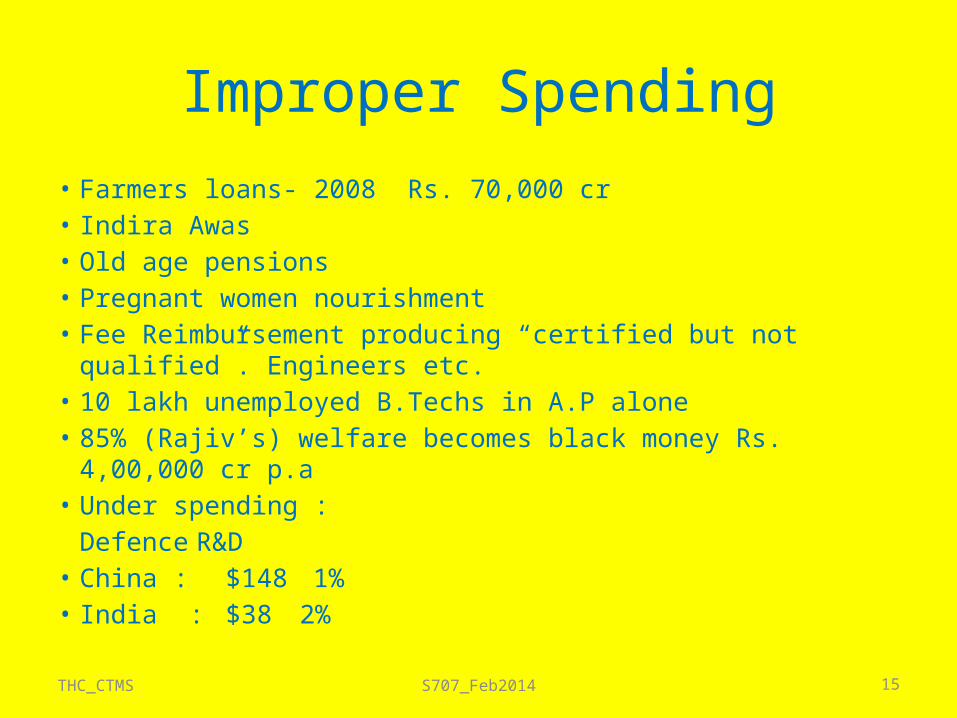
Improper Spending• Farmers loans- 2008 Rs. 70,000 cr• Indira Awas• Old age pensions• Pregnant women nourishment• Fee Reimbursement producing “certified but not qualified”.
Engineers etc.• 10 lakh unemployed B.Techs in A.P alone• 85% (Rajiv’s) welfare becomes black money Rs. 4,00,000 cr p.a • Under spending :
Defence R&D• China : $148 1%• India : $38 2%
THC_CTMS
THC_CTMS S707_Feb2014 16
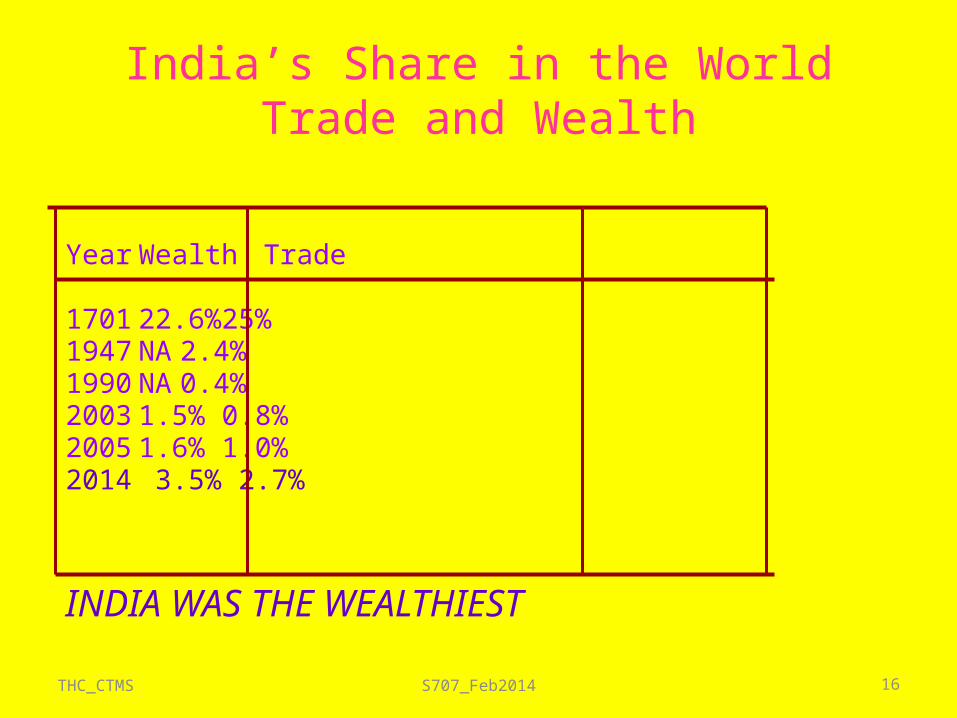
India’s Share in the World Trade and Wealth
Year Wealth Trade
1701 22.6% 25%1947 NA 2.4%1990 NA 0.4%2003 1.5% 0.8%2005 1.6% 1.0%2014 3.5% 2.7%
INDIA WAS THE WEALTHIEST

S707_Feb2014 17
What we need to do
• Link up rivers & national water grids• National &Highways = Rs. 70,000 RKM• National Power Grid• 600 new towns/ cities• 100 ports & harbours• 200 airports• Solar Power Generation on all multi-storeyed buildings (
Germany, Israel)• Electric cars (Petrol/diesel stations become Battery
Replace Stations (Israel, Denmark…THC_CTMS
S707_Feb2014 18
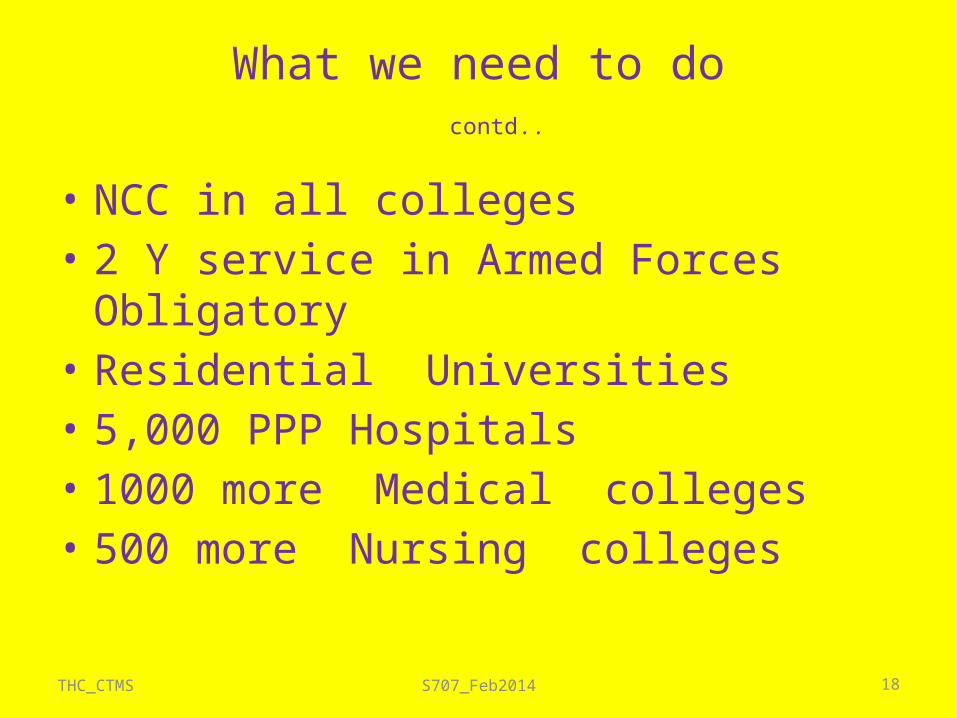
What we need to do contd..
• NCC in all colleges• 2 Y service in Armed Forces Obligatory• Residential Universities• 5,000 PPP Hospitals• 1000 more Medical colleges• 500 more Nursing colleges
THC_CTMS
S707_Feb2014 19
Job Growth 2000-’122% per year
Sector Jobs in mln 2011-12
Share in Total Annual change
Agriculture 224 48 -0.001
Manufacturing 60 13 4
Construction 50 11 17
Trade, Hotel 53 11 4
Transport, storage coms.
23 5 6
Other services 53 11 4
All 468 100 2.2
THC_CTMS
S707_Feb2014 20
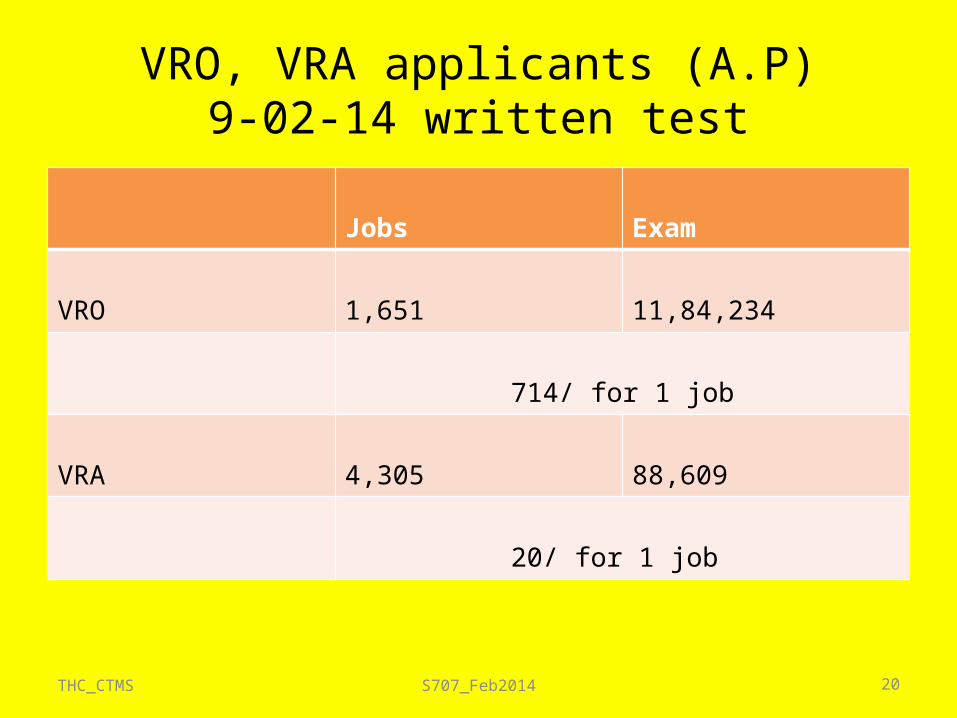
VRO, VRA applicants (A.P)9-02-14 written test
Jobs Exam
VRO 1,651 11,84,234
714/ for 1 job
VRA 4,305 88,609
20/ for 1 job
THC_CTMS
S707_Feb2014 21
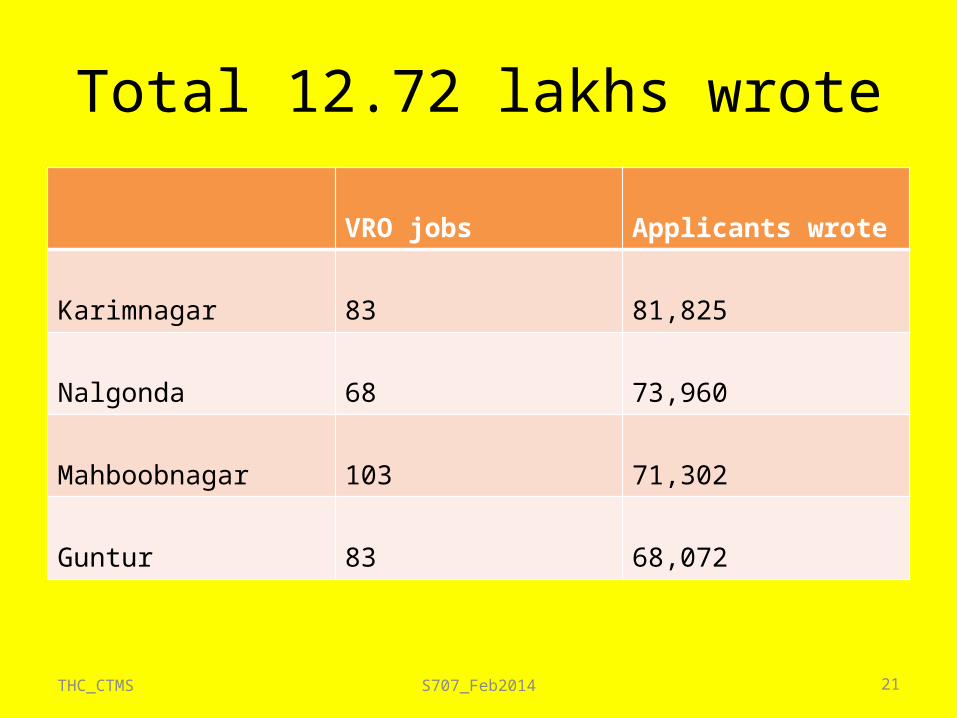
Total 12.72 lakhs wrote
VRO jobs Applicants wrote
Karimnagar 83 81,825
Nalgonda 68 73,960
Mahboobnagar 103 71,302
Guntur 83 68,072
THC_CTMS

S707_Feb2014 22
Dhanyawad:Thank You
THC_CTMS