oat protein structure-function properties and value-added ... · pdf filelech ozimek, lingyun...
TRANSCRIPT
Oat protein structure-function properties and value-added application
by
Talina Vanessa Nieto Nieto
A thesis submitted in partial fulfillment of the requirements for the degree of
Doctor in Philosophy
in
Food Science and Technology
Department of Agricultural, Food and Nutritional Science
University of Alberta
© Talina Vanessa Nieto Nieto, 2015
ii
Abstract
The global protein market is growing with focus on plant-based proteins. Oat protein is a
good source of plant protein, and is regarded as a by-product of the β-glucan extraction
process; therefore oat protein is waiting research to develop its full potential. Globular
proteins in oat closely resemble the proteins in soy, which have demonstrated good gelling
properties. Thus, this research aims to develop a new oat protein based gelling ingredient for
food and non-food applications. For this, it was necessary to complete a systematic study of
the thermal gelation of oat protein under different environmental conditions. Mechanical and
rheological properties of oat protein gels were determined and their microstructures were
observed. We attempted to better understand gelling mechanisms of oat protein based
systems by correlating protein structure changes during heating to gel microstructures and
bulk properties. Special emphasis was placed on enzymatic hydrolysis and protein-
polysaccharide blending, as two important strategies to improve oat protein gelling properties
due to their mild reaction conditions and in consequence higher consumer acceptability.
In the first part of this work, the effect of enzymatic hydrolysis on the structure and gelling
properties of oat proteins was investigated. Flavourzyme and trypsin hydrolysates could form
gels with similar mechanical strength and water-holding capacity comparable to animal
protein. The acidic polypeptide of the 12S fraction exerted great influence over the gelling
ability of oat protein. Partial hydrolysis with the appropriate enzyme altered the charges on
the protein molecular chains, allowing a balance between attractive and repulsive forces at
pH 8 and 9 to establish strong three-dimensional gel networks when heated at 110 and 120˚C.
Additionally it was suggested that the partial hydrolysis also led to increased exposure of

iii
hydrophobic groups that remained in the peptide chains, which allowed development of gel
with improved strength via hydrophobic interactions. Both oat protein and its hydrolysates
gels exhibited excellent water holding capacity at neutral or mildly alkaline conditions.
In the second part of this work, the impact of polysaccharide addition on oat protein gelling
properties was investigated. Four different types of polysaccharide were tested including
inulin, dextrin, carrageenan and chitosan. A synergistic effect was observed when gels were
prepared under conditions that favored segregative phase separation. In contrast an
antagonistic effect was observed when gels were prepared under conditions that promoted
attractive interactions. This was especially evident for oat protein gels prepared with
carrageenan at neutral pH, as a two-fold increase in mechanical strength was observed.
Moreover, it has been suggested that strong repulsive forces caused by carrageenan addition
resulted in a highly order network structure which permitted the development of hydrogen
and hydrophobic interactions to further strengthen the protein networks.
The findings from this work may encourage oat producers to promote the utilization of oat
protein as an ingredient for human consumption, which could add economic value to their
operations, and also motivate food producers to apply oat protein as a gelling agent in
response to the increasing demand for plant-based proteins, which could increase the profit
generated by producers and processors.
iv
Preface
Chapter 2 of this thesis has been published as Vanessa Nieto-Nieto, Silvia Amaya-Llano and
Lech Ozimek (2012). Continuous Membrane Bioreactor (CMBR) to Produce Nanoparticles
from Milk Components, Trends in Vital Food and Control Engineering, Prof. Ayman Amer
Eissa (Ed.). In this chapter I was responsible for collecting information for this literature
review as well as writing down the manuscript. Dr. Silvia Amaya Llano and Dr. Lech
Ozimek were supervisory authors and were responsible for manuscript edits and submission.
Chapter 3 of this thesis has been published as Talina Vanessa Nieto-Nieto, Yi Xiang Wang,
Lech Ozimek, Lingyun Chen, Effects of partial hydrolysis on structure and gelling properties
of oat globular proteins, Food Research International, Volume 55, January 2014, Pages 418-
425. In this chapter my responsibility was to collect and analyze all the data as well as to
write down the manuscript. Assistance was received from Dr. Yi Xiang Wang in obtaining
the SEM micrographs. Dr. Lingyun Chen was the supervisory author and was involved in
concept formation. Dr. Chen was also responsible for manuscript edits and submission.
Chapter 4 of this thesis has been submitted as Talina Vanessa Nieto-Nieto, Yi Xiang Wang,
Lech Ozimek, Lingyun Chen, Inulin at low concentrations significantly improves the gelling
properties of oat protein – a molecular mechanisms study. In this chapter my responsibility
was to collect and analyze all the data as well as to write down the manuscript. Assistance
v
was received from Dr. Yi Xiang Wang in obtaining the SEM micrographs. Dr. Lingyun Chen
was the supervisory author and was involved in concept formation. Dr. Chen was also
responsible for manuscript edits and submission.

vi
Acknowledgements
This has certainly been a long and sometimes strenuous journey, which I would have never
completed without the help and support of so many.
Many thanks to my supervisors Dr. Lingyun Chen and Dr. Lech Ozimek. It has been a
privilege to work with you. I deeply appreciate your willingness to help in any possible way.
I also would like to thank Dr. Thava Vasanthan for his constructive suggestions and input.
To the members of the labs 2-57 and 3-31 with whom I shared lots of hard work hours but
also many blissful birthday cakes. Thank you for your companionship and help. Special
thanks to Dr. Takuo Nakano for your friendship and your inspiring curiosity.
To all my other friend with whom I didn’t share the lab but certainly shared a lot of time that
helped me keep my sanity and definitely made this journey much more enjoyable. Your
friendship has meant a great deal for me.
I would like to acknowledge the National Council of Science and Technology (CONACyT)
for supporting my doctoral studies with the grant number 213956.
Finally, I would like to thank my family for their support and love. To my sister and my
mother, in spite of the distance I always have you in my heart and in my mind. And to my
sweet loving husband, thank you for your patience, support and for always bringing joy in
my life. Your words of encouragement always helped me to get back on track.

vii
Table of Contents
Abstract .............................................................................................................................................. ii
Preface ............................................................................................................................................... iv
Acknowledgements ....................................................................................................................... vi
Table of Contents .......................................................................................................................... vii
List of Tables ..................................................................................................................................... x
List of Figures .................................................................................................................................. xi
List of Abbreviations ................................................................................................................... xv
Chapter 1 ........................................................................................................................................... 1
1. Introduction ........................................................................................................................................ 1
1.1. Oat ................................................................................................................................................................... 1
1.2. Oat protein .................................................................................................................................................. 5
1.3. Protein gels ................................................................................................................................................. 7
1.4. Network structure of protein gels ................................................................................................... 10
1.5. Gelation mechanism .............................................................................................................................. 11
1.6. Interactions involved in gel structure ............................................................................................ 13
1.7. Protein modification to improve gelling properties ................................................................ 17
1.8. Protein-polysaccharide interactions .............................................................................................. 30
1.9. Research hypothesis and objectives ............................................................................................... 37
Chapter 2 ......................................................................................................................................... 42
2. Continuous Membrane Bioreactor (CMBR) to Produce Nanoparticles from Milk
Components .............................................................................................................................................. 42

viii
2.1. Introduction .............................................................................................................................................. 42
2.2. Nanomaterials.......................................................................................................................................... 44
2.3. Nanotechnology and nanofiltration ................................................................................................ 48
2.4. Membrane bioreactors in the nanoscale process ..................................................................... 49
2.5. Conclusion ................................................................................................................................................. 60
Chapter 3 ......................................................................................................................................... 61
3. Effect of partial hydrolysis on structure and gelling properties of oat globular
proteins ...................................................................................................................................................... 61
3.1. Introduction .............................................................................................................................................. 61
3.2. Materials and methods ......................................................................................................................... 65
3.3. Results and discussion ......................................................................................................................... 70
3.4. Conclusion ................................................................................................................................................. 86
Chapter 4 ......................................................................................................................................... 86
4. Inulin at low concentrations significantly improves the gelling properties of oat
protein – a molecular mechanisms study ...................................................................................... 86
4.1. Introduction .............................................................................................................................................. 86
4.2. Material and Methods ........................................................................................................................... 89
4.3. Results and Discussion ......................................................................................................................... 94
4.4. Conclusion .............................................................................................................................................. 123
Chapter 5 ....................................................................................................................................... 125
5. Effect of different polysaccharides on phase separation during thermal gelation of
oat protein. .............................................................................................................................................. 125
5.1. Introduction ........................................................................................................................................... 125
5.2. Materials and methods ...................................................................................................................... 127

ix
5.3. Results and discussion ...................................................................................................................... 132
5.4. Conclusion .............................................................................................................................................. 160
Chapter 6 ...................................................................................................................................... 162
6. Final remarks................................................................................................................................. 162
6.1. Summary and conclusions ............................................................................................................... 162
6.2. Significance of this work ................................................................................................................... 167
6.3. Perspectives ........................................................................................................................................... 168
References .................................................................................................................................... 169

x
List of Tables
Table 1 Nanofiltration processes proposed for concentration, purification or separation of
relevant food ingredients................................................................................................. 52
Table 2 Amino acid composition of oat protein isolate (OPI) and its hydrolysates. .............. 74
Table 3 Effect of pH on the denaturation temperature and enthalpy change of OPI and its
hydrolysates. ................................................................................................................... 76
Table 4 Oat protein derived gels formed under different pH and temperature conditions ..... 78
Table 5 Mechanical properties of OPI and OPI-inulin gels prepared at 100˚C ...................... 96
xi
List of Figures
Figure 1 Behavior of protein-polysaccharide mixtures due to associative or segregative
interactions. a) Incompatible and two phase system, b) Compatible and one phase
system, c) Soluble complexes and one phase system and d) Insoluble complexes and
two phase system. ........................................................................................................... 34
Figure 2 SDS polyacrylamide gel electrophoresis of oat protein and its hydrolysates. Lanes:
1. Standard protein markers, 2. OPI, 3. OPI-F, 4. OPI-A, 5. OPI-P, and 6. OPI-T. ....... 71
Figure 3 Size exclusion chromatograms of oat protein and its hydrolysates .......................... 73
Figure 4 Mechanical properties of oat protein derived gels prepared at 120 °C. a. Hardness
(N), b. cohesiveness and c. springiness (mm). ................................................................ 81
Figure 5 SEM images of the cross section of oat protein derived gels prepared at 120 °C.
Scale bar represents 5 µm. a. OPI (pH 7), b. OPI-F (pH 7), c. OPI-F (pH 9), d. OPI-T
(pH 7), and e. OPI-T (pH 9). ........................................................................................... 84
Figure 6 Water holding capacity of oat protein derived gels prepared at 120˚C .................... 85
Figure 7 Water holding capacity of OPI and OPI-inulin gels prepared at 100˚C ................... 98
Figure 8 SEM images of the cross section of gels prepared with OPI (a,b and c), OPI-I 0.1%
(d, e and f) and OPI-I 0.5% (g, h, and i) at different pH. Scale bar represents 20m .. 100
Figure 9 SEM image of the cross section of gels prepared with OPI (a) OPI-I 0.1% (b) and
OPI-I 0.5% (c) at pH 7.Scale bar represents 5 µm. Arrows indicate cell walls ............ 100
Figure 10 Storage modulus (G') of OPI and OPI-inulin mixtures (0.1 and 0.5%), during heat-
induced gelation at pH 7 ............................................................................................... 103
Figure 11 Storage modulus (G') of OPI and OPI-inuin mixtures (o.1 and 0.5%), during heat-
induced gelation at pH 2.5 ............................................................................................ 104

xii
Figure 12 Storage modulus (G’) of OPI and OPI-inulin mixtures (0.1 and 0.5%), during heat-
induced gelation at pH 5 ............................................................................................... 105
Figure 13 Storage modulus (G’) of OPI at pH 7 (a), pH 5 (b) as a function of angular
frequency....................................................................................................................... 108
Figure 14 Storage modulus (G’) of OPI-I 0.5% at pH 7 (c) and pH 5 (d) as a function of
angular frequency.......................................................................................................... 109
Figure 15 Confocal microscopic photographs of OPI and OPI-inulin (0.1 and 0.5%) at pH 7
as a function of temperature. Scale bar represents 10 m ............................................ 111
Figure 16 Confocal microscopic photographs of OPI and OPI-inulin (0.1 and 0.5%) at pH 2.5
as a function of temperature. Scale bar represents 10 m ............................................ 112
Figure 17 Confocal microscopic photographs of OPI and OPI-inulin (0.1 and 0.5%) at pH 5
as a function of temperature. Scale bar represents 10 m ............................................ 113
Figure 18 Number based particle size distribution of (a) OPI as a function of heating
temperature at pH 7 ....................................................................................................... 115
Figure 19 Number based particle size distribution of (b) OPI-I 0.1% as a function of heating
temperature at pH 7 ....................................................................................................... 116
Figure 20 Number based particle size distribution of (c) OPI-I 0.5% as a function of heating
temperature at pH 7 ....................................................................................................... 117
Figure 21 Deconvoluted spectra of (a) OPI at pD 7, as a function of temperature .............. 119
Figure 22 Deconvoluted spectra of (b) OPI-I 0.1% at pD 7, as a function of temperature . 120
Figure 23 Deconvoluted spectra of (c) OPI-I 0.5% at pD 7, as a function of temperature. 121
Figure 24 SEM images of the cross section of oat proetein gels prepared at 110˚C without
salt. Scale bar represents 5 BBm. A and B correspond to OP-DE gels prepared at pH 3

xiii
and 7 respectively. C and D corespond to OP-CA gels prepared at pH 3 and 7
respectively. E ............................................................................................................... 134
Figure 25 Gel properties of OP and OP-polysaccharide gels prepared at pH 3 and 7 and
without salt. ................................................................................................................... 137
Figure 26 SEM images of the cross section of oat protein gels prepared at 110˚C with 50
mM NaCl. Scale bar represents 5 μm. A and B correspond to OP-DE gels prepared at
pH 3 and 7 respectively. C and D correspond to OP-CA gels prepared at pH 3 and 7
respectively. E and F correspond to OP-CH gels prepared at pH 3 and 7 .................... 139
Figure 27 Gel properties of OP and OP-polysaccharide gels prepared at pH 3 and 7 and 50
mM NaCl. ..................................................................................................................... 140
Figure 28 Mechanical properties of OP and OP-polysaccharide gels prepared at pH 3 and 7
and 150 mM NaCl. ........................................................................................................ 141
Figure 29 Storage modulus (G’) of oat protein derived gels prepared at pH 7 without salt and
50 mM NaCl as a function of angular frequency .......................................................... 146
Figure 30 Changes in turbidity and in the particle size distribution (number based) of
unheated and heated OP and OP-polysaccharide suspensions without salt and 50 mM
NaCl .............................................................................................................................. 149
Figure 31 Surface hydrophobicity of OP and OP-polysaccharide suspensions without salt and
50 mM NaCl ................................................................................................................. 152
Figure 32 Deconvoluted spectra of OP and OP-CA gels without salt and 50 mM NaCl at pH
7..................................................................................................................................... 154
Figure 33 Confocal microscopic photographs of OP and OP-polysaccharide gels formed at
pH 7. Scale bar represents 100 μm ............................................................................... 155

xiv
Figure 34 Storage modulus (G’) of OP, OP-DE and OP-CA without salt during heat-induced
gelation at pH 7. Doted line represents the heating temperature profile. Samples were
heated from 25 to 95˚C, hold at 95˚C for 5 min, and then cooled down to 25˚C at a rate
of 1.5˚C/min .................................................................................................................. 157
xv
List of Abbreviations
DSC differential scanning calorimetry
β-LG beta lactoglobulin
2-ME 2-mercaptoethanol
Asx Asp+Asn
CMBR continuous membrane bioreactor
CP concentration polarization
CSLM confocal laser scanning microscopy
D denatured
DH degree of hydrolysis
DMSO dimethyl sulfoxide
EMR enzymatic membrane reactor
FAO Food and Agriculture Organization
FITC fluorescein isothiocyanate
FTIR Fourier transform infrared spectroscopy
G' storage modulus
G'' loss modulus
Glx Glu+Gln
GOS galactooligosaccharide
GRAS generally recognised as safe
h hydrolysis equivalents
Ho surface hydrophobicity
htot total amount of peptide bonds in the protein substrate

xvi
I intermediate
MF microfiltration
Mw Molecular weight
N native
NF nanofiltration
NLC nanostructured Lipid Carriers
NP nanoparticle
NSPS non-starch polysaccharides
OP oat protein
OP-CA oat protein- carrageenan
OP-CH oat protein-chitosan
OP-DE oat protein-dextrin
OPA o-phthaldialdehyde
OPI oat protein isolate
OPI-A alcalase oat protein hydrolysate
OPI-F flavourzyme oat protein hydrolysate
OPI-I oat protein isolate-inulin
OPI-P pepsin oat protein hydrolysate
OPI-T trypsin oat protein hydrolysate
OS oligosaccharide
SDS sodium dodecyl sulfate
SDS-PAGE sodium dodecyl sulfate polyacrylamide gel
SE-HPLC size exclusion high performance liquid chromatography

xvii
SEM scanning electron microscopy
SLN solid lipid nanoparticle
SN-TCA soluble nitrogen after trichloroacetic acid precipitation
Td denaturation temperature
TG transglutaminase
TNBS 2,4,6-trinitrobenzenesulfonic acid
TPA textural profile analysis
UF ultrafiltration
WHC water holding capacity
WHO World Health Organization
G Gibbs free energy
Hd enthalpy of denaturation
H enthalpy of mixing
S entropy of mixing
ζ zeta potential


1
Chapter 1
1. Introduction
1.1. Oat
Avena sativa (common oat) is the most important among the cultivated oat varieties. Oat is
an annual grass from Asiatic origin. During early growth, the oat plant consists of leaves and
a shortened stem, giving a rosette type plant. The tiller grow into additional “branch plants”
or tillers and under favorable conditions, the plant can form up to 30 tillers. The main stem
and tillers can reach up to 2 or more feet, depending on variety and growing conditions.
These stems terminate in a large panicle that bears flowers and seeds or kernels. Each main
and lateral stem as well as branch stem terminates in a spikelet that is removed during
threshing. Generally two kernels, but occasionally one, are produced per spikelet. The oat
kernel, also termed caryopsis or groat, is the part remaining after the removal of palea and
lemma. It is elongated spindle shaped, up to about 0.5 inches length and 0.125 inches or less
in width. It is generally covered with fine, silky hairs and includes the seed coat layers of
cells, starchy endosperm and embryo. Oat is an important food grain in temperate regions of
the world. Modern oat probably originated from the Asian wild red oat, which grew as a
weed in other grain crops 1,2
.
Oat contains high amounts of valuable nutrients such as soluble fibers, proteins, unsaturated
fatty acids, vitamins, minerals, and antioxidants. The main constituent of oat is carbohydrate,
with starch comprising the majority of this carbohydrate reserve. Very few sugars and
2
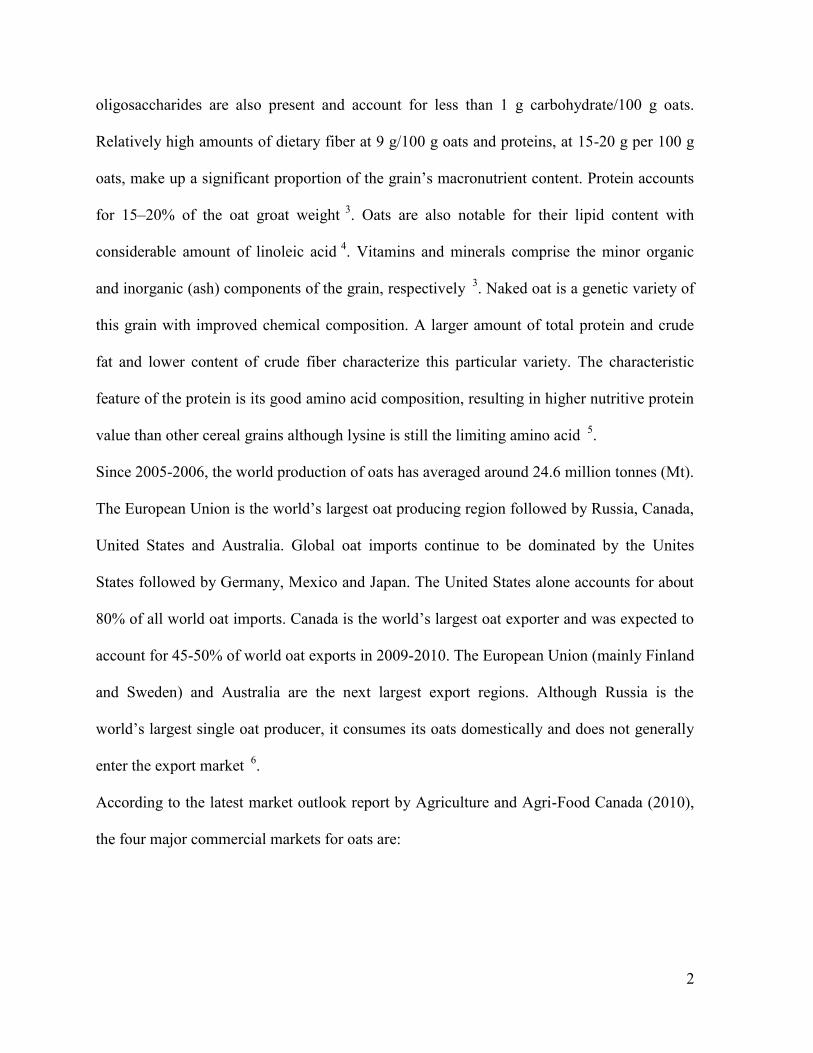
oligosaccharides are also present and account for less than 1 g carbohydrate/100 g oats.
Relatively high amounts of dietary fiber at 9 g/100 g oats and proteins, at 15-20 g per 100 g
oats, make up a significant proportion of the grain’s macronutrient content. Protein accounts
for 15–20% of the oat groat weight 3
. Oats are also notable for their lipid content with
considerable amount of linoleic acid 4
. Vitamins and minerals comprise the minor organic
and inorganic (ash) components of the grain, respectively 3
. Naked oat is a genetic variety of
this grain with improved chemical composition. A larger amount of total protein and crude
fat and lower content of crude fiber characterize this particular variety. The characteristic
feature of the protein is its good amino acid composition, resulting in higher nutritive protein
value than other cereal grains although lysine is still the limiting amino acid 5
.
Since 2005-2006, the world production of oats has averaged around 24.6 million tonnes (Mt).
The European Union is the world’s largest oat producing region followed by Russia, Canada,
United States and Australia. Global oat imports continue to be dominated by the Unites
States followed by Germany, Mexico and Japan. The United States alone accounts for about
80% of all world oat imports. Canada is the world’s largest oat exporter and was expected to
account for 45-50% of world oat exports in 2009-2010. The European Union (mainly Finland
and Sweden) and Australia are the next largest export regions. Although Russia is the
world’s largest single oat producer, it consumes its oats domestically and does not generally
enter the export market 6
.
According to the latest market outlook report by Agriculture and Agri-Food Canada (2010),
the four major commercial markets for oats are:

3
Milling/Industrial market, which requires oats that meet stringent purity
requirements; have good groat yield, uniformity and color (not stained).
Performance feed market, mainly the southern US horse market, demands the
highest quality white oats.
General feed market, mainly for beef cattle and horses is small relative to the
market for barley and corn.
Specialty market, which includes organic, birdseed, and health food markets.
Despite that only a minor amount of the total oat production is destined to human
consumption, various oat-derived products are included in the everyday diet of many
households. In recent years, the demand of oat for human consumption has increased due to
the dietary benefits of β-glucan. Daily consumption of 3 g of soluble fiber derived from oat
in combination with a diet low in saturated fat and cholesterol may reduce the risk of heart
disease. Thus the FDA 7
has allowed this health claim to be made on the labels of oat-
containing foods, which must provide at least 0.75 grams of soluble fiber per serving 8
and
more recently a similar health claim has been also established in Canada 9
. The
incorporation of β-glucan into food products has motivated the industry to develop various
methods for its concentration and extraction 10
. In many of these processes the residue is
comprised of a protein rich fraction 10
, thus a natural by-product of this practice is the oat
protein, which could be exploited as value added ingredient.
Many different types of products can be produced from the oat grain depending on the
processing steps and conditions. For example oat flakes, steel cut groats, oat bran, oat flour,
extruded oat products, oat bread and oat pasta and noodles. In general, the processing of oats

4
includes cleaning, heat treatment, de-hulling, cutting and flaking (milling). Since, oat
contains high levels of lipids, which can be hydrolyzed to fatty acids by lipolytic enzymes
found in the oat grain and later on cause rancidity due to further oxidation of the final oat
product. The first step after the grain has been clean is heat treatment in order to inactivate
oxidative enzymes and also the characteristic oat aroma is developed. During the flaking of
oats, steam is added to increase the moisture content in order to soften the groats so that they
can form flakes with minimum breakage. The flaking of intact oat groats produces rolled oats
that are the thickest of the standard oat flake products, which are about 0.5 to 0.9 mm thick.
The thicker flakes require longer cooking periods and maintain flake integrity for extended
periods 11,12
. By cutting the groats into pieces, thinner flakers can be produced; usually 0.25
to 0.6 mm thick, and these thinner flakes require less cooking time. Thinner flakes are often
used for instant oatmeal. Oat flour can be produced by milling oat flakes or groats using a
special hammer mill where exhaust air is drawn through the system to prevent the relatively
high fat flour from sticking to the sieves of the mill. Oat flour is used as an ingredient in a
wide variety of food products. Oat bran is produced by grinding clean oat groats or rolled
oats. Sieving, bolting and/or other suitable means separate the resulting oat flour. Oat bran is
not more than 50% of the starting material and has a total beta-glucan content of at least
5.5% (dry weight basis) and a total dietary fiber content of at least 16% (dry weight basis).
To produce oats for instant baby foods, rolled oats are milled and mixed with water, drum
dried, and the thin film formed in the extract is milled and put in the products. Oatmeal is
consumed on a worldwide basis, but North America, the United Kingdom and northern
Europe represent the principal markets. Cold plate cereals or ready to eat products represent
the second major use for oat products. Oat products are also used as ingredients in a wide

5
variety of bread and other baked products. These ingredients provide unique flavor and
moisture retention characteristics, as well as enhance the nutritional benefits of the products.
Oatmeal and oat flour are major components in infant foods. In many instances, this is the
baby’s first introduction to solid foods. Oat flour is a major constituent in granola bars and
baking mixes. It is used as a thickening agent in soups and sauces and as a meat extender and
fat replacer 12
.
1.2. Oat protein
Oat contains high amounts of protein, averaging 11–15% in an oat kernel with a hull. In
groats, with the high cellulose, low protein hull removed, oat protein can be as high as 12.4–
24.5%, making it the highest amount of protein among commonly consumed cereal grains 3.
Additionally, the nutritive quality of oat protein is superior to other cereal proteins due to its
higher lysine content 3
. Glutelins in oat are found in very low proportion. Albumins represent
at most 10% of the oat storage proteins. Likewise, oat prolamins form approximately 10-
15%. The albumin and prolamin fractions together account for 20 to 25% of the total protein.
Therefore the globulin proportion in oat is as high as 70 to 80% 13
. The major albumin is
reported to have a molecular weight of 15 kDa and a minor component of 6 kDa was also
found. And the isoelectric point of this fraction composed of various components was found
between 4-7.5 14
. Unlike most cereals, oat displays a much-reduced level of alcohol soluble
proteins or prolamins, which are most efficiently extracted from the endosperm with ethanol
solution. Prolamins are deficient in lysine and responsible for the lower nutritive profile of
the high prolamin cereals in comparison to oat 13
. Oat prolamins have two major components
with molecular weight of 20 and 43 kDa, respectively and a minor of 36 kDa 14
. The major
6
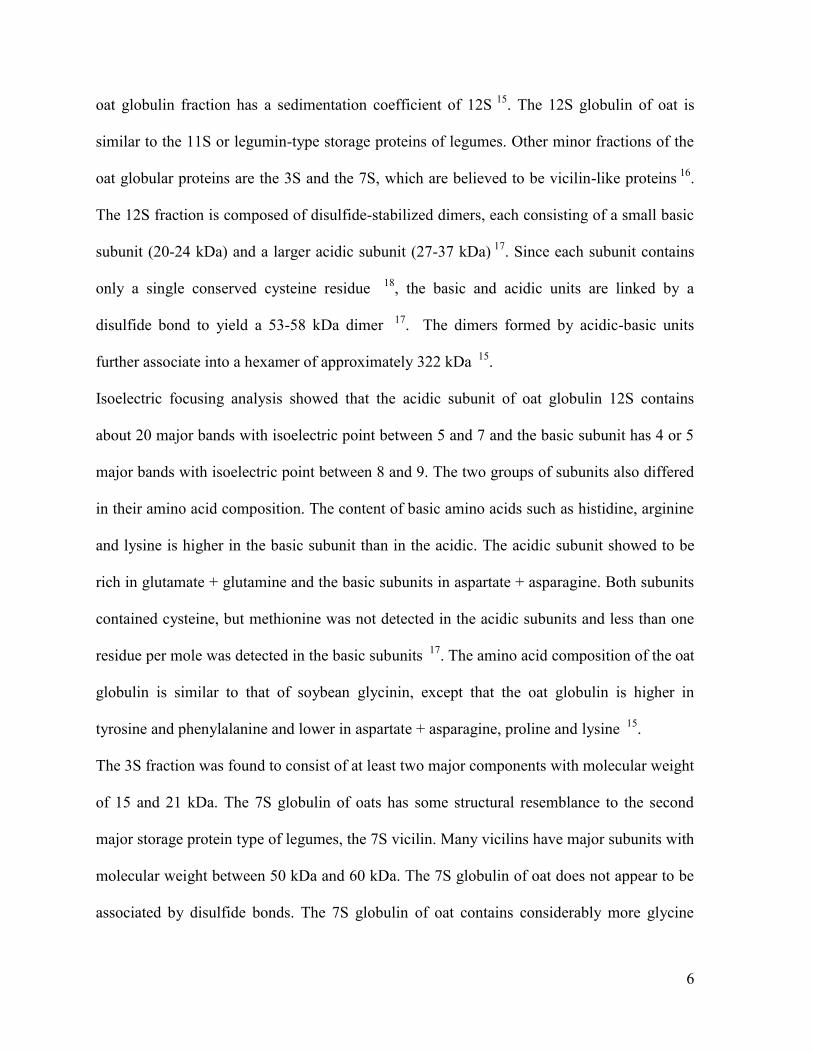
oat globulin fraction has a sedimentation coefficient of 12S 15
. The 12S globulin of oat is
similar to the 11S or legumin-type storage proteins of legumes. Other minor fractions of the
oat globular proteins are the 3S and the 7S, which are believed to be vicilin-like proteins 16
.
The 12S fraction is composed of disulfide-stabilized dimers, each consisting of a small basic
subunit (20-24 kDa) and a larger acidic subunit (27-37 kDa) 17
. Since each subunit contains
only a single conserved cysteine residue 18
, the basic and acidic units are linked by a
disulfide bond to yield a 53-58 kDa dimer 17
. The dimers formed by acidic-basic units
further associate into a hexamer of approximately 322 kDa 15
.
Isoelectric focusing analysis showed that the acidic subunit of oat globulin 12S contains
about 20 major bands with isoelectric point between 5 and 7 and the basic subunit has 4 or 5
major bands with isoelectric point between 8 and 9. The two groups of subunits also differed
in their amino acid composition. The content of basic amino acids such as histidine, arginine
and lysine is higher in the basic subunit than in the acidic. The acidic subunit showed to be
rich in glutamate + glutamine and the basic subunits in aspartate + asparagine. Both subunits
contained cysteine, but methionine was not detected in the acidic subunits and less than one
residue per mole was detected in the basic subunits 17
. The amino acid composition of the oat
globulin is similar to that of soybean glycinin, except that the oat globulin is higher in
tyrosine and phenylalanine and lower in aspartate + asparagine, proline and lysine 15
.
The 3S fraction was found to consist of at least two major components with molecular weight
of 15 and 21 kDa. The 7S globulin of oats has some structural resemblance to the second
major storage protein type of legumes, the 7S vicilin. Many vicilins have major subunits with
molecular weight between 50 kDa and 60 kDa. The 7S globulin of oat does not appear to be
associated by disulfide bonds. The 7S globulin of oat contains considerably more glycine
7
than any reported vicilin 17
. In general the 3S and 7S fractions, both contained high glycine,
but the 7S components contained more glutamate + glutamine and arginine 17
.
The amino acid content analysis in previous research, indicated that seven of the eight
essential amino acids (isoleucine, leucine, lysine, methionine, phenylalanine, threonine, and
valine), made up approximately 32.3% and 31.2% of total amino acids for oat protein isolate
(OPI) and oat flour respectively 19
. The percentage of some essential amino acids or amino
acid pairs of the OPI fulfilled or exceeded their respective percentages stated in the ideal
protein of World Health Organization (WHO). However, the overall quality of OPI was
slightly compromised by the low level of lysine and methionine, which accounted for only
72.7% and 51.2% of the lysine and methionine required for children as recommended by
Food and Agriculture Organization of the United Nations (FAO)/WHO 19
.
1.3. Protein gels
Functional properties directly impact the behavior of proteins in food systems during
processing, storage, preparation and consumption, which will determine the usefulness of the
protein as a food ingredient 20
. Functional properties can be classified as organoleptic, which
have a direct impact on the color, flavor, texture of food; as hydration related such as
solubility and viscosity; surface related such as emulsifying and foaming; or textural such as
gelling properties and dough formation 21
. It is common that food proteins often show
various functional properties. The different functionalities that proteins can exert may depend
on various molecular features such as the type and availability of amino acids, molecular
size, shape, conformation, net charge and protein/protein interactions 20
. These molecular
features are considered as inherent factors of the protein, nonetheless there are also external

8
factors that may also have a direct impact on the functional properties exerted by the protein.
These external factors primarily relate to the environmental conditions (pH, ionic strength,
temperature) under which the protein is used. Thus it is common to find that proteins
extracted by different methods or that have been processed by different treatments, often
have different functionalities. It must be considered that the external factors have direct effect
on the protein conformation and thus over the intrinsic factors 20,21
.
Gelation is one of the most important functional properties of protein as it provides texture
and support in foods. Gels have been defined as three-dimensional networks that entrap large
quantities of water while remaining insoluble in aqueous solution due to different interactions
22, or as an intermediate state between a solid and a liquid, possessing both elastic (solid) and
flow (liquid) characteristics 23
. Proteins can form gels and provide a structural matrix for
holding water, flavor, sugar and food ingredients in various food applications but also to
provide texture and mechanical support in foods. Protein gelation is useful not only for the
formation of solid viscoelastic gels but also for improving other functional properties related
to the way protein interacts with water molecules producing increase of thickness or
increased water absorption of the food matrix.
A Protein solution can be changed into a gel by a range of processes that increase
intermolecular interactions. Once the degree of intermolecular linking reaches a point where
a continuous network is formed, the macroscopic property of elasticity is developed and the
system is considered a gel 24
. This is reflected as a viscoelastic system that shows a storage
modulus (G’) larger than the loss modulus (G’’) 23
.
The formation of a gel can be classified broadly as physical induced (heat, pressure) and
chemically induced (acid, ionic, enzymatic) gelation reactions 25
. Thermal gelation is the

9
most common method to obtain protein gels and in this process, heat induces unfolding of
protein, which leads to a non-native conformational state and hence altered functional
behavior. Generally, heating temperatures above the minimum denaturation temperature of
the proteins is required for gel formation and specifically, the heating conditions used to form
a gel greatly influence its rheological properties 26
. A simple model for protein denaturation
is:
D
Where a native (N) structure is reversibly converted to an intermediate (I) state where tertiary
structure is changed but much of the secondary structure remains, and further unfolding
produces a denatured (D) state 24
. There are various molecular properties associated with
each state that have an impact on functional properties. Molecular weight and primary
structure will not be changed during the denaturation, nevertheless the isoelectric point can
vary due to intermediate and denatured (unfolded) structures exposing charged amino acids
to new local environments. The main changes are in secondary and tertiary structure that can
alter the surface exposure of amino acids. This cumulates in an increase in interaction
potential, favoring aggregation 24
. A subsequent stage after protein unfolding is the
association and aggregation of unfolded molecules with newly exposed amino acids to form
complexes of higher molecular weight 23
. The association and aggregation stage can only
result into a cross-linked network if the protein concentration is high enough to allow
interconnection of the complexes formed 27
. If the protein concentration is low, the
association and aggregation stage will cause precipitation. In contrast at the critical gel
concentration, aggregates will react or crosslink with other aggregates and after such

10
intermolecular aggregation stage, the number of crosslinks has increased as well as the
molecular weight of the final aggregate 28
.
1.4. Network structure of protein gels
In thermal gelation, more factors other than the heating temperature will have an effect on the
unfolding and aggregation process. For example, the pH can change the net charge of the
molecules and alter the attractive or repulsive forces between molecules as well as the
interactions between molecules and solvent. In a similar way the salt content can increase the
ionic strength of the gel, which causes the electrostatic forces between molecules to be
reduced or neutralized. Thus these factors will define the form of association (type of
interactions) that will participate into the gel network formation. Depending on the initial pH
and ionic strength it is possible to obtain either transparent or turbid gels due to very well
studied structural differences 29
.
At low ionic strength, turbidity increases around the isoelectric point of the protein, where
the net charge is zero. Likewise at pH values far from the isoelectric point, increasing the
ionic strength reduces the electrostatic interactions and enhances turbidity 30
. These
conditions, promote the formation of particulates gels, which are characterized by random
association into large and seemingly spherical aggregates linked together to form the gel
network 27
.
Under conditions that promote strong repulsive interactions between polypeptide chains
transparent gels are formed, these so-called fine stranded gels are composed of less flexible
linear strands and are generally prepared at pH values far from the isoelectric point of the
protein and under low ionic strength. In the case of fine stranded gels the rate of aggregation

11
is slow as the attractive forces between denatured polypeptide chains are small, since
repulsion forces, dominate the molecules present 23,25,27
. Gels with fine stranded structures
have high water retention capacity whereas gels having nonhomogeneous or particulate
structure present a high degree of syneresis 31
1.5. Gelation mechanism
In general, the gel formation process is considered a multi-step process in which as
previously mention the first pre-requisite is to achieve a sufficient degree of unfolding in the
protein molecules in order to attain a new reorganization of the protein matrix.
Previously, the gel formation mechanism, for fine stranded and particulate gels prepared with
β-lactoglobulin, was studied 27
and it was proposed that the structural differences were
related to the different course of the gel formation process. In the case of fine stranded gels
dimers were dissociated into monomers prior to aggregation and under conditions promoting
the formation of fine stranded gels, the protein undergoes significant structural changes
before the aggregation step takes place. In contrasts, in the case of particulate gels the protein
experiences a slight unfolding and remains in the dimeric form until aggregation. Since
monomers may aggregate in a different way than dimers, different structures may be
produced. Consequently as the protein is more unfolded in the case of fine stranded gels, a
closer parallel alignment of the polypeptide chains takes place, forming linear strands. This
favors intermolecular interactions and hence, more and stronger interactions are developed in
fine stranded gels. On the other hand, near the isoelectric point the protein structure is less
disturbed and remains in the dimeric form and the gelation process commences with dimers

12
as the building block, which may hinder the formation of strong bonds as aggregation takes
place 27
.
Similar mechanisms of protein gelation have been proposed. For example, Clark (2001)
proposed a kinetic model for the formation of uniform (pH far from isoelectric point, and low
salt content) thermally induced protein gels, which considered three steps for network
formation. The first step consisted of the protein unfolding. The second step involved the
aggregation of linear filament via nucleation and growth and the third step entailed the
random cross-linking of the filaments 32
. For the nucleation and growth process, it was
proposed that a number of unfolded monomers had to form a stable nucleus before other
unfolded species could add on, one by one, in a linear growth mechanism and the growth of
the linear aggregates was terminated by reaction with other chains or with other reactive
species 32
. Various models have been proposed to explain the gel formation mechanism,
however the common consideration is that basic units (reactive molecules) work as building
blocks. The way the building block link will be defined by some inherent characteristics such
as size and reactivity (exposure of reactive amino acids). This will ultimately influence the
degree of order under which the protein matrix is reorganized and will affect the mechanical
characteristics of the gel 25
. The fractal model has been very useful for describing aggregation
and gelation of proteins. According to this model, protein gels are formed by primary
particles that aggregate to form clusters with a fractal structure, which may ultimately lead to
a gel assembled from fractal clusters. The fractal model also considers that the gel formation
process is also affected by other relevant factors such as the; 1) the size of the building
blocks of the fractal clusters, 2) the amount of protein incorporated in the fractal cluster at the
moment the gel is formed and, 3) the way in which the fractal clusters are linked together 33
.

13
The percolation model associated to gelation envisions a lattice where monomers are placed
and then randomly introduce a certain proportion of bonds connecting these monomers. This
is done by estimating the probability of the site occupation, or of the bond formation in the
lattice. As the bonding advances, clusters of monomers (aggregates) are formed, and at a
critical threshold of bonding, the gel point is observed in the form of a molecule that now
covers the entire percolation lattice 34
. The physical properties (molecular weight, viscosity,
elastic modulus) of a system change as the critical gel point is reached 34
.
1.6. Interactions involved in gel structure
The gel properties are developed due to the crosslinking of the basic units or building blocks
leading to the assembly of a three-dimensional network. This assembly is done by the
balance between repulsive and attractive interactions. The repulsive interactions are always
nonspecific and with momentary duration. They result from excluded volume effect and/ or
electrostatic interactions and tend to be weak, except at very close range or very low ionic
strength 35
. Van der Waals, hydrophobic and hydrogen bonding and even ionic interactions
under the right pH conditions work as attractive interactions 35
. Thus the simultaneous
occurrence of all these interactions, both repulsive and attractive will determine the
arrangement of the three-dimensional network. Next, these interactions are discussed in
detail, as they are important for gel formation and property development.
1.6.1. Electrostatic interactions
Electrostatic interactions take place between electrically charged molecules. Oppositely
charged molecules (counter-ions) are preferentially attracted, whereas molecules of the same
charge (co-ions) are repelled. In the case of proteins, balanced electrostatic interactions are
14
critical in determining the gel network structure and influencing other gel properties. The net
charge on protein molecules greatly affects electrostatic attractive or repulsive forces and
thus interactions among protein molecules and with the solvent 26
. The sign, magnitude and
distribution of the charge on protein molecules are affected by changes in the ionic strength
and pH. When the protein is solubilized and the pH is adjusted to values below the isoelectric
point, the protein molecules will be positively charged. If the pH is adjusted above the
isoelectric point, then the protein molecules will be negatively charged. At the isoelectric
point the net charge is zero, because the number of positive and negative charges on the
protein are equal 36,37
. Similarly the strength and range of these interactions decrease with
increasing ionic strength 38
. A strong electrostatic repulsion force extensively opposes
protein-protein interactions preventing gel formation. Intramolecular electrostatic
interactions, both attractive and repulsive, control the level of folding/unfolding and
expansion of macromolecules, as well as their molecular flexibility 39
.
1.6.2. Excluded volume effect
These are repulsive interactions of short range arising from the highly unfavorable overlap of
full electron clouds. These interactions are also known as “steric repulsion” as they restrict
the relative spatial arrangements of macromolecules. The excluded volume effect is due to
the fact that the volume occupied by one biopolymer molecule in solution is not available to
other biopolymer molecules. Thus the size and shape of the biopolymer molecule/particle (as
determined by the macromolecular conformation/flexibility or aggregate architecture) is of
prime importance in relation to steric interactions. The excluded volume effect is associated
with a reduction in the mixing entropy of the system. The resulting steric interactions

15
contribute predominantly to phase separation that is commonly observed in mixed polymer
systems 39
.
1.6.3. Hydrogen bonds
Hydrogen bonds are short-range attractive interactions with ionic character 39
as this type of
bond occurs when a hydrogen atom attach to an electronegative atom such as nitrogen,
fluorine, oxygen or sulfur 35
. Hydrogen bonds can be so strong that they cause appreciable
alignment of the participating molecules 36
as in the case of α-helix and β-sheet structures of
proteins. This indicates the important contribution of hydrogen bonds to the secondary
structure of proteins and also the important involvement during folding/unfolding 39
.
Hydrogen bonds are commonly observed between charged and neutral biopolymers or
between two neutral biopolymers, forming junction zones between different biopolymer
molecules 40
. These bonds are enhanced by cooling 26
and become weaker with increasing
temperature 39
, which contributes to the loss in native biopolymer conformation
(denaturation) 41
.
1.6.4. Hydrophobic interactions
Hydrophobic interactions occur between non-polar groups separated by water. In an aqueous
media these attractive interactions make a strong contribution to biopolymer self-association
and complex formation 39
. Hydrophobic interactions between non-polar segments of adjacent
polypeptides are enhanced after heating as the protein molecule is expected to unfold and
expose buried non-polar groups prior to network formation 26
. Hydrophobic interactions are
mainly promoted by conformational and structural changes 35
. As these non-polar groups are
exposed in water, water molecules need to reorganize around the hydrophobic exposed
group; this changes the interaction energy and entropy of the system. As these changes are

16
thermodynamically unfavorable, whenever there is another non-polar group exposed in the
near surroundings, the formation of an intermolecular hydrophobic bond will be favored in
order to minimize the contact between water and non-polar groups 36,42
.
1.6.5. Van der Waals
Van der Waals interactions have little influence in the conformation of biopolymers in
solution, as not many changes are observer for this particular type of bond during the
folded/unfolded transition. Nonetheless, strong van der Waals interactions could work as
attractive forces favoring aggregation whenever a biopolymer molecule is large enough to act
as colloidal particle 36
. This type of interaction occurs between permanent dipoles and/or
induced (temporary and fluctuating) dipoles, and thus depends on the polarizabilities and
ionization energies of the two 37
. Van der Waals attraction is a fairly long-range interaction
of electrostatic origin, however at very short proximity, such attractive interaction is
transformed into strong repulsion 39
.
1.6.6. Disulfide bonds
Disulfide bonds are covalent bonds, which are very strong chemical linkages found in
globular proteins. Upon unfolding, proteins may expose internal disulfide bonds or
sulfhydryl groups, which can undergo disulfide/sulfhydryl exchange reactions with other
unfolded polypeptides chains, yielding covalent intermolecular disulfide bonds 42
. This
reaction usually occurs under alkaline conditions. Proteins are capable of forming both
intramolecular and intermolecular disulfide bonds under the appropriate conditions 36
. The
role of intermolecular covalent disulfide bonds in protein gelation may be related to their
ability to increase the length of the polypeptide chain, rather than as an initial network
primer. Having a longer polypeptide chain may increase molecular entanglements within the

17
gel structure, thereby restricting the relative thermal motions of the polypeptide 26
. The
formation of disulfide bonds requires a close proximity of the reactants and also enough time
since disulfide bond formation proceeds slowly as a result of the high activation energy 42
.
The interactions mentioned above play an important role to determine protein gel
microstructures and consequently the gel behavior under specific environmental conditions.
Understanding when and how these interactions occur will allow design of desirable
structures targeting different applications.
1.7. Protein modification to improve gelling properties
Proteins may have limited functionality that could constraint their utilization in food systems,
consequently, in many cases the modification of proteins is necessary in order to improved or
perhaps correct deficiencies in the functional properties exerted by a specific protein. As it
was mention earlier, changing some environmental conditions can easily alter protein
structures, for example; pH, salt content or temperature among many others conditions. It is
expected that as a result of an altered structure the functional properties of the protein can be
modified as well. The modifications produced in the functional properties of the protein may
be desirable or might be detrimental; nonetheless the application of various methods to
intentionally modify the functional properties of proteins has been studied by various
researchers with the underlining purpose of improving specific functional properties of
proteins 43-47
. Basically, chemical and enzymatic modification are two approaches used
widely to modify protein functional properties. In addition to these techniques, the inclusion
of polysaccharide to modify protein properties has also been widely studied 48-51
. A brief
18
review of the most common techniques is presented in the following text with emphasis on
their capacity to improve protein gelling properties.
1.7.1. Chemical modification
Chemical modification uses different derivatizing reagents that can modify the charge,
hydrophobicity, molecular size and conformation of protein molecules to yield desirable
functional properties. Additionally, acid or alkali treatments are used for the purpose of
deamidation or peptide bond cleavage to produce hydrolysates 52
. The primary effect on
chemical modification procedures is to increase protein solubility in general, and other
functional properties in consequence 53
1.7.1.1. Acylation
Acylation is known to alter protein conformation by promoting unfolding and increasing
dissociation of subunits from quaternary structure, as well as shifting the isoelectric point to
lower values 47
. This is done in a chemical reaction under which the positively charged
lysine Ɛ-amino groups are replaced with negatively charged carboxyl groups 54,55
. Therefore,
the electrostatic attraction between charge groups is reduced and hence critical protein-
protein interactions 53
. Acylation of protein using succinic anhydride is called succinylation
53. The change in conformation of succinylated proteins results from their high net charge
and replacement of short-range attractive forces in the native molecule with short-range
repulsive forces 47
. Succinylation enhances hydration and solubility, improves thermal
stability, and generally results in partial to complete unfolding of the protein molecule as the
extent of the reaction is allowed to proceed 53
. The gel hardness of oat protein gels was
greatly increased by both acetylation and Succinylation, particularly at lower pH 56
. Higher
G’ and G’’ values were observed in canola protein, after the protein structure was modified

19
through acetylation or succinylation. This improvement was associated to increased surface
hydrophobicity caused by the acylation process 57
.
1.7.1.2. Deamidation
Deamidation refers to the conversion of asparagine or glutamine amide groups to carboxylic
groups 58
. Thus glutamine and asparagine change into glutamic acid and aspartic acid
respectively. Proteins can be deamidated in acidic or basic environment, nonetheless the
harsh conditions used (extreme pH and high temperature) can lead to protein denaturation
and peptide bond hydrolysis which either produces a beneficial or detrimental effect on the
functional properties depending on the modification degree 58
. Hence, moderate conditions
are recommended to improve functional properties. Deamidation can alter functional
properties of proteins by increasing the number of their negative charges thus the enhanced
electrostatic repulsion 59
among protein molecules resulting into partial unfolding and
exposure of hydrophobic amino acid residues 60
. The isoelectric point of the protein is also
lowered as a consequence of the deamidation reaction. Deamidated proteins showed
improved emulsifying properties 60
and foaming properties 59
. Deamidation of glutelin from
Akebia trifoliata with edible organic acids such as citric and malic acid caused a significant
improvement of the gel network strength. It was proposed that deamidation induced
unfolding of glutelin, producing exposure of more sulfhydryl groups and hydrophobic sites,
causing extensive intermolecular protein-protein interactions 61
. Oat protein was deamidated
by mild acid hydrolysis. The pH for heat-induced gelation shifted from 9.7 to 7.5 and a weak
gel with good water retention ability was formed, Sample with 40.9% deamidation degree
had better gel-forming ability. This was attributed to increase in net negative charge and
surface hydrophobicity and a decrease in molecular size 62
.

20
1.7.1.3. Phosphorylation
During phosphorylation, phosphate groups can be covalently attached to free 𝜀-amino
groups on proteins using various reagents such as phosphorus oxychloride, phosphoric
acid or phosphorus pentoxide to effectively increase the net negative charge of the
protein 53,63,64. Some of the targeted groups are the –OH group of seryl, threonyl, and
tyrosyl residues and the N of the 𝜀-amino and imidazole group of lysyl and histidyl
residues of proteins, and under some conditions the guanidino groups of arginine may
be phosphorylated (above pH 11) 65. Phosphorylation has proven to be a useful method
for improving the functional properties of protein as it generally improves solubility, by
increasing net hydration of protein chemical groups due to the hydrophilicity of the
covalently attached phosphate group 64. The changes in these properties are a direct
result of increased surface electronegativity, thus the electrostatic repulsive forces are
increased 53. Nonetheless, some phosphorylation reactions have led to protein
crosslinking, which has shown to have an adverse effect on solubility but it appears to
increase viscosity and improve the gelling properties 64. Increased surface
hydrophobicity has been reported after dry-heating phosphorylation, possibly the
buried hydrophobic groups become exposed due to strong repulsive forces produced
by the negative charges introduced by phosphate groups 66. Gelling properties have
been improved by phosphorylation of a conjugated whey protein in terms of hardness,
resiliency, and water holding capacity values. In addition a transparent gel was formed,
this was not possible with whey protein before modification 67. Similarly, a firmer and
transparent heat-induced gel of phosphorylated egg white protein was obtained with
improved water holding capacity. Increased repulsion of negative charges caused by the

21
introduction of phosphate groups, makes the phosphorylated protein more unfolded,
exposing buried hydrophobic patches. This creates a controlled balance of hydrophobic
attractive interactions and electrostatic repulsion for the improvement of gelling
properties 66. Nevertheless, phosphorylated food proteins may not be well accepted in
the market, as normally this type of reaction requires harsh reaction conditions and it is
difficult to remove unreacted reagents from the final product 64,68.
1.7.1.4. Glycation
Glycation refers to the attachment of sugar residues to proteins through the Maillard reaction
69. The Maillard reaction, or non-enzymatic browning was first described by the French
biochemist Louis Maillard at the beginning of the 20th century. It consists of a condensation
of the carbonyl group of a reducing sugar with the ε-amino group of lysyl residues of proteins
and results in the so-called Amadori product via the formation of a Schiff base and water
release 70
. Heating is often used to accelerate this spontaneous reaction. Since lysine is the
limiting essential amino acid in many food proteins, its destruction can reduce the nutritional
value of proteins 71
. In most foods it is the 𝜺-amino group of the lysine residues in proteins
that are the primary source of reactive amino groups. The conjugation reaction could be
limited if the treated protein is a protein with reduced lysine content. Nonetheless, other
amino groups can participate in the reaction such as the imidazole group of histidine, the
indole group of tryptophan and the guanidine group of arginine but to a lesser extent 69
. The
Maillard reaction can be performed under wet or dry conditions. Normally the reaction
carried out under dry conditions is preferred as it provides higher stability, faster rate of
reaction and easier storage and handling than the aqueous dissolved wet method 72
. Several
reaction factors, such as temperature, time, pH, water activity, characteristics of the protein,

22
properties of the reducing sugar (mono- or polysaccharide) and the amino group:reducing
sugar ratio have an impact on the yield and type of Maillard reaction product 73
. Maillard
reaction has been used to improve the functional properties, such as solubility, heat stability,
emulsifying properties of proteins as covalent bonds are formed between the amino group of
the protein and the reducing sugar 74
. After glycation, the amount of lysine residues which
carry a positive charge are blocked, thus a change in the isoelectric point of the protein is
produced as the net charge of the protein becomes less positive 73,75
. The change in the net
charge of the glycated protein also results in the change of surface
hydrophilicity/hydrophobicity balance, which greatly affects the functional properties of the
protein 73
. Increase of the molecular weight is an obvious result of the glycation reaction, as
the attachment of the reducing sugar to the protein forms as larger molecule. Additionally,
changes in the functional properties may be attributed to repulsive steric interactions
provided by the glycated saccharides, as the steric interactions are a function of the number
and effective chain length of saccharides attached on the protein molecules 75
. One
advantage of the Maillard reaction over other chemical modification techniques is the
utilization of relatively milder and safer conditions. Nonetheless there is some controversy on
whether the Maillard reaction products exhibit some toxicity 76
. The Maillard reaction
significantly modified the mechanical properties of whey protein-dextran gels and even
prevented fracture when conjugate gels were subjected to 80% deformation in uniaxial
compression test 77
. Similarly, glycated ovalbumin gels showed increase breaking stress and
strain and the appearance of these gels was transparent 78
. Soy protein-xylose Maillard gels
showed less syneresis, higher breaking force and were more elastic. The improvement on
these gelling properties was attributed to formation of additional covalent crosslinks 79
.

23
1.7.2. Enzymatic modification
Enzymatic modification is generally carried out under mild pH and temperature conditions,
more specific and less prone to yielding undesired side reactions than chemical modification
procedures. Furthermore, enzymes can be inactivated after the desired functional property
has been reached, leading to better control of the final product quality 52
. The utilization of
enzymes holds the advantage that the toxicity is reduced and a wide variety of enzymes are
commercially available from animal, plant and microbial sources. The choice of enzyme
depends on the protein source and end user requirements 80
. The rate of reaction is
influenced by the pH and temperature. Only at a certain pH the enzyme is catalytically active
as the amino acid residues at the active site possess a particular charge allowing contact with
the substrate 81
. Increasing temperature can accelerate the rate of reaction, since the atoms in
the enzyme molecule have grater energy and a greater tendency to move. However, as the
temperature rises to values close to the denaturation temperature, the activity of the enzyme
is terminated. This is due to the unfolding of the protein chain after the breakage of weak
bonds; hence the overall reaction velocity drops 82
. Thus, by controlling pH and temperature
of the process, the extent of reaction and in consequence the final product can be carefully
custom-made.
1.7.2.1. Transglutaminase (TG)
Various enzymes such as transglutaminase, peroxidase and polyphenol oxidase are suitable
for cross-linking of protein. Especially TG has found numerous applications within the food
industry 83
. TG catalyzes the acyl-transfer reaction between γ-carboxyamide groups of
glutamine residues and the -amino group of lysine in proteins, leading to inter or
intramolecular cross-linking 84
. Three reactions can be catalyzed by TG 85
.
24
Cross-linking of proteins, resulting in the formation of high molecular weight
polymers.
In the presence of primary amines, TG can cross-link the amines to the glutamines of
a protein (acyl-transfer reaction).
In the absence of lysine residues or other primary amines, water will react as a
nucleophile, resulting in deamidation of glutamines.
Changing the functionality of food protein is the main purpose of TG treatment and each type
of reaction will produce different changes in the protein structure and therefore in the
functional properties. As a result of the crosslink reaction, larger polymers are formed as it
can be observed via sodium dodecyl sulfate polyacrylamide gel electrophoresis (SDS-PAGE)
86. In the case of the acyl-transfer reaction, changes in the charge distribution on the protein
surface, as well as change in the hydrophobicity can be produced as the reactive lysine may
be substituted by several compounds containing primary amino groups, resulting into
different derivatives 87
. Similarly to the chemical deamidation, in the case of the enzymatic
deamidation reaction, the functional properties such as solubility, emulsification foaming and
gelation can be improved. This reaction is suitable for substrates with low lysine and high
glutamine content, such as in the case of gluten 85
. The crosslinking reaction allows formation
of a well-developed viscoelastic gel network with increased G’ and G’’ values. TG-induced
gelation is characterized for the development of covalent bonds that constitute crosslinking
points in the gel network 88
. In the case of soy glycinin-rich gels, it has been proposed that in
addition to covalent bonds other interactions such as hydrophobic, hydrogen bonds and
disulfide bonds were involved in the formation of the gel network 89
. TG treatment of pea

25
protein reduced the minimum protein concentration to form heat-induced gels from 5.5%
(w/v) to 3% (w/v). Additional cross-linking among protein molecules increases the protein
gelation ability, thus less protein is required for gel formation 90
.
1.7.2.2. Enzymatic Hydrolysis
The enzymatic hydrolysis reaction consists of the cleavage of the peptide bonds that
constitute the protein chains by the specific catalytic action of an enzyme. During the
hydrolysis, a water molecule is added per every peptide bond broken 91
. This process is also
called proteolysis for the particular case of protein as a substrate and a protease as the
catalyst. Enzymatic hydrolysis of proteins is an important bioprocess to improve the physical,
chemical, functional and nutritional properties of proteins 92
. The hydrolysis of peptide
bonds can increase the number of charged groups and hydrophobicity, decrease molecular
weight and modify molecular configuration. Changes in functional properties of protein
hydrolysates are greatly dependent on the type of enzyme used, process variables, such as
temperature and pH, extent of the hydrolysis, which define the amino acid sequence within
the peptide structure 93
.
The degree of hydrolysis (DH) is used to measure the extent of the hydrolytic degradation,
and the number of peptide bonds cleaved during the reaction is the entity, which most closely
reflects the catalytic action of proteases 94
. Several methods of monitoring DH during protein
hydrolysis have been proposed. These include the pH-stat, osmometry, soluble nitrogen after
trichloroacetic acid precipitation (SN-TCA), 2,4,6-trinitrobenzenesulfonic acid (TNBS), o-
phthaldialdehyde (OPA), amino acid nitrogen and formol titration methods 95
.
With regards to the application, protein hydrolysated may be broadly classified in two
categories depending on the DH.

26
Limited hydrolysis: DH lower than 10% is used for modifying the functional
properties such as solubility, emulsifying, gelling or foaming properties as well as
water and oil adsorption 91,96
.
Extensive hydrolysis: DH higher than 10% is used as an excellent source of nitrogen
in hypoallergenic formulae and enteral diets and to activate biological activity of
peptides 91,96
.
Recent research has reported the effect of enzymatic hydrolysis over the gelling properties of
different proteins. In the case of peanut protein treated with alcalasae, it was proposed that
limited enzymatic hydrolysis produced a more unfolded conformation with exposed
sulfhydryl and disulfide bonds inside the molecules, which greatly contributed to the
formation of the gel network 43
. Another example is the limited enzymatic hydrolysis of
canola protein as a pretreatment for crosslinking with TG. It was suggested that enzymatic
hydrolysis opened up the protein structure, enhancing the effectiveness of TG and improving
gelation properties 97
. The effect of enzymatic hydrolysis on various substrates 98-100
have
been studied and results indicate that the improvement of the gelling properties depends on
the enzyme-substrate combination as well as the hydrolysis conditions. With increasing DH,
decreasing protein-protein interactions 43
are expected and the gelling properties may be
impaired. Hence, controlling hydrolysis conditions and the extent of the reaction by
monitoring the DH, is of the upmost importance in order to produce ingredients with new
functionalities.

27
1.7.2.2.1. Enzymatic membrane reactors
In the manufacturing of protein hydrolysates, the enzymatic bioconversion processes are of
increasing use in the production and transformation of protein raw materials. Predominantly,
batch hydrolysis of proteins in jacketed stirred tank reactor is the traditional procedure to
obtain hydrolysates with intended use as food ingredients. From the operational point of
view, batch type protein hydrolysis is simple and easy to control 91
. However hydrolysis in
the batch process involves high cost due to the large quantity of enzyme that is requires, high
energy, labor and capital cost. The typical batch reaction involves mixing the enzyme and
substrate in a large vat and holding temperature and pH constant for several hours. Upon
reaching the required degree of hydrolysis the reaction is terminated by changing the pH
and/or increasing the temperature to inactivate the enzyme, thus the enzyme is used only
once 101
. As alternatives, enzyme immobilization onto supports and membrane filtration have
been proposed. In both cases the aim of the process is; to hydrolyze the protein in order to
adjust its functional properties, remove the enzyme from the final product and to recover and
reuse the enzyme in further reaction if possible 91
. The enzymatic membrane reactor (EMR)
combines a membrane separation process with an enzymatic reaction. Thus, the utilization of
EMR ensures two processes (catalysis and separation) working simultaneously and
continuously 102
. The main objective of EMR is to ensure the complete rejection of the
enzyme in order to maintain the full activity inside the reaction volume. Depending on the
case, the enzyme could circulate freely on the retentate or could be immobilized onto the
membrane surface or inside its porous structure 103
. The use of soluble enzymes in
biotransformation presents significant advantages over immobilized enzymes in terms of
productivity, selectivity and economics. Immobilization procedures often lead to reduced

28
activity due to covalent or physical attachment to a carrier and additional mass transfer
resistance within the particles. Furthermore, the immobilization step generates extra catalyst
manufacturing cost. The introduction of EMR made it possible to retain the enzyme in the
reactor, which enables enzyme lifetime of several batches and continuous process operation
104. The filtration process also facilitates the recovery of the final hydrolysates without need
of further steps to remove undesired components. Filtration is the separation of two or more
components from a fluid stream. The filtration membrane works as a selective barrier,
allowing the flow of certain molecular and ionic components and retaining other components
present in a liquid or a vapor mixture. In membrane separation, particles are separated on the
basis of their molecular size and shape with the use of pressure and specially designed
semipermeable membranes 105
. Membrane filtration process is the most feasible downstream
strategy for industrial manufacture of enzymatically-modified proteins. Membrane
technology has a number of advantages as compared to chromatographic purification
techniques. These advantages include low energy requirements, hence sustainable
processing, and easy modification of the critical operational variables such as pressure,
temperatures, feed flow rate, agitation etc., and relatively easy scale up. In addition, product
inhibition of the enzyme catalyzed reactions can be diminished if the setup is integrated with
continuous or semi-continuous product removal 102
. Ultrafiltration (UF) membranes are
routinely employed to enrich protein hydrolysates 106
, in which, the applied pressure ranges
from about 3 to 7 bars. The separation principle is based on the diameters of molecules and
partially on their charge and affinity for the membrane 107
. UF membranes are capable of
retaining species in the range of 300-500,000 Da of molecular weight, with pore size ranging
from 0.001 to 0.1 μm 108
. An obstacle towards wider acceptance of membrane technology are
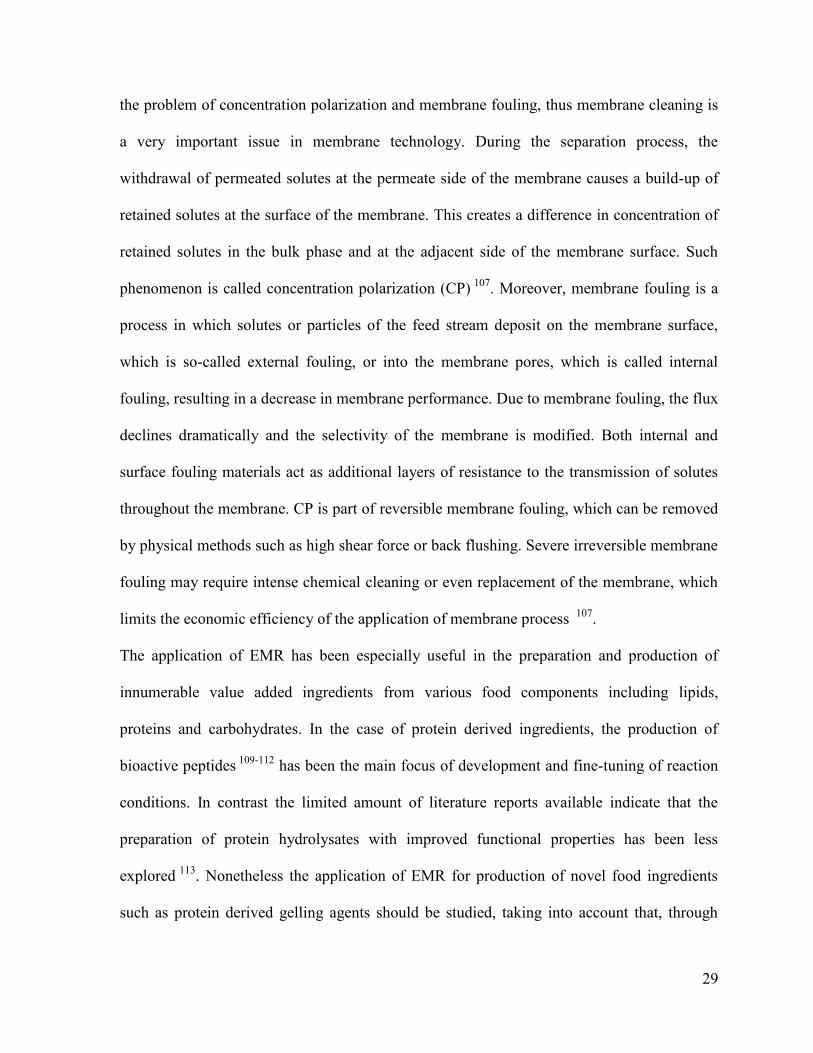
29
the problem of concentration polarization and membrane fouling, thus membrane cleaning is
a very important issue in membrane technology. During the separation process, the
withdrawal of permeated solutes at the permeate side of the membrane causes a build-up of
retained solutes at the surface of the membrane. This creates a difference in concentration of
retained solutes in the bulk phase and at the adjacent side of the membrane surface. Such
phenomenon is called concentration polarization (CP) 107
. Moreover, membrane fouling is a
process in which solutes or particles of the feed stream deposit on the membrane surface,
which is so-called external fouling, or into the membrane pores, which is called internal
fouling, resulting in a decrease in membrane performance. Due to membrane fouling, the flux
declines dramatically and the selectivity of the membrane is modified. Both internal and
surface fouling materials act as additional layers of resistance to the transmission of solutes
throughout the membrane. CP is part of reversible membrane fouling, which can be removed
by physical methods such as high shear force or back flushing. Severe irreversible membrane
fouling may require intense chemical cleaning or even replacement of the membrane, which
limits the economic efficiency of the application of membrane process 107
.
The application of EMR has been especially useful in the preparation and production of
innumerable value added ingredients from various food components including lipids,
proteins and carbohydrates. In the case of protein derived ingredients, the production of
bioactive peptides 109-112
has been the main focus of development and fine-tuning of reaction
conditions. In contrast the limited amount of literature reports available indicate that the
preparation of protein hydrolysates with improved functional properties has been less
explored 113
. Nonetheless the application of EMR for production of novel food ingredients
such as protein derived gelling agents should be studied, taking into account that, through

30
this technology with the usage of the appropriate membrane and by reaching the appropriate
DH, is possible to control the molecular weight distribution of the hydrolysates and that the
molecular weight of the hydrolysates has strong influence on the functional properties of the
hydrolysates 94
.
In view of the many valuable food ingredients produced by membrane technologies, some of
the strategies implemented for the concentration, purification or separation of these values
added ingredient could be adopted in the preparation of protein hydrolysates with techno-
functional applications, such as the implementation of integrated membrane processes that
include sequential filtration process 114
or electro-membrane filtration 115
.
1.8. Protein-polysaccharide interactions
Mixtures of proteins and polysaccharides are often used in various products with the purpose
of improving or obtaining different properties in the food. These mixtures of protein and
polysaccharide are done in the expectation that the polysaccharide can modify the functional
properties of the protein through the different interactions established between the two
components 35
. The use of protein–polysaccharide mixtures to change food properties with
especial emphasis in gelation have been widely studied 48-51
.
Polysaccharides are polymers of one or more sugars that are the building blocks. The most
common building blocks of naturally occurring polysaccharides are glucose, fructose and
galactose 116
. Thus the type of sugar and the nature of the linkages determine the structure
and function of the polymer 117
. Polysaccharides are grossly divided into two groups, starch
and non-starch polysaccharides (NSPS). The NSPS group includes polysaccharides of the
plant cell wall such as cellulose, hemicellulose and pectin as well as plant gums, mucilages

31
and hydrocolloids 116
. The length of the polymer chain, the degree of branching, the
molecular weight and volume and also the fact that many polysaccharides have other
chemical groups which conferee an electric charge to the molecule are relevant features that
may impact the way the polysaccharide interact with proteins 118
.
1.8.1. Associative and segregative interactions
Basically protein-polysaccharide interactions can be classified as segregative or associative.
These types of interactions arise from the fact that proteins and polysaccharides are unlike
polymers. When interactions between protein-polysaccharide are less favorable than protein-
protein and polysaccharide-polysaccharide, there will be a tendency of the system to
segregate into regions where one of the components is surrounded by others of the same type,
whereas favorable protein-polysaccharide interactions will promote association between the
two polymers 119
. These two types of inter-polymer interactions are responsible for the
immiscibility and the complexing of biopolymers 120
, and depend on the thermodynamic
characteristics of the individual polymers 121
. In the case of segregative interactions, protein
and polysaccharide repel each other and are denoted as incompatible. In contrast, in the case
of associative interactions, protein and polysaccharide attract each other 122
. A system
containing two separate phases can be form by mixing protein and polysaccharides with the
same electric charge. In this case, both protein and polysaccharide separate due to
electrostatic repulsion which makes the system unstable and parts into two phases, one rich
in protein and the other rich in polysaccharide 123
(Figure 1 a). A system can separate into
two phases not only due to electrostatic repulsion but also due to high steric exclusion. At a
sufficiently low concentration, the protein and polysaccharide are well mixed and form a

32
one-phase solution, but once the concentration exceeds a certain level, phase separation
occurs and a two-phase solution is formed 38
.
Once two non-interacting polymers are mixed together a single phase is formed, where the
two polymers are evenly distributed throughout the medium (Figure 1 b). In this case the
polymers are considered “co-soluble”. Miscibility or co-solubility commonly occurs at low
biopolymer concentrations 123
.
Formation of protein-polysaccharide complexes may occur between a positively charged
protein and a negatively charge polysaccharide. In this case the pH of the solution should be
below the isoelectric point of the protein. The same could occur at a pH above the isoelectric
point, in this case the negatively charged protein can interact with a positively charged
polysaccharide. The chance to form a complex is reduced as the pH gets close to the
isoelectric point of the protein, since at this pH the net charge of the protein is zero and no
electrostatic attractive interactions can be established between the protein and the
polysaccharide 35,124
. In solution, complex formation could result into the formation of a
soluble or insoluble complex (Figure 1 c and d, respectively). In the case of a soluble
complex only one phase where the complexes are uniformly distributed is observed.
Insoluble complex formation leads to the formation of two distinct phases, where one phase
is rich in both protein and polysaccharide and the other phase is depleted in both 123
.
Insoluble complex formation also known as associative phase separation 125
is attributed to
charge neutralization 35
. Even though the pH and ionic strength of the solution are important
parameters to control the type of interactions formed between protein and polysaccharide,
other characteristic such as the type of protein and polysaccharide, molecular weight, charge
density and hydrophobicity are also relevant to the extent of complexation 126
. While

33
electrostatic attraction is the main driving force in the complexation process, other
interactions such as hydrogen bonds, hydrophobic interaction may provide a minor
contribution to the stability of the protein-polysaccharide system 38
. Complex formation can
also take place between similarly charged protein and polysaccharide, since the protein might
have patches on the protein surface that carry the opposite charge to that of the
polysaccharide and associative interactions are developed 127
.
The mixing process is a spontaneous process when change in the Gibbs free energy (G =
H –T x S) is negative. In contrast thermodynamic incompatibility of polymers takes place
when the Gibbs free energy of mixing is positive. Since the mixing entropy is a function of
the number of individual particles being mixed, the value of the entropy of mixing (S) of
polymers is much smaller than that corresponding to monomers. A homogenous mixture of
unlike polymers could be prepared if the enthalpy of mixing (H) is negative. This means
that the attractive forces between unlike macromolecules are equal to or larger than those
between like macromolecules. Indicating that polymers are compatible and able to form
soluble inter-polymer complexes 120
. The phenomenon of incompatibility relates to the
occupation of the solution volume by the macromolecules and the repulsion by unlike
molecules. The differences in excluded volume effects between incompatible polymers and
their competition for space determines the critical conditions of a system phase separation
120. Segregation or phase separation leads to a reduction of the polymer concentration near
the other particle. This reduction of the polymer concentration is due to loss of
conformational entropy of polymers near an interphase. A reduction of polymer
concentration near the interphase is called depletion 122
, and is observed when the solvent-
34
polymer interactions are favored to the detriment of protein-polysaccharide and solvent-
solvent interactions 125
.
Figure 1 Behavior of protein-polysaccharide mixtures due to associative or segregative
interactions. a) Incompatible and two phase system, b) Compatible and one phase
system, c) Soluble complexes and one phase system and d) Insoluble complexes and two
phase system.

35
Phase separation is very common and it occurs naturally in any mixture of polymers in which
inter-polymer interactions are not favorable, thus, polymer molecules tend to be surrounded
by others of the same type, which is known as thermodynamic incompatibility 119
.
Thermodynamic incompatibility is encouraged by high molecular weights, by low tendency
for the protein and polysaccharide to interact attractively and by the size of the difference
between their individual interactions with the solvent 128
.
Knowing the possible ways in which protein and polysaccharides are expected to interact in
solution, during gelation the associative or segregative interactions established between
protein and polysaccharide will take place at the same time as the gel network is formed.
Thus protein-polysaccharide gels can be classified into three types; interpenetrating, coupled
and phase separated 129
. A similar classification but with less common nomenclature for this
types of gels was proposed by Zasypkin et al. (1997) and this classification includes mixed,
complex and filled gels 130
. Each type of gel structure has very distinct microstructure and
therefore very distinct gelling properties that may be applied for diverse applications.
1.8.1.1. Interpenetrating network
Interpenetrating networks or mixed gels are formed when two components gel separately and
form independent networks. Both networks are continuous throughout the sample, and
interactions between them are minimal or “topological” 30,129
. In this type of gel the two
networks are seen passing through one another at the individual strand, or pore level and the
structure is essentially uniform 128
.
1.8.1.2. Coupled network
Couple or complex networks are formed in the presence of favorable or associative
interactions between proteins and polysaccharides. Thus, intermolecular binding between the

36
two polymers contributes to the formation of this type of network 30
. The association of
polysaccharides and proteins is mostly due to electrostatic attraction between a negatively
charged polysaccharide and a protein below its isoelectric point for example, and the strength
of the attraction depends on the type and density of the charges present on the molecules
119,131. Thus, attractive electrostatic interactions are the main interaction responsible for the
stability of the gel network 132
; nonetheless other weak energy interactions, especially
hydrogen bonding but also hydrophobic interactions can have a significant contribution 127
.
In this type of gel both protein and polysaccharide are expected to be closely bonded since
they are linking at a molecular level to form the gel network 128
.
1.8.1.3. Phase separated network
Phase separated gels are formed due to segregative interactions. In this case is expected that
protein and polysaccharide repel each other and/or that both proteins and polysaccharide
show a different affinity for the solvent 121
. Phase separated network gels or filled gels, are
the most common type of multicomponent gels. The microstructure formed in these gels is
the result of the competition between the phase separation process and the gel formation
process. Gel formation arrests the phase separation process before it reaches equilibrium by
forming a two-layer system 118
. In the case of partial phase separation the gel will appear
with inclusions or particles of one phase filling the matrix of the second phase 30
. In a phase-
separated gel, usually the faster gelling constituent forms the continuous phase that supports
the discontinuous inclusions of the second and slower gelling component 133
. When a
protein-polysaccharide mixture is heated, both processes (aggregation and phase separation)
occur simultaneously, with very different kinetics 134
. Phase separation in solution can be
detected by the formation of ‘water in water emulsion’ in which one phase exists as a

37
continuous matrix with the other dispersed through it as small liquid droplets, this emulsion
structure can be trapped by network formation, giving a biphasic co-gel with one phase
continuous and the other dispersed 119
. The minimum concentration for gelation usually
decreases when another incompatible biopolymer is added. This is due to an excluded
volume effect. In a phase-separated system, the same effect may be due to water
redistribution between phases during gelation 130
. Often phase-separated gels seem to be
homogenous at the macroscopic level, nonetheless at the microscopic level these gels show
heterogeneity 125
. Phase separation is expected to begin either by spinodal composition or by
nucleation and growth and either to progress to two phases in equilibrium or being trapped at
some stage by gelling 128
.
The utilization of protein and polysaccharide mixtures allows modification of the functional
properties of proteins. Similarly enzymatic hydrolysis permits protein modification. Both of
these techniques may be advantageous as these may show higher consumer acceptability
compared to chemical modification techniques.
1.9. Research hypothesis and objectives
The global protein market is growing and is projected to reach $24.5 billion by 2015 with a
focus on plant-based proteins. Rising cost, sustainability concerns and the growing consumer
desire to eat clean as well as the beneficial health effects are the reasons behind the market
requirements of plant proteins 135
. Soy protein is the most widely consumed plant protein and
it leads the non-animal protein market 136
. Soy protein has proven to be a good source of
protein and has been widely utilized in the food industry due to its many good functional
properties. Of particular interest is the use of soy in tofu and as a gelling agent in the food
38
industry 137
. Soy protein is currently incorporated in comminuted meats and dairy foods
where thickening and gelling properties are of major significance 138
. Despite the fact that soy
protein is so widely demanded, there are hurdles for its commercialization mainly in the
European Union market but also in the rest of the world due to its genetically modified
character and the pending regulatory approval. Gluten is another plant protein with increased
use as a food ingredient to provide a range of functional properties at a more modest price
than competitors such as milk and soy proteins 139
. Nonetheless, other sources of plant
protein need to be considered as the plant protein sector is thriving and growing.
Oat is a good source of plant protein and recently the human food market for oat has grown
mainly due to the growing public awareness of the health benefits of β-glucan. This soluble
dietary fiber component of oat is known to reduce blood cholesterol 140
, and regulate blood
glucose levels 141
. Several techniques have been developed to isolate β-glucan from oat
grain as a healthy ingredient in food products. The remaining components such as protein
and starch are awaiting research to develop their full value 142
. Hence, the utilization of oat
protein as a natural by-product of the β-glucan extraction process increases the economic
benefit of its utilization.
Oat has the highest protein level (12–20%) 143
among cereals with a superior amino acid
profile due to higher amounts of limiting amino acids lysine and threonine 16
. Globular
proteins in oat closely resemble proteins in soy. There are strong similarities between the 12S
fraction of oat and the 11S fraction of soy (glycinin), which has demonstrated good gelling
properties; consequently oat protein has potential to act as a gelling agent. The recognition
and development of such significant functionality from oat protein can considerably
stimulate its utilization in the food market. Ma et al. have notably contributed to this area of
39
research 144,145
. However, such efforts are still limited compared to those on dairy and soy
proteins. Two previous publications demonstrated that oat protein could form strong gels
under alkaline conditions (pH 9-10), but at acidic and neutral pH, very weak gels with poor
water holding capacity were obtained 144,145
.
Enzymatic hydrolysis is a preferable tool to alter functional properties of proteins because of
milder processing conditions required, easier control of reaction and minimal formation of
by-products 146
. The final composition and thus the use of the hydrolysates will depend on the
protein source, the type of enzyme used and the hydrolysis conditions 96
. Recent research has
reported the effect of enzymatic hydrolysis on the gelling properties of proteins including soy
protein 98
, rice bran protein 99
, sunflower protein 100
, and canola protein 97
. Results from these
studies indicate that improvement of the gelling capacity is highly enzyme specific. To date,
knowledge of the effects of enzymatic hydrolysis on the gelling capacity of oat protein is
very limited. The application of EMR for production of novel food ingredients such as
protein derived gelling agents should be consider as viable alternative as the molecular
weight of the hydrolysates can be carefully controlled through this technology. Also the
molecular weight has a considerable effect on the gelling properties of the hydrolysates.
On the other hand, the gelling properties can be affected by interaction with polysaccharides.
Protein and polysaccharide are often mixed to develop food products with novel textural
properties. The interactions develop among protein and polysaccharide will define the
microstructure of food products and thus the resulting texture or mechanical properties. In
spite of good potential, research effort to develop oat protein-polysaccharide gel is lacking.
In the light of this, this research tested the following hypotheses:
40
I. Gelling properties of oat protein can be improved by partial hydrolysis.
II. Gelling properties of oat protein can be improved by regulating protein-
polysaccharide interactions to achieve a synergistic effect.
The overall objective of this research was to improve the gelling properties of oat protein by
enzymatic modification and by formation of protein-polysaccharide blends with the
following specific objectives:
I. To review literature reports on the application of enzymatic membrane reactors to
produce added-value ingredients from food components.
II. To study the impact of partial hydrolysis on oat protein thermal gelling properties
under different processing conditions.
III. To investigate the effect of oat protein and polysaccharide interactions on oat protein
thermal gelling properties under different environmental conditions.
IV. To understand the oat gel formation mechanism.
The properties of oat protein gels under different environmental conditions with emphasis on
the gel mechanical strengths and water-holding capacity will be investigated, as these
properties are the most important gel characteristics for food applications. If the defined gel
physical properties would be in the range of similar properties of animal protein derived gels,
41
value-added opportunities would exist for oat protein to be used as a new gelling ingredient
in food formulations such as meat binder and fat replacer to create food with improved
quality and nutritive value, or used in meat analogues for vegetarian foods. In this way
additional revenue return could be generated to oat producers and processors to enhance their
sustainability.
42
Chapter 2
2. Continuous Membrane Bioreactor (CMBR) to Produce
Nanoparticles from Milk Components
2.1. Introduction
Membrane technology has been used in the dairy industry as alternative to some unit
operations since the early 1970s. The new applications of membranes were often due to the
development of membrane science. The commercial availability of Nanofiltration
membranes allowed the demonstration of some biological activities in milk and whey peptide
sequences 147
. Nanotechnology is used in different stages of the membrane development and
has gain great interest among the agro-food sector and it involves the manufacture,
processing and applications of structure devices and systems controlling the shape and size of
particles at the nanometer scale 148
. The size range that holds so much interest is typically
from 100 nm down to the atomic level; approximately 0.2 nm, because in this range material
can have different and enhanced properties compared with the same material at a large size.
As the particle size decreases, a greater proportion of atoms are found at the surface
compared to inside. For example, a particle size of 30 nm has a 5% of its atoms on the
surface, at 10 nm 20%, and at 3 nm 50% of the atoms are in surface. Thus a nanoparticle
(NP) has a much greater surface area per unit mass compared with larger particles, leading to
grater reactivity. In addition to the surface area effect, quantum effect can also govern the
properties of matter as size is reduced to the nanoscale, affecting the optical, electrical and
magnetic behavior of materials 149
.

43
The application of nanotechnology in the food industry covers many aspects, such as food
safety, packaging material, disease treatment, delivery systems, bioavailability, and new tools
for molecular and cellular biology and new material for pathogen detection. However the
four major areas in food industry to benefit from nanotechnology are the development of new
functional materials, micro and nanoscale processing, new product development and the
design of nanotracers and nanosensors for food safety and biosecurity 150
.
It is the interest of this chapter to discuss the production of bioactive NPs from food
commodities and to explain how nanotechnology in a continuous membrane bioreactor
(CMBR) and in particular nanofiltration processes can be employed to alter food products.
For this purpose, the term “bioactive food component” refers to nonessential biomolecules
that are present in foods and exhibit the capacity to modulate one or more metabolic
processes, which results in the promotion of better health 151
.
A major strategy for the delivery of these components into food is through encapsulation,
which consists in coating one or several components (core) within a secondary material
(encapsulant). This is used to mask the color and taste of nutrients, and to protect sensitive
nutrients during processing, storage, and transportation 152
. Bioactive compounds are added
into food, looking to provide health benefits and protection as antioxidants and anti-aging
agents, reducing the risk of cardiovascular diseases or with the intention to boost the
nutritional content of the product. The application of nanotechnology in the food industry is
still in a developing stage, however in recent years; research has been carried out in order to
formulate food-grade encapsulants to enable the delivery of desirable bioactive compounds
through the food supply. Due to their sub-cellular size, NPs offer promising means of
improving the bioavailability of bioactive compounds, especially poorly soluble substances

44
such as functional lipids (e.g. carotenoids, phytosterols, ω-3 fatty acids), natural antioxidants,
and other compounds that are widely used as active ingredients in various food products. NPs
can dramatically prolong compound residence time in the gastrointestinal tract by decreasing
the influence of intestinal clearance mechanisms and increasing the surface available to
interact with the biological support. They can also penetrate deeply into tissues through fine
capillaries, cross the epithelial lining fenestration and are generally taken up efficiently by
cells, thus allowing efficient delivery of active compounds to target sites in the body 153
.
2.2. Nanomaterials
NP can be produced from a variety of different materials, from metals like gold and silver,
organic solvents or some food derived ingredients. The use of food-grade ingredients is
generally accepted by the regulatory agencies and has shown to exert good results as
nanomaterials and would contribute to dissipate the fear among consumers given the fact that
these polymers are part of the human diet. Food-grade proteins and polysaccharides, such as
whey protein, casein, gelatin, soy protein, zein, starch, cellulose, and various other
hydrocolloids are used. In addition, they may contain other components, such as water,
lipids, minerals and sugars 154
.
2.2.1. Lipid-based nanoparticles
Lipid-based nanoparticles can encapsulate compounds with different solubilities, but in
particular these particles are useful carriers of poorly water-soluble compounds. The term
“lipid” is used in a broad sense to include phospholipids, triacylglycerides, fatty acids,
steroids and waxes 155
.

45
Different structures have been proposed using lipids as the main encapsulant constituent,
some of the most commonly discussed structures are: liposomes and solid lipid nanoparticles
(SLN).
Liposomes are spherical, self-closed structures formed by one or more concentric lipid
bilayers with an encapsulated aqueous phase in the center and between the bi-layers 156
.
They can accommodate hydrophilic, lipophilic and amphiphilic compounds in their aqueous
and or lipid compartment. These structures are used as carrier systems for the protection of
bioactive compounds by improving their solubility and bioavailability and preventing their
unwanted interaction with other molecules 157
. The preparation of SLN is carried out at high
temperatures, generally above the melting point of the lipid component used and further a
cooling stage is required to solidify the lipid 158
. Some disadvantages of SLN are the limited
loading capacity of the bioactive compound and expulsion of the bioactive compound during
storage. In order to overcome these drawbacks Nanostructured Lipid Carriers (NLC) were
developed 159
. NLC are composed of oily droplets embedded in a solid lipid matrix, this
provides more stability with a controlled nanostructure that improves the bioactive
compound loading and firmly incorporates the bioactive compound during storage 160
. Lipid-
based nanoparticles, have been used to contain different bioactive compounds such as
vitamins (α-tocopherol) 161
, β-carotene 162
, and -3-fatty acids 163
.
2.2.2. Protein-based nanoparticles
Proteins have very good gelling and emulsifying properties and for this reason they are
widely used as encapsulating material. Thanks to the consistent primary structure of proteins
a wide variety of nutrients can be incorporated allowing them to form complexes with
polysaccharides, lipids or other biopolymers. In order to improve bioavailability, the food

46
industry is currently attempting to increase the circulation time of conventional nanocarriers
in the gastrointestinal tract, by surface coating with protein 153
. Food proteins can undergo
denaturation due to exposure to high temperatures or pressure. The resulting denaturated
product can then re-assemble, building a new structure 164
. Or well if proteins are combined
with polysaccharides, these materials can form biopolymeric nanostructured particles by
complexation 165
. When a globular protein becomes denaturated, its physical and chemical
interaction change appreciably through exposure of nonpolar and sulphur-containing groups
that were originally present within the compact interior of the globular protein.
Consequently, denaturated proteins have a greater tendency to aggregate irreversibly, with
each other through hydrophobic bonding and disulfide bond formation 154
. Nanoemulsions
are dispersions of nanoscale droplets produced after mixing two immiscible phases, made by
the application of high shear. The rupture of droplets may be achieved by ultra-sonication or
microfluidisation. The amount of surfactant required to stabilize nanoemulsion is greater 166
.
To prevent the droplet from recombining into larger droplets a thin encapsulating layer is
introduced to help stabilize the system; this layer is traditionally made up of proteins or
phospholipids which act as surfactants 167
.
A particular case of protein based NP are nanotubes, derived from partially hydrolyzed α-
lactoalbumin. This nanostructure is very stable and strong and has a 8.7 nm cavity that can be
used to contain bioactive compounds 168
. Milk proteins such as casein, α-lactoalbumin and β-
lactoglobulin, lactoferrin, bovine serum albumin, have been widely used in the development
of nanostructures with very different applications. However their physicochemical properties
facilitate their functionality as vehicle of bioactive compounds 169
. Nevertheless, the use of

47
protein in the building of nanostructures is not limited to milk proteins, vegetable proteins
have been used as it is the case of pea protein 170
and zein 171
.
2.2.3. Polysaccharide-based nanoparticles
Polysaccharides are used to improve texture in foods or as stabilizer agents in emulsions, and
some of the most commonly used are: starch, xanthan gum, pectin, alginate and chitosan. In
combination with proteins and lipids, nanostructured particles can be formed. According to
their structural characteristics, these polysaccharide-based nanoparticles are prepared mainly
by four mechanisms: covalent crosslinking, ionic crosslinking, polyelectrolyte complexation,
and self-assembly of hydrophobically modified polysaccharides, Liu et al. (2008) 172
reviewed these four mechanisms in detail. Of these methods polyelectrolyte complexation is
commonly used in the preparation of nanoparticles containing food derived bioactive
compounds. When proteins and polysaccharides carry an opposite charge, complex formation
is driven by attractive electrostatic interactions between the two biopolymers 173. Attractive
interactions and complexation begin at values slightly above the protein’s isoelectric point;
further pH reduction induces greater complexation 174
. It is important to establish the
electrical characteristics of the polysaccharide molecules used, since electrostatic interactions
may be used to assemble specific biopolymer structures. The electrical charge on
polysaccharide depends on the nature of the ionic groups along the backbone chain, as well
as solution conditions. Some polysaccharides are neutral (starch, cellulose) some anionic
(alginate, carrageenan, xanthan, gum Arabic) and some cationic (chitosan) 175
. Sugar beet
pectin was used to produce a nanostructured system for stabilization, protection and delivery
of hydrophobic bioactive compounds. For this, vitamin D was bounded to β-lactoglobulin,

48
later a complex between the carrier and the polysaccharide of the opposite charge was
formed. This system has been proposed for enrichment of clear and non-fat beverage 165
.
2.3. Nanotechnology and nanofiltration
The application of membrane technology in the nanoscale range has increased as a result of
the continuous application of nanotechnology in the food sector. In the same way that
nanoparticles are produced as an encapsulated system based on food ingredients and
designed to have a broad range of applications, nanofiltration can be utilized as a nanoscale
process to produce food ingredients with added value. In the membrane based separation
process, the driving force for material transport through selective membranes is a pressure
difference, thus these processes are called pressure-driven membrane process, and such is the
case of microfiltration (MF) and ultrafiltration (UF). In the case of nanofiltration (NF) a
pressure difference is not the only driving force; selective removal of ions based on charge is
another feature of this technology 176
. Thus the selective separation process results in
nanometer scale products. Nanofiltration membranes have apparent pore diameter between
0.5 and 5 nm and are capable of removing from water, both organic matter and ions of
mineral salts 177
. In such way nanofiltration can separate components according to their
molecular size without a change phase of the solvent; this avoids thermal damage and
requires a lower consumption of energy 178
. Nanofiltration is currently used to supply high
quality drinking water 177
, desalting milk, whey and other dairy fluids 147
, additionally a
wide range of value added components can be obtained after a nanofiltration treatment.

49
2.4. Membrane bioreactors in the nanoscale process
Biocatalytic membrane reactors combine selective mass transport with chemical reactions,
and the selective removal of products from the reaction site increases the conversion of
product-inhibited or thermodynamically unfavorable reactions. Membrane reactors using
biological catalysts can be used in production, processing and treatment operations 179
.
In a bioreactor, the conversion of raw materials into value added products is carried out by
enzymatic hydrolysis; further, in combination with a NF membrane the separation of
substrate and product will occur; as the membrane will only allow the passage of certain
components known as “permeate” (the product) and retains/rejects other components known
as “retentate” 176
.
The use of biocatalysts for large-scale production is an important application because it
enables biotransformations to be integrated into productive reaction cycles. Biocatalysts (e.g.
enzymes, microorganisms and antibodies) can be used: (1) suspended in solution and
compartmentalized by a membrane in a reaction vessel or (2) immobilized within the
membrane matrix itself. In the first method, the system might consist of a traditional stirred
tank reactor combined with a NF membrane-separation unit. In the second method, the NF
membrane acts as a support for the catalyst and as a separation unit 179
.
Some of the advantages of the use of membrane bioreactor as a nanoscale process are that the
catalytic/separation process 103,179
:
Does not require additives
Is able to function at moderate temperature and pressure
Reduces the formation of by-products

50
Catalytic enzymes are extremely efficient and selective compared with chemical
catalysts.
The enzyme is retained and reused
Substrate/product inhibition is reduced
The end product is free of enzyme
One single step operation (reaction/separation).
However, the use of NF membranes is not limited to the enzymatic membrane reactors. NF
has been commonly used as a pre-concentration step in the milk processing operations in
order to reduce the energy consumption in heat based treatments. The whey that is obtained
during cheese making with a very high mineral content, could be used for the manufacture of
other valuable food ingredients such as whey protein concentrate and whey protein isolate,
however the mineral content should be reduce to provide a higher quality. With NF the
demineralization of whey can be achieve, since NF membranes are often used for separation
of charged solutes 180
.
Thus, membrane technology at this scale can be used for 181
:
Separation of high molecular weight component from low molecular weight
components.
Concentration of mixture or selected fractions
Purification

51
Table 1 presents an overview of the NF processes that have been proposed in the food sector.
NF has been used for concentration or purification of compounds with biological activity
such as antioxidants, prebiotics and bioactive peptides. Alternatively NF has also been
proposed for separation of valuable components such as lactose or undesirable components
such as salts, biogenic amines, toxins or heavy metals.
2.4.1. Recovery of compounds with antioxidant activity
Concentration of bioactive compounds can be achieved by NF treatment, because this
process does not require high temperatures in comparison to other concentration treatments
such as evaporation. Thus, by using mild temperatures the functional properties of these
temperature sensitive compounds are preserved 182
.
Due to their beneficial effects on human health, isoflavones were concentrated from soybean
using a NF membrane. However, in order to ensure a good yield and to avoid the fouling of
the membrane due to the accumulation of fat globules in the membrane, defatted soy flour
was used as raw material and the final results of this study showed that the nanofiltration
process for the concentration of isoflavones is viable 182
.
In order to separate low molecular weight and/or hydrophobic components, the nanofiltration
membrane needs to meet certain characteristics that will be defined by the compound that is
being recovered. Darnoko and Cheryan (2006) 178
selected a hydrophobic membrane to
separate β-carotene from the palm methyl esters, increasing the concentration in from 0.45
g/L to 1.88 g/L (34).
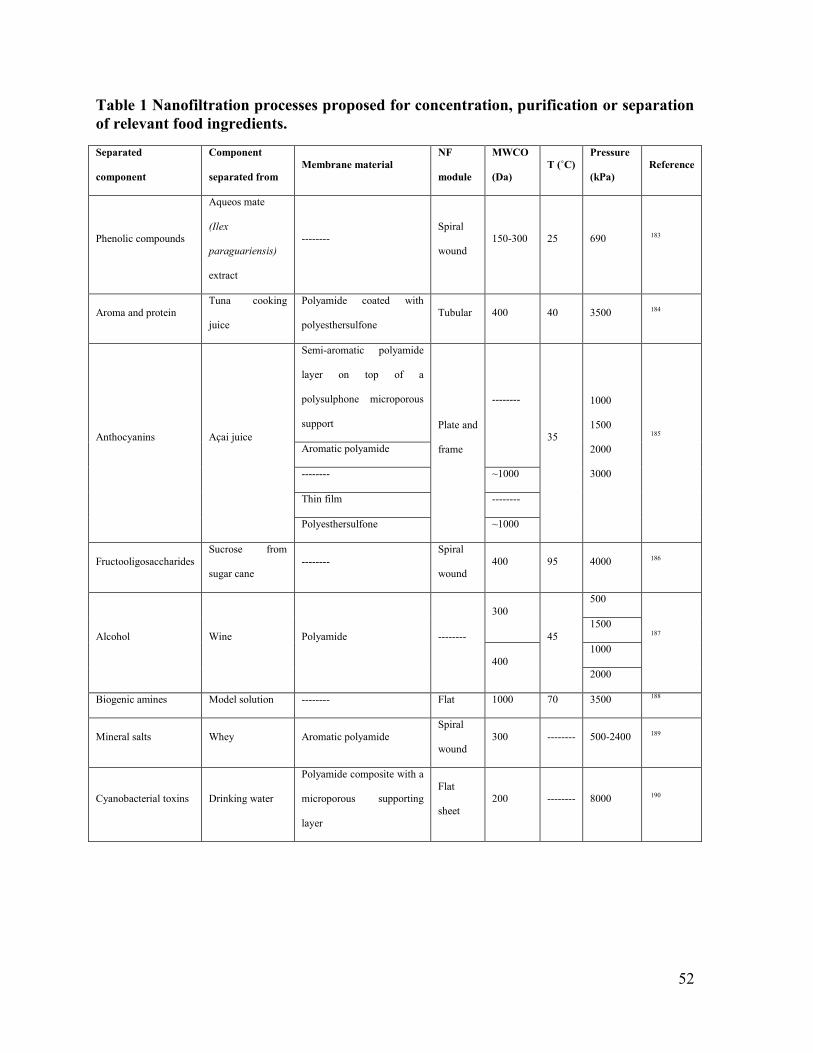
52
Table 1 Nanofiltration processes proposed for concentration, purification or separation
of relevant food ingredients.
Separated
component
Component
separated from
Membrane material
NF
module
MWCO
(Da)
T (˚C)
Pressure
(kPa)
Reference
Phenolic compounds
Aqueos mate
(Ilex
paraguariensis)
extract
-------- Spiral
wound
150-300 25 690 183
Aroma and protein Tuna cooking
juice
Polyamide coated with
polyesthersulfone
Tubular 400 40 3500 184
Anthocyanins Açai juice
Semi-aromatic polyamide
layer on top of a
polysulphone microporous
support Plate and
frame
--------
35
1000
1500
2000
3000
185 Aromatic polyamide
-------- ~1000
Thin film --------
Polyesthersulfone ~1000
Fructooligosaccharides
Sucrose from
sugar cane
--------
Spiral
wound
400 95 4000 186
Alcohol Wine Polyamide --------
300
45
500
187
1500
400
1000
2000
Biogenic amines Model solution -------- Flat 1000 70 3500 188
Mineral salts Whey Aromatic polyamide
Spiral
wound
300 -------- 500-2400 189
Cyanobacterial toxins Drinking water
Polyamide composite with a
microporous supporting
layer
Flat
sheet
200 -------- 8000 190
53
Flavonoids and polyphenolic compounds from Sideritis scardica were concentrated up to 3-4
times. The concentrated extracts preserve their high antioxidant activity and could be used as
a source of concentrated biologically active material. Also the separation of flavonoids form
low molecular polyphenols was possible in base of their molecular weight difference 191
.
Conidi, et al. (2011) 114
proposed an integrated membrane process based on the preliminary
UF of enzymatically depectinised juice with a 100 kDa membrane to remove suspended
solids followed by a NF step with a 450 Da membrane. The separation and concentration of
polyphenols of the bergamot juice was possible as the retentate contained the phenolic
compounds, which showed a high total antioxidant activity.
Crude rice bran is a by-product of rice milling, rich in phytochemicals with high nutritional
value such as γ-oryzanol. A two-step nanofiltration system was set up for enrichment of this
phytochemical in rice oil. The first membrane stage, produced the separation of glycerides
and γ-oryzanol, promoting the oil enrichment in this phytochemical. In the second membrane
stage the oil was refined to acceptable consumption levels of free fatty acids and its γ-
oryzanol content was further enhanced. The antioxidant activity of the resulting product oil
possessed a significantly higher antioxidant capacity than the feed oil (45.9, 19.3 μmol
Trolox/g respectively). This results show that the product generated through NF membrane
process has a superior nutritional value 192
.
2.4.2. Oligosaccharides
Non-digestible oligosaccharides (OS) are able to stimulate the growth of bacterial flora,
hence they are used as prebiotics 193
. The resulting commercial OS products contain plenty of
side resultants of low molecular weight sugars such as glucose, fructose, sucrose, galactose

54
and lactose, lowering the performance of the end product. Therefore, high purity of OS
products is required 194
. Thus NF seems to be a viable alternative for industrial scale
purification of OS mixtures. Many recent reports of the application of membrane technology
to produce and concentrate OS have been published using different sources such as whey
protein concentrate 195
, caprine milk 196
, rice husk 197
and soybean waste water 198
.
In a recent study, apple pomace samples were subjected to simultaneous saccharification and
fermentation resulting in a mixture of lactic acid and OS. Lactic acid was further removed by
ion exchange and the mixture was processed with two sequential steps using NF membranes
in order to refine and concentrate the following OS: glucooligosaccharides,
galactooligosaccharides, xylooligosaccharides and arabinooligosaccharides. More than 90%
of low molecular weight compounds (residual lactic acid, arabinose and NaCl) were removed
from the solution. On the other hand, just a limited part of the OS was lost in the permeate.
As a result of the treatments, the mass fraction of the OS in the final product increased from
0.360 up to 0.677 kg/kg of non-volatile compounds. These results confirm that coupling two
NF stages (discontinuous diafiltration followed by concentration) is a suitable alternative for
obtaining OS concentrates. The refined product obtained in this work showed degrees of
purity in the range reported for commercial OS and was assayed for its prebiotic potential
and the results showed the promotion of beneficial bacterial growth 199
.
Eucalyptus wood-derived xylooligosaccharides were obtained using UF and NF membranes
(1-50 kDa) for separation and concentration. The UF unit was used to separate OS from
higher molecular weight products or to fractionate OS of different degree of polymerization.
In addition a NF unit was used for concentrating liquors and/or for removing undesired low
55
molecular weight compounds, such as monomeric sugars or phenolic compounds, increasing
the xylooligosaccharide concentration 3.8 times 200
.
In other cases the separation process can be primarily intended to recover the low molecular
weight sugars, such is the case of lactulose, which is very useful in the treatment of chronic
constipation and is normally produced by isomerization of lactose using hydroxide/boric acid
forming a complex. This complex can be split by changing conditions from basic to acidic
and the borate is converted into NaCl and H3BO3. NF was used as an effective method for the
desalination of lactulose syrup, thus the disaccharides (lactulose and lactose) were retained
by the membrane in the presence of high concentrations of NaCl and H3BO3 in the syrup. In
this way NF provides a commercial alternative to chromatography for concentration and
purification 201
. NF has been used in the winemaking for sugar control; by reducing the sugar
concentration in must, before fermentation with the purpose to reduce the alcohol content in
wine. For this García-Martín et al. (2010) 202
proposed a two successive NF steps for sugar
removal. The musts obtained were mixed with untreated must or with the retentate of the first
NF stage, in order to reduce the alcoholic content by 2°. With this treatment other compound
such as polyphenols, anthocyanins, catechins and tannins were partially removed and slight
changes in color and aroma were observed.
A goats´ milk product enriched in oligosaccharides (>80%), lactose and free of salts was
obtained following the two-stage tangential filtration process proposed by Martinez-Ferez et
al. (2006) 196
. Tubular ceramic membranes with molecular mass cut-offs of 50
(ultrafiltration) and 1 kDa (nanofiltration), respectively, were employed and 15 new
oligosaccharide structures (4 neutral and 11 acidic), were identified. Goat´s milk is a suitable
source of oligosaccharides for applications in human nutrition due to their prebiotic and anti-
56
infective properties. Nanofiltration membranes can be used for purifying
galactooligosaccharides (GOS) products from the monosaccharide hydrolysis products such
as glucose and galactose. According to Gosling et al., (2010), 203
up to 88% of the di- and
oligosaccharides were recovered from a commercial GOS mixture using a nanofiltration
membrane with only 19% of the monosaccharides remaining in the retentate stream 204
Catarino et al., (2008) 194,205
investigated the fractionation of saccharide mixtures with
calcium using ultrafiltration and nanofiltration processes and reported that saccharide
fractionation was enhanced in the presence of calcium. Feng et al., (2009) 194
reported the
separation of sugar solutions in total recycle mode operations using nanofiltration
membranes and the process resulted in oligosaccharides yield of 70% and purity of 54%.
These results show nanofiltration as an alternative process to industrial chromatography.
2.4.3. Bioactive peptides
Controlled enzymatic hydrolysis of proteins, produces smaller peptide fractions, which can
exert a positive effect upon health. These fractions have been defined as bioactive peptides
206 and NF processes are particularly useful for separation of peptides due to the suitable
molecular weight cut-off and because of the electrochemical effects, which play an important
role in the case of charged molecules 207
. Fish protein hydrolysates were produced and then
submitted to a two-stage treatment (UF/NF) to obtain fractions with increased activity. In this
study 4 major fractions were obtained. Size chromatography was used to characterize the
peptide composition in each fraction. Within some fractions it was possible to find a wide
size distribution and not only the expected size 208
. Other similar reports using fish protein as
a substrate in a UF/NF fractionation system have been reported 209,210
. Milk proteins have
been widely studied as a source of bioactive peptides with a broad range of activities, for this

57
reason Ting et al. (2007) 211
proposed a NF treatment for the fractionation of peptides derived
from whey protein. In this work, peptides were selectively separated, based on their charge
and size. NF separation of peptides and amino acids is very dependent on physicochemical
parameters such as pH and ionic strength. At pH 9, acidic peptides carry a net negative
charge. Since both the peptides and the membrane are negatively charged at this pH, it is
likely that electrostatic repulsion between the membrane and the acidic peptides prevented
the peptides from permeating the membrane, meanwhile the basic peptides which were
positively charged at this pH were present in the permeate. Fractionation of a β-lactoglobulin
(β-LG) peptide mixture by nanofiltration (NF) membranes was investigated by Lapointe et
al., (2003) 212
. Peptide mixture was prepared by tryptic hydrolysis of commercial β-LG
followed by ultrafiltration (UF) for enzyme removal. In this paper, important change in NF
selectivity as affected by hydrodynamic conditions and recirculation time via possible
peptide–peptide interactions occurring in the so-called weakly attached layer were reported.
Roufik et al., (2007) 213
showed that the hypotensive peptide β-lactoglobulin (β-Lg) f142-
148, known as lactokinin, bind to bovine β-lactoglobulin variant A (β-Lg A) and this
complex could delay the hydrolysis of this peptide by digestive enzymes.
The separation of peptides contained in rapeseed protein hydrolysate using UF/NF
membranes was studied by Tessier et al. (2006) 115
. This process was also based on selective
separation depending on the peptide and membrane charge. As in the previous example
peptides with the same charge as the membrane (co-ions) were concentrated in the retentate
whereas peptides with the opposite charge (counter-ions) were able to get through the
membrane in the permeate. A pre-treatment step by acid precipitation to remove high molar
mass substances was followed by the UF step (3kDa), in which the concentration of small

58
peptides was allowed. Later the mixture of small peptides was desalted using a NF unit to
assess the influence of ionic strength on the fractionation selectivity. The results showed that
changes in pH and/or ionic strength modified the nature and the intensity of electrostatic
interactions between co-ions, counter-ions and membrane. Thus the control of pH and ionic
strength should be key parameter in the selective separation process using NF membranes.
Butylina et al., (2006) 214
described the fractionation and further isolation and
characterization of peptides and proteins present in sweet whey by means of ultrafiltration
using a regenerated cellulose membrane with a nominal molar mass cut-off value of 10
kg/mol and nanofiltration through sulphonated polyether sulphone membrane with a cut-off
of 1kg/mol. The concentration of whey proteins was done below the critical flux. The sieving
coefficients for the whey components (proteins, lactose and salts) were estimated. Whey
proteins were completely rejected by the ultrafiltration membrane. Nanofiltration of whey
permeates obtained after ultrafiltration was conducted at two pH values (9.5 and 3.0) that
corresponded to the different charged states of the membrane and of the peptides. The
transmission of peptides, amino acids and lactose was found to be mainly affected by the
permeability of the fouling layer. The selectivity of the nanofiltration membranes toward
peptides compared to lactose was calculated as 0.82 and 6.81 at pH 9.5 and 3.0, respectively.
2.4.4. Other applications
2.4.4.1. Fusel alcohols
Although fusel alcohols provide flavor in rice spirits, a high concentration of these
compounds, can lead to off-flavors, cloudy appearance and cause headaches and dizziness.
Based on this, NF was proposed to remove fusel alcohols from rice spirits. The best removal
results were observed with a 150-300 Da cut-off and an operating pressure of 488.95 kPa.
59
For these conditions the remaining fusel alcohols content decreased to 2.54 g/L. The alcohol
content, soluble solids content and pH (organic acids) varied slightly in the rice spirits
processed with NF, however the sensory evaluation results showed that the NF treatment,
improved the taste and clarity of rice spirits. Thus NF treatment effectively improved the
wine quality 215
.
2.4.4.2. Alternative sweeteners
A new alternative non-caloric sweetener can be produce from Stevia rebaudiana. The
production of this sweetener could involve the use of organic solvents and methanol and
ethanol. For this reason a membrane based process has been proposed to manufacture this
sweetener. It is possible to use a NF membrane process as a post-treatment or polishing stage
after applying a previous concentration treatment. This is the case of a recent study, in which
an integrated process with a microfiltration, ultrafiltration and nanofiltration membrane stage
was used for the purification of this sweetener 216
.
2.4.4.3. Soy sauce
Soy sauce with a reduced salt content was obtained after a NF treatment (150 Da) for
removal of NaCl and recovery of nutritional components such as amino acid and fragrance
from raw soy sauce. The process consisted in a dilution step followed by concentration and
then diafiltration. This mode of operation showed the least processing time and least water
consumption, along with a high salt removal and high nutrient retention. The permeate
produced in soy sauce desalination could be either reused as processing water or as feed to
produce light color soy sauce, all the materials including NaCl, amino acids and water could
be fully utilized. Consequently, this process was proposed as an alternative to produce soy
sauce with low sodium content 217
.

60
2.5. Conclusion
In consideration of the growing interest in promoting health through food, there is a
continuous development of food-grade delivery systems to encapsulate, protect and deliver
bioactive compounds (i.e. antioxidants, vitamins, bioactive peptides, antimicrobials). Thus,
there is now the possibility to produce food for a healthier population and improve its health
and wellness through nanoscale technology; because of this, the “nano-food” market is
expected to grow very positively within the next few years. Materials such as proteins,
polysaccharides and lipids have shown to exert good results as nanomaterials and would
contribute to create less fear among consumers given the fact that these polymers are part of
the human diet.
As part of the nanotechnology involved in the food processing, operations such as
nanofiltration represent a useful alternative for the separation, concentration, fractionation
and purification of food components with added value since many of them can exert a
beneficial effect upon health. Nanofiltration in combination with controlled hydrolysis also
provides an interesting alternative for production of bioactive compounds derived from food
ingredients with some advantages such as the use of mild temperatures, the reuse of the
enzymes, the final product free of enzyme or other compounds, making this operation
economically attractive and highly likely to be used at an industrial scale.
61
Chapter 3
3. Effect of partial hydrolysis on structure and gelling properties
of oat globular proteins
3.1. Introduction
Gelation is one of the most important functional properties of proteins as it provides texture
and support in foods. Generally, thermal gelation of globular proteins involves unfolding of
the protein molecules by heating, which leads to exposure of reactive amino acid residues.
Later, unfolded molecules re-arrange and aggregate irreversibly via disulfide bridges,
hydrogen bonds, hydrophobic and/or van der Waals interactions. Finally, aggregation carries
on with association of protein particles and if the protein concentration is sufficiently high, a
three-dimensional network is created 27
. This process only takes place in the presence of
adequate environmental conditions, such as pH, temperature and ionic strength 25
.
Plant proteins are normally considered inferior to animal proteins in terms of gelling
properties. Gelatin, egg white and whey proteins are widely used as gelling agents in the food
industry, particularly in meat and dairy based systems. In recent years, proteins derived from
plant sources are becoming one of the food industry's fastest-growing and most-innovative
ingredient segments owing to health (no Bovine Spongiforme Encephalopathy concern),
religious and cost reasons. For a long time, soy protein has been the major plant protein
gelling ingredient in the market. Yet there is an opportunity for other novel gelling
ingredients of plant origin to meet the increasing market requirement for different
functionalities and sensory attributes. Canada is the third largest producer of oat in the world,

62
with an annual production of approximately 2.7 million tons 218
. Canadian oat is commonly
used as an animal feed and only a small percentage of the grain is currently used for human
consumption. Recently the human food market for oat has been gaining momentum mainly
due to the growing public awareness of the health benefits of β-glucan. This soluble dietary
fiber component of oat is known to reduce blood cholesterol 140
, and regulate blood glucose
levels 141
. Several techniques have been developed to isolate β-glucan from oat grain as a
health ingredient in food products. The remaining components such as protein and starch are
awaiting research to develop their full value 142
.
Oat has the highest protein level (12–20%) 143
among cereals with a superior amino acid
profile due to higher amounts of limiting amino acids lysine and threonine 16
. This is related
to the fact that in most cereals the major storage proteins are alcohol-soluble prolamines
whereas in oat, globulins represent 70–80% of the total protein fraction 13
. The major fraction
in oat protein is the 12S globulin, which consists of two major subunits with molecular
weight of about 32 and 22 kDa called the A- and B-subunits, where the A-subunit is an acidic
polypeptide and the B-subunit is a basic polypeptide. The A- and B-subunits are disulfide
bonded in the native globulin, forming a dimer with a molecular weight of 54 kDa, which
further associates into a hexamer through non-covalent forces 17
. The 7S and 3S are the minor
fractions. 7S globulins are polypeptides with molecular weight of 55 kDa, and some minor
components with a molecular weight of 65 kDa are also present. The 3S fraction entails at
least two major components with molecular weight of about 15 and 21 kDa 16
.
Oat 12S globulin resembles the structure of 11S globulin of soy (glycinin), which has
demonstrated good gelling properties; hence oat protein has the potential to act as a gelling
agent. Identification and development of such key functionality from oat protein can
63
significantly promote its utilization in the food market. Ma et al. have considerably
contributed to this area of research. However such efforts are still limited compared to those
on dairy and soy proteins. Two previous publications demonstrated that oat protein could
form gels 144,145
. But at acidic and neutral pH, very weak gels with poor water holding
capacity were obtained. The gel properties improved after pH 8, but strong gels could only be
prepared at pHs 9–10. The gel hardness was greatly increased by both acetylation and
succinylation 56,219
. The authors suggested that the changes in the functional properties of oat
protein after modification resulted from altered conformation and increase in net charge 56,219-
221. This was later confirmed with the study of the thermal aggregation of oat globulin by
Raman spectroscopy 222
. In this work, changes in protein interactions and conformation were
induced by the addition of protein structure modifying agents such as chaotropic salts,
sodium dodecyl sulfate or dithiothreitol, which can either enhance or inhibit thermal gelation
of oat globulin.
Enzymatic hydrolysis is a preferable tool to alter functional properties of proteins because of
milder processing conditions required, easier control of reaction and minimal formation of
by-products 146
. Recent research has reported the effect of enzymatic hydrolysis over the
gelling properties of proteins including soy protein 98
, rice bran protein 99
, sunflower protein
100, and canola protein
97. Results from these studies indicate that improvement of the gelling
capacity is highly enzyme specific. The gelling properties of oat protein treated with trypsin
were studied in previous work 56,219
, however, weak gel structure was obtained due to the
short size of the protein molecules, which may no longer be able to associate to form a strong
gel matrix. Since the final composition and thus the use of the hydrolysates will depend on
the type of enzyme used and the hydrolysis conditions 96
. A systematic investigation of the
64
effect of various proteases over the gelling capacity of oat protein is required. Till now, such
information is not available, however important for the development of new modification
strategy to improve oat protein gelling properties.
Modification of protein conformation can also be achieved through limited hydrolysis, as
changes in the secondary and tertiary structure can be produced. This can alter the surface
exposure of reactive amino acids, leading to an increase in interactions favoring aggregation
24 and three-dimensional network formation. Our preliminary trials have demonstrated that
partial enzymatic hydrolysis can improve oat protein gelling properties under specific
conditions. Thus it is hypothesized that oat protein and its hydrolysates could form gels of
plant origin with similar properties as those from animal proteins such as egg white.
Therefore, this work aims to complete a systematic study of the thermal gelation of oat
protein and its hydrolysates under different environmental conditions with an emphasis on
the gel mechanical strength and water-holding capacity which are the most important gel
characteristics for food applications. If the defined gel physical properties would be in the
range of similar properties of animal protein derived gels, value-added opportunities would
exist for oat protein to be used as a new gelling ingredient in food formulations such as meat
binder and fat replacer to create food with improved quality and nutritive value, or used in
meat analogues for vegetarian foods. In this way, additional revenue return could be
generated to oat producers and processors to enhance their sustainability.
65
3.2. Materials and methods
3.2.1. Materials
Naked oat grains (Avena nuda) were purchased from Wedge Farms Ltd., Manitoba, Canada.
The protein content was 17.2%. Flavourzyme (≥ 500 U/g), alcalase (2.4 U/g), pepsin (
≥ 250 U/mg), trypsin (1462 U/mg), sodium dodecyl sulfate (SDS) and trinitro benzene
sulfonic acid (TNBS) were obtained from Sigma-Aldrich Canada (Oakville, ON, Canada). E-
Z run pre-stained protein ladder/marker was purchased from Fisher Scientific (Whitby, ON,
Canada).
3.2.2. Protein extraction
Oat grains were ground to flour using a mill (Ultra Centrifugal ZM 200 Retsch, PA)
equipped with a 0.5 mm screen. The flour was then defatted with hexane at room
temperature. Globular protein was extracted from the defatted oat flour according to the
method reported by Wu et al., (1977) 223
with some modifications. Briefly, defatted oat flour
was dispersed in an alkali solution adjusted to pH 9.2 using sodium hydroxide at a flour-to-
solvent ratio of 1:6 and mixed for 1 h at room temperature. The slurry then passed through a
300 μm wire mesh and the permeated mixture was centrifuged at 7000 ×g for 15 min. Then,
the supernatant was collected and pH was adjusted to 5 with 1 M HCl, followed by
centrifugation at 7000 ×g for 15 min. The pellet corresponding to the precipitated protein
was washed with distilled water and freeze-dried for later use. Protein content of the
extracted oat protein was determined using the Leco nitrogen analyzer (FP-428, Leco
Corporation, St Joseph, MI) and a nitrogen to crude protein conversion factor of 6.25 was
used.

66
3.2.3. Enzymatic hydrolysis of oat protein
A 2% (w/v) protein suspension was prepared with distilled water. The pH and temperature of
the suspension were adjusted to the optimum condition for each enzyme. Hydrolysis with
flavourzyme was carried out at pH 7 and 50˚C, alcalase at pH 8 and 50˚C, pepsin at pH 2
and 37˚C and trypsin at pH 8 and 37˚C. The enzyme/substrate ratio was set at 1/10 for all
treatments. Over the hydrolysis period (30 min) the pH was kept constant with 1 M HCl or
1 M NaOH. At the end of the hydrolysis, the solution was heated at 90˚C for 10 min to
inactivate the enzyme. Hydrolysate samples were dialyzed with a 10 kDa dialysis bag against
distilled water. Samples were collected, freeze-dried and stored for further experiments. The
protein content of the dried hydrolysates was also determined using the Leco nitrogen
analyzer (FP-428, Leco Corporation, St. Joseph, MI).
3.2.4. Characterization of oat protein and its hydrolysates
Degree of hydrolysis (DH) was determined by the TNBS assay (Adler-Nissen, 1979). Total
number of amino groups was determined in a sample completely hydrolyzed with 6 N HCl at
110˚C for 24 h. The DH was calculated with the following equation.
Where h (hydrolysis equivalents) is the amount of peptide bonds cleaved during hydrolysis,
which is expressed as millimole equivalents per gram of protein (mmol/g of protein) and htot
is the total amount of peptide bonds in the protein substrate. l-Leucine (0–1.5 mM) was used
to generate a standard curve (R2 = 0.99).
SDS-polyacrylamide gel electrophoresis (SDS-PAGE) was performed to study the molecular
weight of the oat protein subunits. Protein samples were mixed with sample buffer (0.125 M
67
Tris –HCl pH 6.8, 4% w/v SDS, 20% v/v glycerol, 0.5% 2-mercaptoethanol and 1%
bromophenol blue w/v) and heated at 100 °C for 5 min, then cooled to room temperature.
After cooling, 30 μL sample (1 mg/mL) was loaded on 4% stacking gel and 12% separating
gel and subjected to electrophoresis at a constant voltage of 160 V. After electrophoresis the
gels were stained with 0.1% (w/v) Coomassie Brilliant Blue R-250 in water–methanol–acetic
acid (4:5:1, v:v:v).
The molecular weight distribution of the samples was determined using a size exclusion high
performance liquid chromatography (SE-HPLC) system (Agilent 1200 series) equipped with
a Biosuite™ 125/5 μm HR-SEC column (7.8 × 300 mm, Water Corp. MA, USA). The
eluent used was 0.2 M phosphate buffer with 0.2 M NaCl (pH 7) at a flow rate of 0.5 mL/min
and room temperature. Samples (50 μL) were injected into the system and elution was
monitored at 220 nm. Standard molecular markers were used to calculate Mw of the oat
protein samples. A calibration curve was made from the log Mw of the markers and their
respective elution times (R2 = 0.97).
Amino acid composition analysis of the samples was performed using the Waters AccQ-Tag
™ precolumn method. Dried samples were hydrolyzed under vacuum and after derivatization
were loaded on a reversed phased column. The AccQ reagent, 6-aminoquinolyl-N-
hydrozysuccinimidyl carbamate, is an N-hydroxysuccinimide-activated heterocyclic
carbamate, which converts both primary and secondary amino acids to stable fluorescent
derivatives.
The denaturation temperature of OPI and its hydrolysates was determined using a differential
scanning calorimeter Q1000 (TA Instruments, New Castle, DE, USA). Approximately 10 μ
L of a 15% protein (w/v) suspension was weighed on a pre-weighed aluminum pan and
68
hermetically sealed. An empty hermetic pan was used as reference. The sample was heated at
a 10 °C/min, over a temperature range of 30–160 °C. The protein suspensions (15%
protein) were prepared at pHs 5, 7 and 9 to study the effect of pH on the protein denaturation
temperature. The denaturation temperature (Td) was computed from the thermograms as the
peak value detected by using computer software.
3.2.5. Gel preparation
Gels were prepared by heating the protein sample suspension (15%, w/v) at pHs 5, 7 and 9.
The pH of the suspension was adjusted using 1 N NaOH or 1 N HCl. Vacuum was applied to
remove air bubbles. Test tubes containing the suspension were tightly closed and placed in an
oil bath at 110 °C and 120 °C for 15 min. Once heat treatment was completed, the tubes
were cooled in an ice bath and stored in the refrigerator overnight.
3.2.6. Textural profile analysis (TPA)
The mechanical properties of the gels prepared above were evaluated using an Instron 5967
universal testing machine (Instron Corp., Norwood, MA, USA). Gels were released from test
tubes and cut into cylindrical pieces (~ 10 mm height, ~ 14 mm diameter). A two cycle
compression test using a 50 N load cell was performed at room temperature at a rate of
1 mm/min to evaluate their mechanical properties. Each sample was compressed to 50%,
since deformation levels between 20 and 50% have been commonly applied in several works
on gel food systems. At this level the sample does not break, but it is still possible to obtain
valuable information on important parameters 224
. The textural profile parameters including,
hardness, springiness and cohesiveness were calculated. These parameters were determined
form the typical Instron force– time curve in which hardness is calculated as the peak

69
compression force in the 1st bite cycle, and cohesiveness is the ratio of the area under the
first and second compression peaks. Springiness is the distance calculated from the area
under the second compression peak.
3.2.7. Scanning electron microscopy (SEM)
The morphology observation of the gels was carried out with a Phillips XL-30 scanning
electron microscope (FEI Company, Oregon, USA). The samples were frozen in liquid
nitrogen and freeze-dried before observation. Dry samples were coated with gold and
platinum and a scanning electron microscope was used to observe the microstructure of the
gels.
3.2.8. Water holding capacity (WHC)
A gel sample (0.9–1.2 g) was placed into a Vivaspin 20 centrifugal filter unit (GE Healthcare
Bio-Sciences AB, Uppsala, Sweden) and centrifuged at 290 ×g for 5 min at 15 °C. The
weight of the gel was recorded before (Wi) and after (Wf) centrifugation to the nearest
0.0001 mg and the percentage of water loss after centrifugation was expressed as:
((
) )
3.2.9. Statistical analysis
The results were evaluated by analysis of variance (ANOVA) and significant differences,
with minimum significance test set at the 5% level (p < 0.05) with Tukey's test to compare all
means, using GraphPad Prism 5 (GraphPad Software, La Jolla, CA, USA). All experiments
were performed at least in three independent trials and the results were reported as
mean ± standard deviation.

70
3.3. Results and discussion
The protein content of the final oat protein isolate (OPI) was 91.2% ± 2.4. Oat protein was
partially hydrolyzed using flavourzyme, alcalase, pepsin and trypsin, which are common in
industrial applications 96
. After 30 min of enzymatic treatment, limited hydrolysis was
achieved with the final DH% value reaching 7.1% ± 0.54, 5.8% ± 0.44, 5.5% ± 0.41 and
5.3% ± 0.40 for flavourzyme, alcalase, pepsin and trypsin hydrolysates and the samples
were labeled as OPI-F, OPI-A, OPI-P and OPI-T, respectively
3.3.1. Characterization of oat protein and its hydrolysates
3.3.1.1. SDS-PAGE
The SDS-PAGE pattern in Figure 2 demonstrates that the predominating protein fraction in
the extracted oat protein is 12S globulin (Lane 2). The acidic (12S-A) and basic (12S-B)
polypeptides are easily identified. The bands between 43 and 72 kDa and below 17 kDa
correspond to the 7S and 3S fractions, respectively.
Hydrolysis with flavourzyme partially affected the acidic polypeptide as the 12S-A fraction
bands shifted to a lower molecular weight region (26–34 kDa) (Lane 3). In contrast, alcalase
had a much stronger effect upon the 12S-A fraction as it disappeared in OPI-A sample (Lane
4). This 12S-A was less susceptible to trypsin as most of the original bands remained,
although the low end of the band shifted to a lower molecular weight range (Lane 6).
Flavourzyme is a protease composed of a mixture of endoprotease and exopeptidase, which
has been used to prepare short chain peptides and free amino acids 225
. Alcalase is an
endoprotease composed of a mixture of different proteases, each with different specificities
226, thus it has a broad specificity toward peptide bonds.
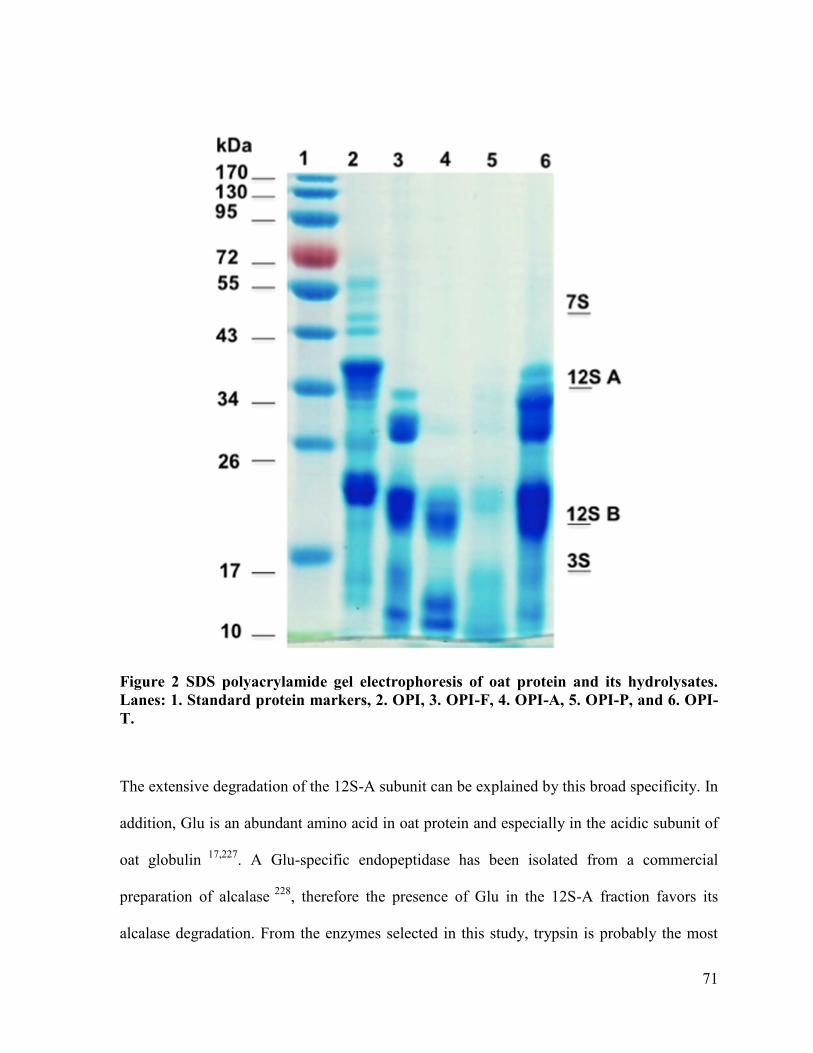
71
Figure 2 SDS polyacrylamide gel electrophoresis of oat protein and its hydrolysates.
Lanes: 1. Standard protein markers, 2. OPI, 3. OPI-F, 4. OPI-A, 5. OPI-P, and 6. OPI-
T.
The extensive degradation of the 12S-A subunit can be explained by this broad specificity. In
addition, Glu is an abundant amino acid in oat protein and especially in the acidic subunit of
oat globulin 17,227
. A Glu-specific endopeptidase has been isolated from a commercial
preparation of alcalase 228
, therefore the presence of Glu in the 12S-A fraction favors its
alcalase degradation. From the enzymes selected in this study, trypsin is probably the most
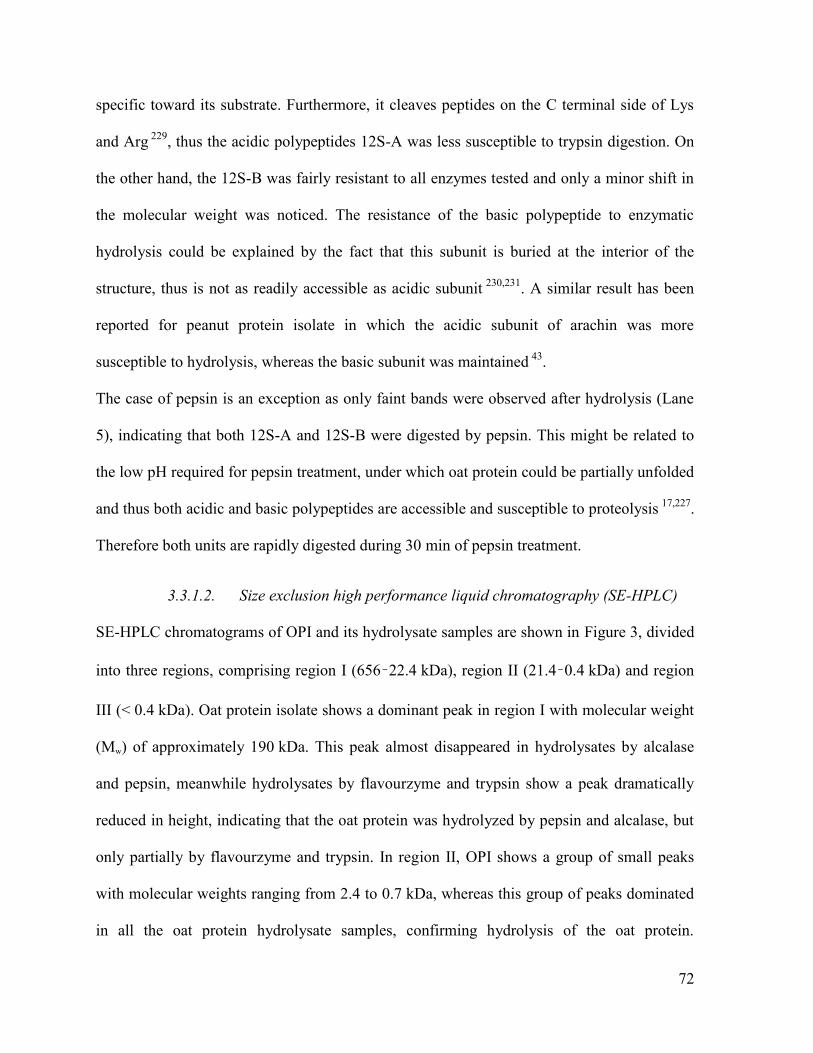
72
specific toward its substrate. Furthermore, it cleaves peptides on the C terminal side of Lys
and Arg 229
, thus the acidic polypeptides 12S-A was less susceptible to trypsin digestion. On
the other hand, the 12S-B was fairly resistant to all enzymes tested and only a minor shift in
the molecular weight was noticed. The resistance of the basic polypeptide to enzymatic
hydrolysis could be explained by the fact that this subunit is buried at the interior of the
structure, thus is not as readily accessible as acidic subunit 230,231
. A similar result has been
reported for peanut protein isolate in which the acidic subunit of arachin was more
susceptible to hydrolysis, whereas the basic subunit was maintained 43
.
The case of pepsin is an exception as only faint bands were observed after hydrolysis (Lane
5), indicating that both 12S-A and 12S-B were digested by pepsin. This might be related to
the low pH required for pepsin treatment, under which oat protein could be partially unfolded
and thus both acidic and basic polypeptides are accessible and susceptible to proteolysis 17,227
.
Therefore both units are rapidly digested during 30 min of pepsin treatment.
3.3.1.2. Size exclusion high performance liquid chromatography (SE-HPLC)
SE-HPLC chromatograms of OPI and its hydrolysate samples are shown in Figure 3, divided
into three regions, comprising region I (656–22.4 kDa), region II (21.4–0.4 kDa) and region
III (< 0.4 kDa). Oat protein isolate shows a dominant peak in region I with molecular weight
(Mw) of approximately 190 kDa. This peak almost disappeared in hydrolysates by alcalase
and pepsin, meanwhile hydrolysates by flavourzyme and trypsin show a peak dramatically
reduced in height, indicating that the oat protein was hydrolyzed by pepsin and alcalase, but
only partially by flavourzyme and trypsin. In region II, OPI shows a group of small peaks
with molecular weights ranging from 2.4 to 0.7 kDa, whereas this group of peaks dominated
in all the oat protein hydrolysate samples, confirming hydrolysis of the oat protein.

73
Hydrolysates by trypsin, pepsin and alcalase showed a major peak at ~ 0.7 kDa and a
shoulder with larger molecular weight. In contrast, the flavourzyme treated sample showed a
different contour including a sharp peak with molecular weight of 0.9 kDa and a dramatically
reduced shoulder peak, indicating that flavourzyme was more effective at producing low
molecular weight polypeptides.
Figure 3 Size exclusion chromatograms of oat protein and its hydrolysates
Oat protein isolates did not show any peaks in region III. On the other hand, all hydrolysates
contained small peptides, particularly those treated with flavourzyme as a sharp peak of
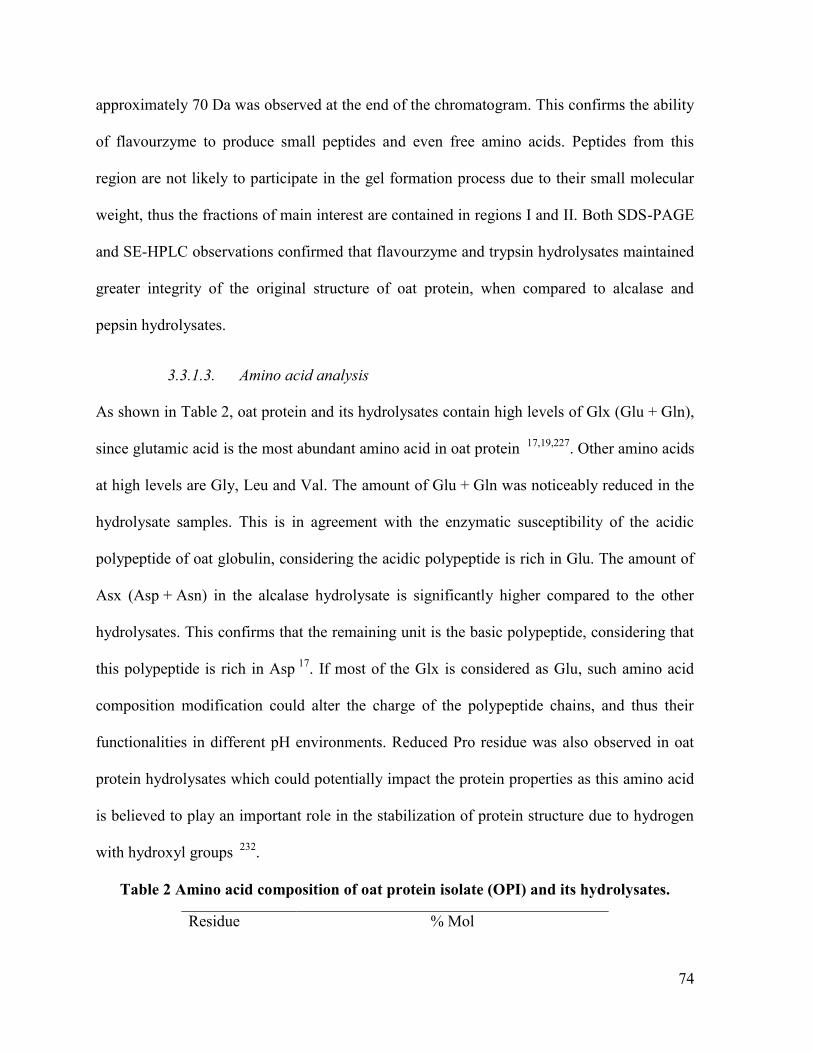
74
approximately 70 Da was observed at the end of the chromatogram. This confirms the ability
of flavourzyme to produce small peptides and even free amino acids. Peptides from this
region are not likely to participate in the gel formation process due to their small molecular
weight, thus the fractions of main interest are contained in regions I and II. Both SDS-PAGE
and SE-HPLC observations confirmed that flavourzyme and trypsin hydrolysates maintained
greater integrity of the original structure of oat protein, when compared to alcalase and
pepsin hydrolysates.
3.3.1.3. Amino acid analysis
As shown in Table 2, oat protein and its hydrolysates contain high levels of Glx (Glu + Gln),
since glutamic acid is the most abundant amino acid in oat protein 17,19,227
. Other amino acids
at high levels are Gly, Leu and Val. The amount of Glu + Gln was noticeably reduced in the
hydrolysate samples. This is in agreement with the enzymatic susceptibility of the acidic
polypeptide of oat globulin, considering the acidic polypeptide is rich in Glu. The amount of
Asx (Asp + Asn) in the alcalase hydrolysate is significantly higher compared to the other
hydrolysates. This confirms that the remaining unit is the basic polypeptide, considering that
this polypeptide is rich in Asp 17
. If most of the Glx is considered as Glu, such amino acid
composition modification could alter the charge of the polypeptide chains, and thus their
functionalities in different pH environments. Reduced Pro residue was also observed in oat
protein hydrolysates which could potentially impact the protein properties as this amino acid
is believed to play an important role in the stabilization of protein structure due to hydrogen
with hydroxyl groups 232
.
Table 2 Amino acid composition of oat protein isolate (OPI) and its hydrolysates.
Residue % Mol

75
OPI OPI-F OPI-A OPI-P OPI-T
Asxa 5.5 6.5 10.0 7.1 6.4
Serine 4.2 4.9 4.4 4.8 4.9
Glxb 22.4 16.4 14.9 15.5 20.3
Glycine 7.7 8.4 8.7 9.4 9.2
Histidine n.d. 3.2 n.d. n.d. n.d.
Arginine 6.0 8.2 8.6 8.5 7.9
Threonine 3.5 3.7 3.5 4.3 3.5
Alanine 6.7 6.6 6.8 7.0 6.9
Proline 7.3 5.5 5.5 5.9 5.7
Cysteine 2.4 1.6 1.3 2.5 1.6
Tyrosine 2.9 2.9 3.2 2.7 3.1
Valine 7.7 7.3 7.7 7.4 6.8
Methionine 2.1 1.4 1.3 2.0 1.3
Lysine 3.3 4.3 3.7 4.8 3.9
Isoleucine 4.6 5.6 6.1 5.2 5.5
Leucine 8.6 8.2 8.5 8.1 7.9
a Asx(Asp+Asn)
b Glx (Glu+Gln)
n.d. means not detectable
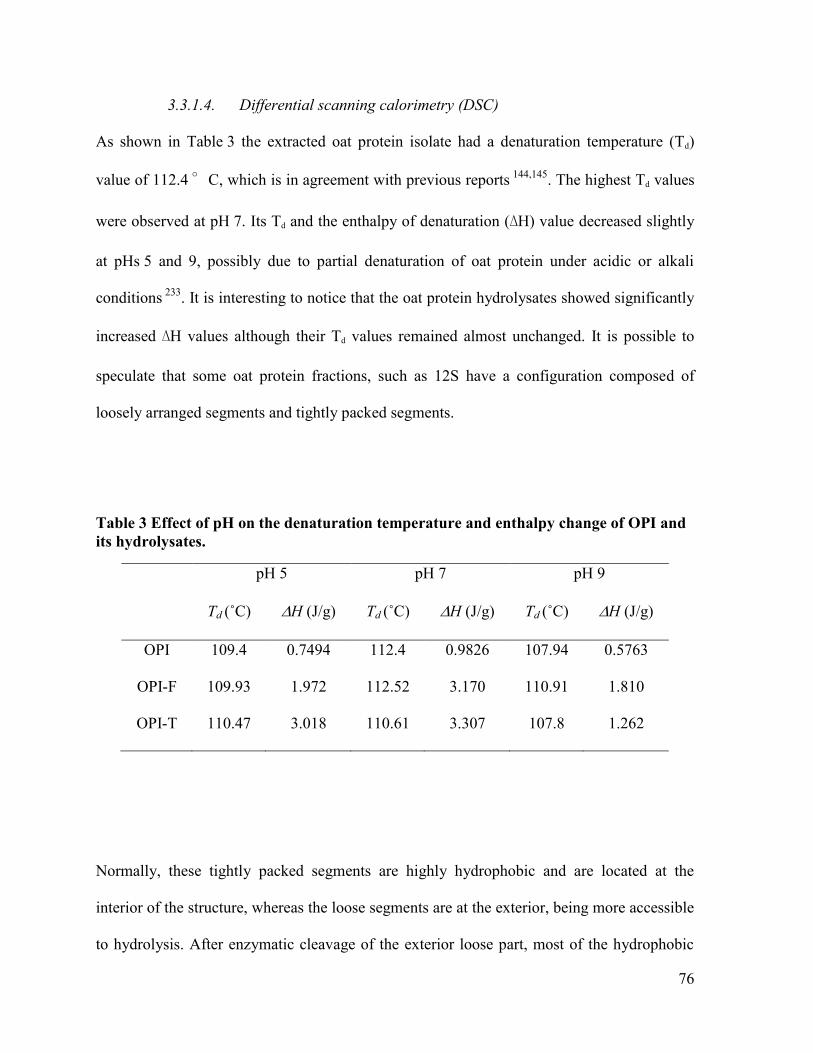
76
3.3.1.4. Differential scanning calorimetry (DSC)
As shown in Table 3 the extracted oat protein isolate had a denaturation temperature (Td)
value of 112.4 °C, which is in agreement with previous reports 144,145
. The highest Td values
were observed at pH 7. Its Td and the enthalpy of denaturation (∆H) value decreased slightly
at pHs 5 and 9, possibly due to partial denaturation of oat protein under acidic or alkali
conditions 233
. It is interesting to notice that the oat protein hydrolysates showed significantly
increased ∆H values although their Td values remained almost unchanged. It is possible to
speculate that some oat protein fractions, such as 12S have a configuration composed of
loosely arranged segments and tightly packed segments.
Table 3 Effect of pH on the denaturation temperature and enthalpy change of OPI and
its hydrolysates.
pH 5 pH 7 pH 9
Td (˚C) H (J/g) Td (˚C) H (J/g) Td (˚C) H (J/g)
OPI 109.4 0.7494 112.4 0.9826 107.94 0.5763
OPI-F 109.93 1.972 112.52 3.170 110.91 1.810
OPI-T 110.47 3.018 110.61 3.307 107.8 1.262
Normally, these tightly packed segments are highly hydrophobic and are located at the
interior of the structure, whereas the loose segments are at the exterior, being more accessible
to hydrolysis. After enzymatic cleavage of the exterior loose part, most of the hydrophobic
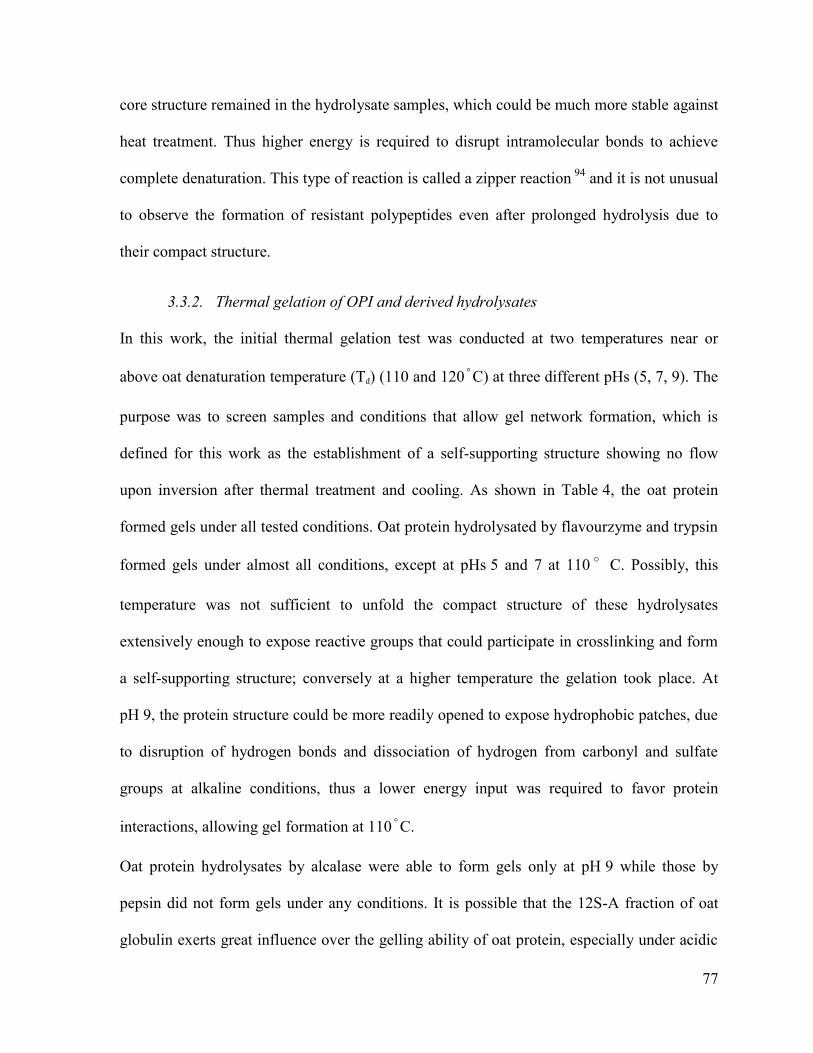
77
core structure remained in the hydrolysate samples, which could be much more stable against
heat treatment. Thus higher energy is required to disrupt intramolecular bonds to achieve
complete denaturation. This type of reaction is called a zipper reaction 94
and it is not unusual
to observe the formation of resistant polypeptides even after prolonged hydrolysis due to
their compact structure.
3.3.2. Thermal gelation of OPI and derived hydrolysates
In this work, the initial thermal gelation test was conducted at two temperatures near or
above oat denaturation temperature (Td) (110 and 120˚C) at three different pHs (5, 7, 9). The
purpose was to screen samples and conditions that allow gel network formation, which is
defined for this work as the establishment of a self-supporting structure showing no flow
upon inversion after thermal treatment and cooling. As shown in Table 4, the oat protein
formed gels under all tested conditions. Oat protein hydrolysated by flavourzyme and trypsin
formed gels under almost all conditions, except at pHs 5 and 7 at 110 °C. Possibly, this
temperature was not sufficient to unfold the compact structure of these hydrolysates
extensively enough to expose reactive groups that could participate in crosslinking and form
a self-supporting structure; conversely at a higher temperature the gelation took place. At
pH 9, the protein structure could be more readily opened to expose hydrophobic patches, due
to disruption of hydrogen bonds and dissociation of hydrogen from carbonyl and sulfate
groups at alkaline conditions, thus a lower energy input was required to favor protein
interactions, allowing gel formation at 110˚C.
Oat protein hydrolysates by alcalase were able to form gels only at pH 9 while those by
pepsin did not form gels under any conditions. It is possible that the 12S-A fraction of oat
globulin exerts great influence over the gelling ability of oat protein, especially under acidic
78
and neutral pH, as samples with well-preserved 12S-A subunits demonstrated good gelling
properties in such pH ranges. This might be partially related to the larger molecular weight of
the acidic fraction compared to the basic polypeptide, which allows exposure of more
reactive sites on a single polypeptide chain for intermolecular interaction development.
Table 4 Oat protein derived gels formed under different pH and temperature
conditions
pH 5 pH 7 pH 8
110˚C 120˚C 110˚C 120˚C 110˚C 120˚C
OPI ✓ ✓ ✓ ✓ ✓ ✓
OPI-F ✗ ✓ ✗ ✓ ✓ ✓
OPI-A ✗ ✗ ✗ ✗ ✓ ✓
OPI-P ✗ ✗ ✗ ✗ ✗ ✗
OPI-T ✗ ✓ ✗ ✓ ✓ ✓
✗ No gel
✓ gel formation
Whereas smaller fractions expose little reactive sites limiting the aggregation step, essential
for the gel network formation 234
. The formation of gel for alcalase hydrolysate at pH 9 might
be attributed to the low surface charge of the basic polypeptide under alkaline condition,
which has an isoelectric point of 8–9. Thus the limited net charge could favor network

79
formation via hydrophobic interactions due to reduced repulsive forces compared to those at
pHs 5 and 7 25
. The hydrolysate prepared with pepsin could not form gels due to loss of both
acidic and basic subunits. Gels prepared from oat protein and its hydrolysates by
flavourzyme and trypsin were selected for the following experiments, as these samples were
able to form gels under a broad range of conditions.
3.3.3. Textural profile analysis (TPA)
The mechanical properties of the gels prepared with oat protein isolate and its hydrolysates at
120 °C were then studied, including hardness (force required to attain a given deformation),
cohesiveness (work required to overcome the internal bonding of the material) and
springiness (rate at which a deformed material recovers to its original condition after removal
of deforming force) 235
. Results of TPA are shown in Figure. 4.a.
Oat protein isolate formed strong gels at pHs 5 (1.90 N) and 7 (1.92 N) at 120 °C. In
contrast, softer gels were observed at pH 8 (0.80 N) and very weak gels were obtained at
pH 9 (0.07 N). The network structure of a heat-denatured globular protein gel depends
greatly on the balance of attractive (hydrogen and hydrophobic interactions) and repulsive
(electrostatic) forces among the protein molecules, as determined by pH and ionic strength
144,236. Thus the right balance between the electrostatically repulsive force and the
hydrophobic attractive force should explain the strong gels obtained at pH 5 and pH 7.
However, beyond the optimal pH, disproportionate repulsive forces may have led to fewer
protein interactions, since very weak gels were formed at pH 9 and intermediate hardness
values were observed at pH 8. Similar behavior was observed in β -lactoglobulin gels
prepared at pH 8. In this case, excessive repulsive forces created a high energy barrier
preventing denatured protein molecules from associating and forming a strong self-
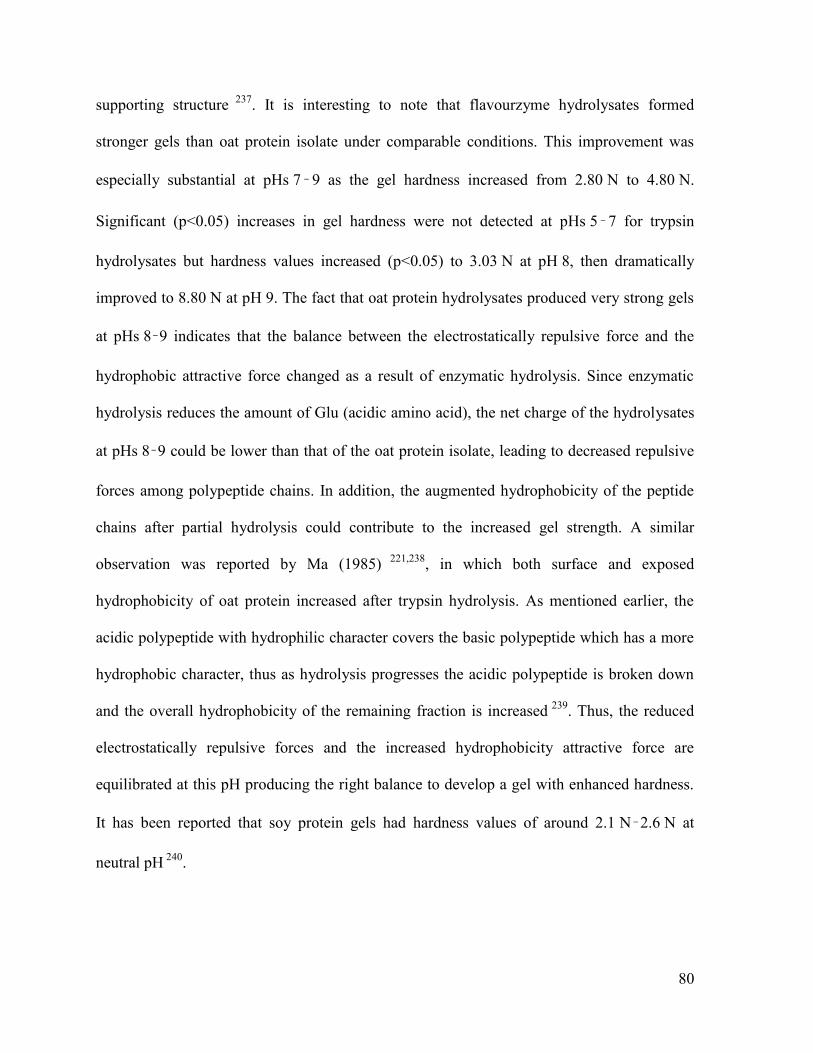
80
supporting structure 237
. It is interesting to note that flavourzyme hydrolysates formed
stronger gels than oat protein isolate under comparable conditions. This improvement was
especially substantial at pHs 7–9 as the gel hardness increased from 2.80 N to 4.80 N.
Significant (p<0.05) increases in gel hardness were not detected at pHs 5–7 for trypsin
hydrolysates but hardness values increased (p<0.05) to 3.03 N at pH 8, then dramatically
improved to 8.80 N at pH 9. The fact that oat protein hydrolysates produced very strong gels
at pHs 8–9 indicates that the balance between the electrostatically repulsive force and the
hydrophobic attractive force changed as a result of enzymatic hydrolysis. Since enzymatic
hydrolysis reduces the amount of Glu (acidic amino acid), the net charge of the hydrolysates
at pHs 8–9 could be lower than that of the oat protein isolate, leading to decreased repulsive
forces among polypeptide chains. In addition, the augmented hydrophobicity of the peptide
chains after partial hydrolysis could contribute to the increased gel strength. A similar
observation was reported by Ma (1985) 221,238
, in which both surface and exposed
hydrophobicity of oat protein increased after trypsin hydrolysis. As mentioned earlier, the
acidic polypeptide with hydrophilic character covers the basic polypeptide which has a more
hydrophobic character, thus as hydrolysis progresses the acidic polypeptide is broken down
and the overall hydrophobicity of the remaining fraction is increased 239
. Thus, the reduced
electrostatically repulsive forces and the increased hydrophobicity attractive force are
equilibrated at this pH producing the right balance to develop a gel with enhanced hardness.
It has been reported that soy protein gels had hardness values of around 2.1 N–2.6 N at
neutral pH 240
.
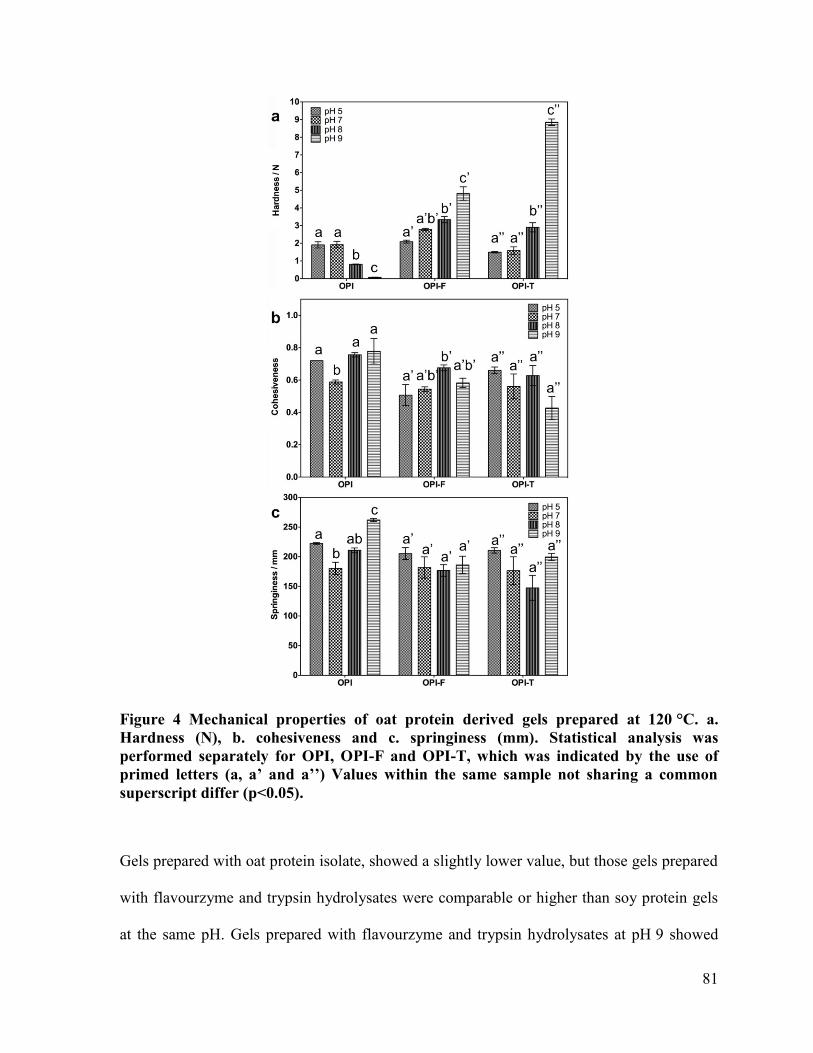
81
Figure 4 Mechanical properties of oat protein derived gels prepared at 120 °C. a.
Hardness (N), b. cohesiveness and c. springiness (mm). Statistical analysis was
performed separately for OPI, OPI-F and OPI-T, which was indicated by the use of
primed letters (a, a’ and a’’) Values within the same sample not sharing a common
superscript differ (p<0.05).
Gels prepared with oat protein isolate, showed a slightly lower value, but those gels prepared
with flavourzyme and trypsin hydrolysates were comparable or higher than soy protein gels
at the same pH. Gels prepared with flavourzyme and trypsin hydrolysates at pH 9 showed

82
enhanced hardness, and the results corresponding to trypsin hydrolysate gels are even
comparable to egg white protein gels (8.70 N) under the same pH 241
. It is understood that
gels prepared at pH 9 could have a limited application as most food products have a pH value
between 3 and 8. Nevertheless, egg white has a pH of 7.6–9.7 depending on the storage time
and temperature 242
, and yet it is commonly used in different applications. In addition, strong
oat protein gels were also obtained at pHs 7 and 8 after limited flavourzyme hydrolysis, and
at pH 8 after limited trypsin hydrolysis. These gels can be more widely used in different food
products.
The effect of trypsin hydrolysis upon the gelling capacity of oat protein was previously
studied by Ma and Wood (1986, 1987) 56,219
. The result indicated that trypsin treatment leads
to a weak gel structure, probably due to reduction in the size of the protein molecules, which
may no longer be able to associate to form a strong gel matrix. Whereas in this work, gels
with significantly improved hardness were obtained at pHs 8 and 9 after limited trypsin
hydrolysis due to maintenance of appropriate level of peptide size, allowing formation of
good three-dimensional networks. The detrimental effect of trypsin hydrolysis was also
observed as part of the preliminary experiments for this work (data not shown), in which
those hydrolysates produced after long periods of enzymatic treatment would not form a gel
at all. Gelling conditions also significantly affect the properties of the resulting gels. The
protein concentration and temperature selected for this study were higher than those applied
in the work reported by Ma and Wood (1986, 1987) 56,219
.
Oat protein isolate gels displayed good cohesiveness (Figure 4.b.) with values of 0.6–0.8 at
pHs 5–9. Similar values have been reported for soy protein isolate gels 243
. Gels prepared
with flavourzyme and trypsin hydrolysates also presented good cohesiveness, although
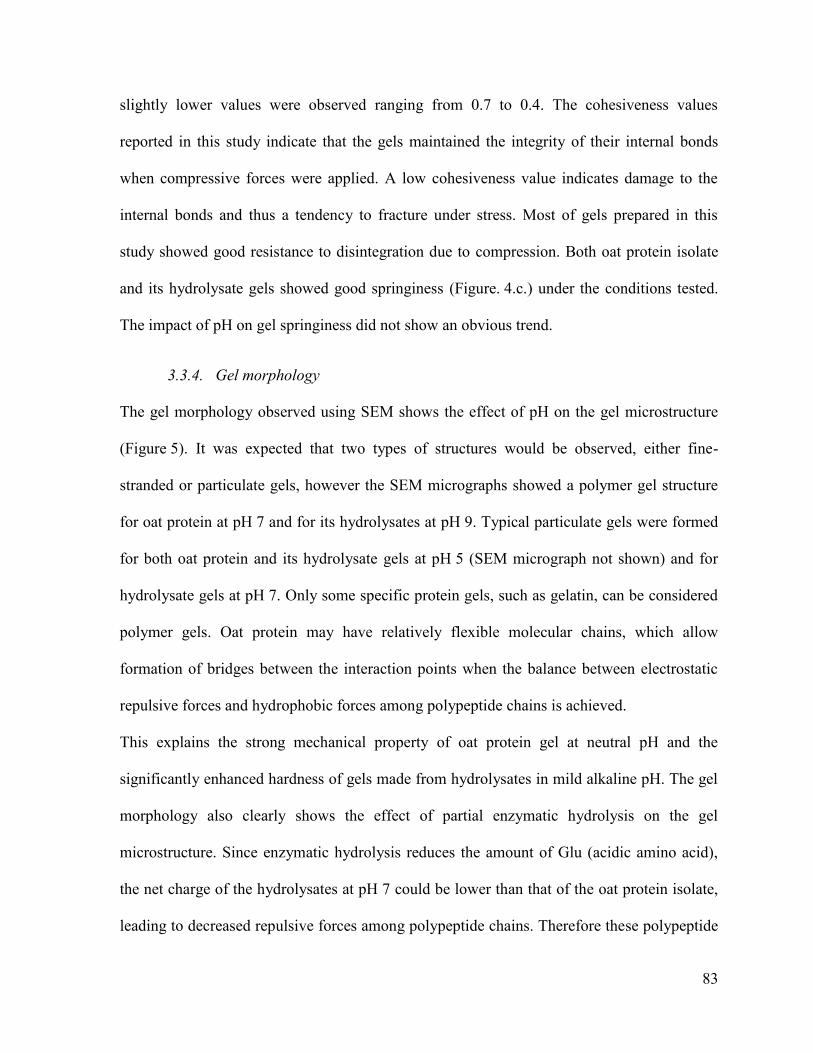
83
slightly lower values were observed ranging from 0.7 to 0.4. The cohesiveness values
reported in this study indicate that the gels maintained the integrity of their internal bonds
when compressive forces were applied. A low cohesiveness value indicates damage to the
internal bonds and thus a tendency to fracture under stress. Most of gels prepared in this
study showed good resistance to disintegration due to compression. Both oat protein isolate
and its hydrolysate gels showed good springiness (Figure. 4.c.) under the conditions tested.
The impact of pH on gel springiness did not show an obvious trend.
3.3.4. Gel morphology
The gel morphology observed using SEM shows the effect of pH on the gel microstructure
(Figure 5). It was expected that two types of structures would be observed, either fine-
stranded or particulate gels, however the SEM micrographs showed a polymer gel structure
for oat protein at pH 7 and for its hydrolysates at pH 9. Typical particulate gels were formed
for both oat protein and its hydrolysate gels at pH 5 (SEM micrograph not shown) and for
hydrolysate gels at pH 7. Only some specific protein gels, such as gelatin, can be considered
polymer gels. Oat protein may have relatively flexible molecular chains, which allow
formation of bridges between the interaction points when the balance between electrostatic
repulsive forces and hydrophobic forces among polypeptide chains is achieved.
This explains the strong mechanical property of oat protein gel at neutral pH and the
significantly enhanced hardness of gels made from hydrolysates in mild alkaline pH. The gel
morphology also clearly shows the effect of partial enzymatic hydrolysis on the gel
microstructure. Since enzymatic hydrolysis reduces the amount of Glu (acidic amino acid),
the net charge of the hydrolysates at pH 7 could be lower than that of the oat protein isolate,
leading to decreased repulsive forces among polypeptide chains. Therefore these polypeptide
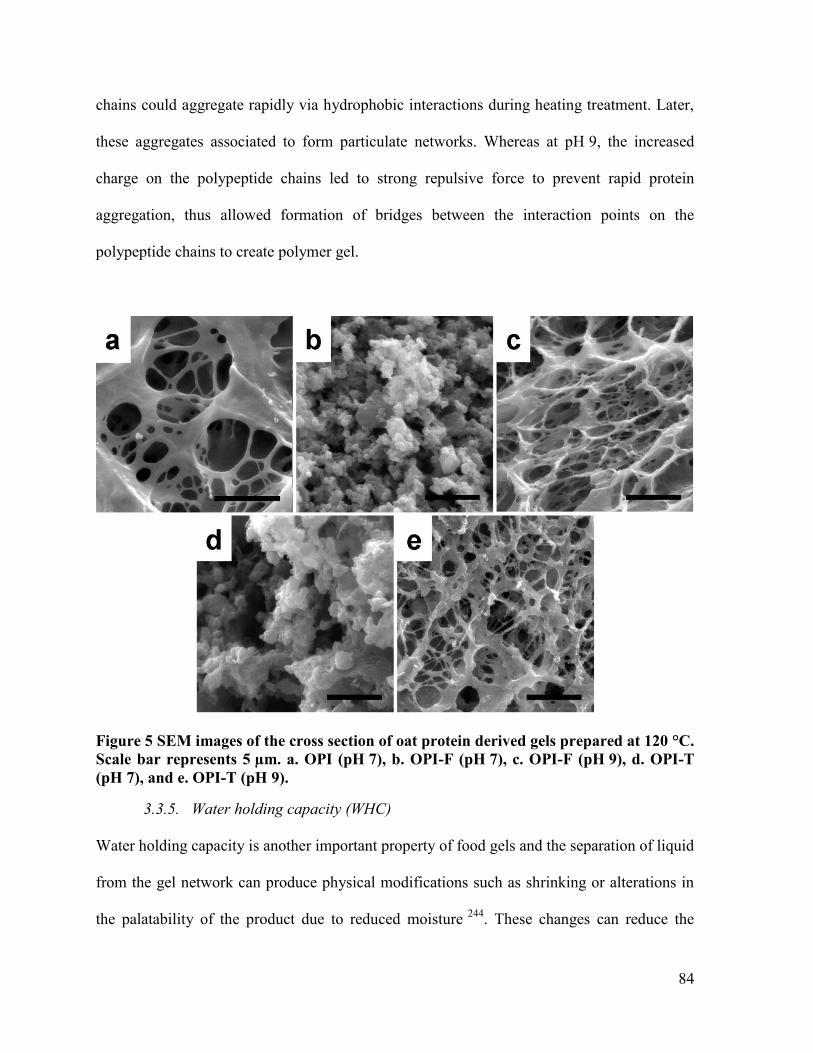
84
chains could aggregate rapidly via hydrophobic interactions during heating treatment. Later,
these aggregates associated to form particulate networks. Whereas at pH 9, the increased
charge on the polypeptide chains led to strong repulsive force to prevent rapid protein
aggregation, thus allowed formation of bridges between the interaction points on the
polypeptide chains to create polymer gel.
Figure 5 SEM images of the cross section of oat protein derived gels prepared at 120 °C.
Scale bar represents 5 µm. a. OPI (pH 7), b. OPI-F (pH 7), c. OPI-F (pH 9), d. OPI-T
(pH 7), and e. OPI-T (pH 9).
3.3.5. Water holding capacity (WHC)
Water holding capacity is another important property of food gels and the separation of liquid
from the gel network can produce physical modifications such as shrinking or alterations in
the palatability of the product due to reduced moisture 244
. These changes can reduce the

85
quality and acceptability of the product and for this reason a high WHC is required in gels
destined for food applications. All gels demonstrated excellent WHC (82.8–95.5%) at pHs 7–
9 as shown in Figure 6. Significantly reduced WHC values (61.5–65.2%) were observed at
pH 5. According to previous literature, particulate gels formed at pH near the isoelectric
point are characterized by an increased pore size that leads to a decrease in capillary forces
and therefore a higher water loss 245
. The WHC of gels prepared with oat protein isolate at
pH 9 could not be determined as they were very weak. The WHC values reported in this
work are comparable to soy protein (82.2%) 246
and whey protein (~ 88%) 247
.
Figure 6 Water holding capacity of oat protein derived gels prepared at 120˚C.
Statistical analysis was performed separately for OPI, OPI-F and OPI-T, which was
indicated by the use of primed letters (a, a’ and a’’) Values within the same sample not
sharing a common superscript differ (p<0.05).
86
3.4. Conclusion
This study has demonstrated that partially hydrolyzed oat protein could form gels with
similar mechanical strength and water-holding capacity as those from animal proteins such as
egg white. Thus we can conclude that oat protein gels have potential of replacing those
derived from animal proteins to provide texture and structure in food products. This will
provide value-added opportunities for oat producers and processors, and at the same time,
manufacturers could have access to a new and cost-effective gelling ingredient of plant origin
in diversified food formulations.
Chapter 4
4. Inulin at low concentrations significantly improves the gelling
properties of oat protein – a molecular mechanisms study
4.1. Introduction
Oats are an important crop worldwide, with an annual production of approximately 21
million tonnes. Canada is a major supplier of oats, making up the majority of world oat trade
248. However, Canadian oats are mainly used as animal feed and only a portion of the grain is
used for human consumption. Oat has recently attracted research and commercial attention
mainly due to the growing public awareness of the health benefits of β-glucan, which is
known to reduce blood cholesterol and glucose levels. Several techniques have been
developed to isolate β-glucan from oat grain as a health ingredient in food products. Protein
87
is the second largest component (12-20%) in oats after starch. Oat protein have a superior
amino acid profile due to a higher content of lysine because globulins represent 70-80% of
the total protein in oats, whereas alcohol-soluble prolamines are the major storage proteins in
other cereals 13
. The 12S globulin is the major oat protein fraction, which resembles the
structure of 11S globulin of soy (glycinin), thus oat protein possess gelling potential 56,144,249
.
Plant proteins are normally considered inferior to animal proteins (e.g. gelatin, egg white and
whey protein) in terms of gelling properties. In our recent work, trypsin treated oat protein
could form gels with comparable mechanical strength to egg white protein at pH 9 249
. This
has provided opportunity for oat protein to be used a new gelling ingredient from plant
resources in food formulations such as meat binder and fat replacer, or used in meat
analogues for vegetarian foods. However, strong gels could be only obtained at alkali pH
when heated to 110-120oC. The gels were weak when formed under acidic and neutral pH at
100oC. This has significantly limited applications of oat protein in food systems that
normally have pH values in the range of 2.5 to 7 and heating temperature at 100oC or lower.
Therefore novel approaches to enable formation of stronger oat protein gels within a more
appropriate pH and temperature for food processing are necessary to promote the utilization
of oat protein as a gelling agent.
The gelling properties of proteins can be affected by interaction with other components, such
as polysaccharides. Protein and polysaccharide are often mixed to develop food products
with novel textural properties. The interactions developed among protein and polysaccharide
will define the microstructure of food products and thus the resulting texture or mechanical
properties. Interactions between protein and polysaccharides can be either associative or
segregative depending on the molecular characteristics of the contributing polymers and the
88
medium conditions such as pH and ionic strength 122,124
. Coacervate networks are one
continuous network and they are formed by favorable attractive interactions between protein
and polysaccharide 250
. When no strong interactions exist between protein and
polysaccharide, interpenetrating networks are formed, where each polymer is in its own
continuous network 129
. Phase-separated networks are formed when interactions between
them are repulsive, resulting in a bi-continuous phase or a continuous supporting phase
containing inclusions of the other phase 49
. Previous reports show that protein-polysaccharide
interactions can be modulated to reinforce the gel forming properties of meat 251
, whey
49,252,253, and soy protein
254.
Inulin is a non-digestible polysaccharide naturally occurring in several edible fruits and
vegetables. It is formed by fructose molecules linked by β-(2-1) glycosidic bonds, generally
with a terminal glucose unit connected to the last fructose by an α-(1-2) bond 255
. Due to the
unique nature of inulin bonds, digestive enzymes in the human gut cannot hydrolyze this
polysaccharide. Inulin reaches the colon undigested and produces a prebiotic effect since it
is fermented by lactic acid bacteria 256
. Additionally, inulin has other interesting biological
properties such as enhancing mineral absorption, and reducing both blood lipid levels and the
risk of colon cancer 255
.The utilization of inulin in the food industry is not limited to its
biological properties; it is also incorporated in food formulations as a fat replacer or bulking
agent, such as in baked goods, sauces and yogurt 256
. Such a wide range of applications is
related to its capacity to form microcrystals that interact with each other forming small
aggregates. These aggregates immobilize a great amount of water, thus create a fine creamy
texture that provides a mouth sensation similar to that of fat 257
. Previous reports have
investigated the influence of inulin addition in milk 258
, soy protein gels 254
, yogurt 259
and

89
cheese 260
, finding that the protein-inulin system had improved gelling properties.
Nonetheless the effect of inulin addition on the gelation properties of oat protein has never
been reported. Thus it is hypothesized that inulin addition can produce a synergistic effect
which will enable the formation of strengthened oat protein gels.
The aim of this work is to investigate the effect of oat protein and inulin interactions on the
gelling properties of oat protein isolate. Mechanical and rheological properties of oat protein
gels were determined and their microstructures were observed. We attempt to better
understand gelling mechanisms of oat protein-inulin system by correlating protein structure
changes during heating to gel microstructures and bulk properties. Improvement of the
gelling properties of oat protein at acidic and/or neutral pH may create broad applications of
this plant-sourced gelling ingredient in foods. These value-added opportunities may represent
very significant sources of revenue to oats producers and processors to enhance their
sustainability.
4.2. Material and Methods
4.2.1. Materials
Oat protein isolate (OPI) was extracted according to our previous work 249
and the protein
content was determined to be 90.4 % ± 0.6 using the Leco nitrogen analyzer (FP-428, Leco
Corporation, St Joseph, MI). Inulin was extracted from chicory root with an average
polymerization degree of 25 according to product specifications; 2-mercaptoethanol, urea,
sodium dodecyl sulfate, fluorescein isothiocyanate (FITC), Rhodamine B and dimethyl
sulfoxide (DMSO) were obtained from Sigma-Aldrich Canada (Oakville, ON, Canada).

90
4.2.2. Gel preparation
Gels were prepared by heating the protein-inulin suspensions at pH 2.5, 5 and 7 adjusted with
0.1 N NaOH or HCl. The concentration of OPI in the mixtures was kept constant at 15%
(w/v), which was revealed to be the optimized oat protein concentration for gel formation 249
.
The concentration of inulin varied from 0 to 0.5% (w/v) in the mixture, these values were
selected based in preliminary trials. Samples were labeled as OPI, OPI-I 0.1%, OPI-I 0.25%
and OPI-I 0.5%, representing inulin content of 0%, 0.1%, 0.25% and 0.5% respectively. Test
tubes containing the suspension were tightly closed and placed in an oil bath at 100˚C for 30
min. Once the heat treatment was completed, the tubes were cooled in an ice bath and stored
in the refrigerator overnight.
4.2.3. Textural profile analysis (TPA)
The mechanical properties of the gels were evaluated using an Instron 5967 universal testing
machine (Instron Corp., Norwood, MA, USA). Gels were dismounted from test tubes and cut
into cylindrical pieces (∼10 mm height, ∼14 mm diameter). A two cycle compression test
using a 50 N load cell was performed at room temperature at a rate of 1 mm/min and 50%
compression to evaluate their mechanical properties. The textural profile parameters were
determined from the typical Instron force-time curve. Compressive stress was calculated as
the peak compression force in the 1st bite cycle divided by the initial cross-section area of the
gel sample. Springiness is the distance calculated from the area under the second
compression peak and gumminess is the product of peak compression force in the 1st bite
cycle multiplied by cohesiveness.
91
4.2.4. Water Holding Capacity (WHC)
A gel sample (~ 1.0 g) was placed into a Vivaspin 20 centrifugal filter unit (GE Healthcare
Bio-Sciences AB, Uppsala, Sweden) and centrifuged at 290 × g for 5 min at 15˚C 249
. The
weight of the gel was recorded before (Wi) and after (Wf) centrifugation to the nearest 0.0001
mg and the percentage of water loss after centrifugation was expressed as:
((
) )
4.2.5. Scanning electron microscopy (SEM)
The morphology observation of the gels was carried out with a Phillips XL-30 scanning
electron microscope (FEI Company, Oregon, USA) at an acceleration voltage of 6 kV. The
samples were frozen in liquid nitrogen and freeze-dried before observations. The cross-
section and surfaces of the dry gels were sputtered with gold and platinum, observed and
photographed.
4.2.6. Rheological measurements
The rheological measurements were done with a TA Discovery HR-3 rheometer (TA
instruments, New Castle, DE, USA). Approximately 1 mL sample was loaded in the bottom
plate of the parallel plate geometry; the upper plate was lower to the appropriate geometry
gap. To avoid evaporation during heating a solvent trap was used and a thin layer of silicone
oil was applied. The temperature of the bottom plate was controlled with a Peltier system. To
study the changes in viscoelastic properties as a function of temperature, OPI and OPI-inulin
suspensions were subject to a temperature ramp from 25 to 95˚C, then cooled down to 25˚C
at a rate of 1.5˚C/min. Sample conditioning took place before and after each temperature
ramp for a period of 3 min. The temperature ramp was not run up to the gelling temperature

92
used in other experiments described in this paper (100˚C) as preliminary experiments
reaching 100˚C produced unstable readings due to water boiling, thus the maximum
temperature used was 95˚C. All rheological measurements were done within a
predetermined linear viscoelastic region at the strain value of 0.05%. To study the molecular
interactions involved in the formation of OPI and OPI-inulin gels, a frequency sweep
analysis was conducted on gels compressed to 80% of its original height. Gels were prepared
as previously described in the gel preparation section at pH 2.5, 5 and 7 and cut into
approximately 1 cm (height) sections. The resulting gel disk were submerged for 48 h in
solutions of 2-mercapthoethanol (2-ME) (0.2 M), urea (6 M) or sodium dodecyl sulfate
(SDS) (1% w/v), which could disrupt disulfide bonds, hydrogen bonds and hydrophobic
interactions, respectively.
4.2.7. Confocal laser scanning microscopy (CSLM)
CSLM was used to observe the distribution of inulin within the protein network. A laser
scanning confocal microscope Zeiss LSM710 (Carl Zeiss Microscopy, Jena, Germany) was
used with a 63× oil immersion objective. Inulin was labeled covalently with FITC.
Specifically, 0.5 g of inulin and 10mL of DMSO were stirred overnight, and then 7mg of
FITC were added to the inulin-DMSO mixture. The reaction mixture was protected from the
light, heated at 90˚C for 2 hours and dialyzed extensively against distilled water in the dark
and freeze-dried. Rhodamine B was used for non-covalent labeling of oat protein. A 15%
protein suspension was first prepared, and then 40μL of Rhodamine B (5mg/mL) were added
to 1 mL of protein suspension. The mixture was stirred for 2 h at room temperature, dialyzed
against distilled water in the dark and freeze-dried. Once protein and inulin were labeled,
OPI-inulin suspensions were prepared as described previously in the gel preparation section.
93
Samples were place into a concave microscope glass slide, covered with a lamella, sealed
with nail polish and then heated for 15 min at 40, 60, 80, and 100˚C. After heating, samples
were cooled in an ice bath and stored in the refrigerator overnight. Unheated sample
measured at 25˚C was used as control. The fluorescent images were obtained simultaneously
at wavelengths of 488 nm and 516 nm, and then analyzed with ZEN 2009 LE software (Carl
Zeiss AG, Oberkochen, Germany).
4.2.8. Particle size measurements
A Zetasizer Nano ZS ZEN1600 system (Malvern Instruments, U.K.) was used to study the
evolution of particle size distribution as a function of increasing temperature. For particle
size measurements the OPI and OPI-inulin suspensions were heated at 40, 60, 80 and 100˚C
for 30 min. Unheated sample measured at 25˚C was used as control. After heating, samples
were immediately cooled in an ice bath to room temperature. Samples were then diluted to a
total concentration of 0.1% (w/v) and passed through a 0.45 μm pore size filter prior to
measurement. Number-based particle size distribution was measured to identify the total
number of particles of a given size 261
.
4.2.9. Fourier transform infrared (FTIR) spectroscopy
In order to observed changes in protein conformation during heating, the infrared spectra of
OPI and OPI-inulin suspensions was recorded using a Nicolet 6700 spectrometer (Thermo
Fisher Scientific Inc., MA, USA). OPI and OPI-inulin suspensions (5%, v/w) were dissolved
in D2O. To ensure complete H/D exchange, samples were prepared 48 h before infrared
measurements. Suspensions were placed between two CaF2 windows separated by a 25 μM
polyethylene terephthalate spacer in a temperature controlled infrared transmission cell.
Temperature was regulated by a Peltier controller (Thermo Fisher Scientific Inc., MA, USA).
94
Samples were heated from 20 to 80˚C, and the sample was equilibrated and the spectra were
automatically recorded every 10˚C. Since the Peltier controller was not able to reach 100˚C,
samples heated at 100˚C were prepared by the KBr-disk method. For such, the gels were
prepared as previously described and freeze-dried. The dried gel was crush into powder,
vacuum–dried at 40˚C overnight and mixed with KBr powder (1:100 w/w). Then the
mixtures was compressed to 13 mm discs and used for spectroscopy measurements. To study
the amide I region of the protein (1700-1600 cm-1
), Fourier self-deconvolutions were
performed using the software provided with the spectrometer (Omnic 8.1.210 software).
Each spectrum was the result of 128 scans; band narrowing was achieved with a full width at
half maximum of 20-25 cm-1
and with resolution enhancement factor of 2.0-2.5 cm-1
. During
measurements Nitrogen was continuously run through the spectrometer.
4.2.10. Statistical analysis
The results were evaluated by an analysis of variance (ANOVA) and significant differences,
with minimum significance test set at the 5% level (p < 0.05) with Tukey's test to compare all
means, using GraphPad Prism 5 (GraphPad Software, La Jolla, CA, USA). All experiments
were performed at least in three independent trials and the results were reported as
mean ± standard deviation.
4.3. Results and Discussion
4.3.1. Gel texture
The mechanical properties of the gels including compressive stress, springiness and
gumminess are summarized in Table 5. Compressive stress indicates the capacity of the
material to withstand a given deformation. For OPI alone, the compressive stress values of
95
the gels were 10.19 and 11.29 kPa at pH 5 and 7, respectively. Previous research suggested
that a balance between electrostatic repulsive forces and hydrophobic attractive forces could
be achieved at pH 5 and 7, thus allowed formation of gel networks 249
. Hydrogen and
disulfide bonds also contributed to the protein network formation by balancing the
electrostatic repulsive forces. Whereas, at pH 2.5 strong electrostatic repulsive forces among
positively charge amino acid residues prevented attractive interaction development, leading
to low compressive stress value (1.53 kPa). Disulfide bonds were unlikely to take place under
acidic conditions 262
due to low reactivity of cysteine, which may partially explain formation
of very weak networks.
At pH 7, addition of a small amount of inulin (0.25-0.5%) greatly increased the compressive
stress of the gels, which equal to 1.67 - 3.33 % dry weight of protein. This effect is especially
strong at the highest level of inulin addition (OPI-I 0.5%) as compressive stress values
increased from 11.29 to 22.98 kPa. Since inulin is incapable of forming a gel on its own,
under any of the concentration utilized in this study, the great improvement of the
mechanical strength resulted from a synergistic effect of inulin and OPI. At pH 5 the addition
of inulin produced a slight increment of the compressive stress values, however this change
was not a significant improvement (p<0.05). Gels prepared at pH 5 with and without inulin
were prone to syneresis because water release was observed both after heating treatment and
mechanical property test. The compressive stress values reported for gels at pH 5 could be
overestimated, since the exudation of water resulted in a higher solid content in the actual gel
network. At pH 2.5, the addition of inulin did not produce a significant improvement
(p<0.05) of the compressive stress value either, which ranged from 1.53 to 2.19 kPa. Earlier
research showed that heating of inulin under acidic conditions caused intensive hydrolysis,
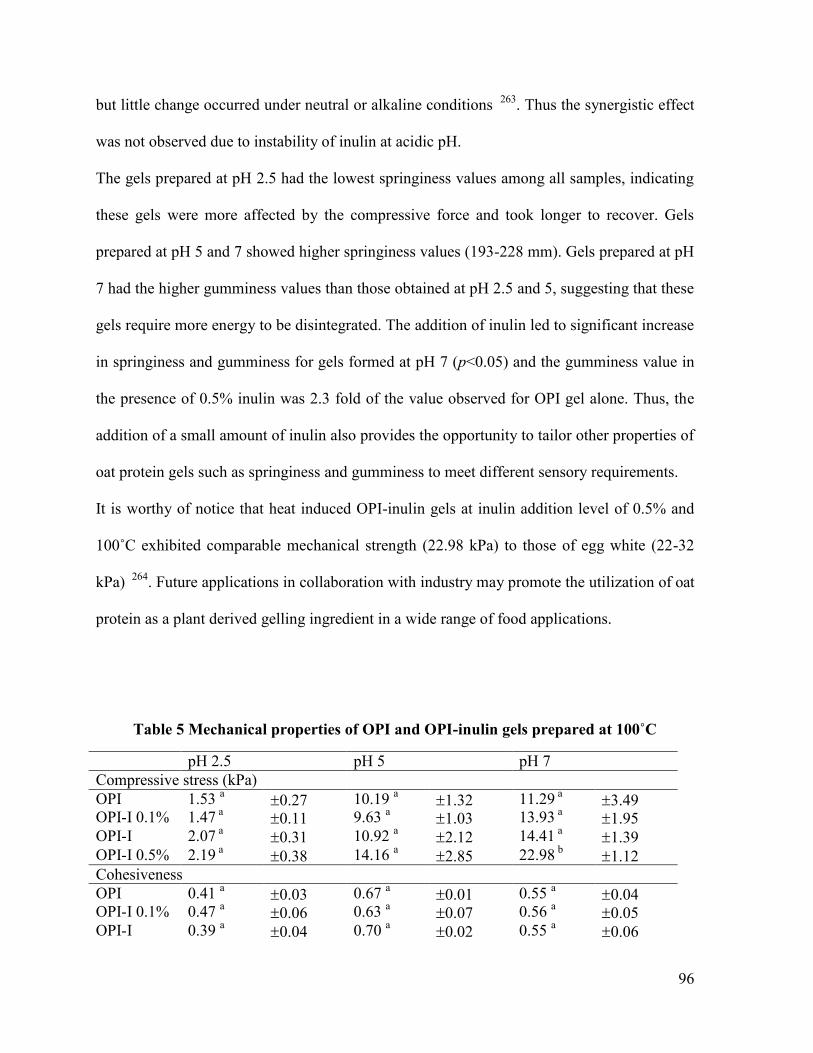
96
but little change occurred under neutral or alkaline conditions 263
. Thus the synergistic effect
was not observed due to instability of inulin at acidic pH.
The gels prepared at pH 2.5 had the lowest springiness values among all samples, indicating
these gels were more affected by the compressive force and took longer to recover. Gels
prepared at pH 5 and 7 showed higher springiness values (193-228 mm). Gels prepared at pH
7 had the higher gumminess values than those obtained at pH 2.5 and 5, suggesting that these
gels require more energy to be disintegrated. The addition of inulin led to significant increase
in springiness and gumminess for gels formed at pH 7 (p<0.05) and the gumminess value in
the presence of 0.5% inulin was 2.3 fold of the value observed for OPI gel alone. Thus, the
addition of a small amount of inulin also provides the opportunity to tailor other properties of
oat protein gels such as springiness and gumminess to meet different sensory requirements.
It is worthy of notice that heat induced OPI-inulin gels at inulin addition level of 0.5% and
100˚C exhibited comparable mechanical strength (22.98 kPa) to those of egg white (22-32
kPa) 264
. Future applications in collaboration with industry may promote the utilization of oat
protein as a plant derived gelling ingredient in a wide range of food applications.
Table 5 Mechanical properties of OPI and OPI-inulin gels prepared at 100˚C
pH 2.5 pH 5 pH 7
Compressive stress (kPa)
OPI 1.53 a 0.27 10.19
a 1.32 11.29
a 3.49
OPI-I 0.1% 1.47 a 0.11 9.63
a 1.03 13.93
a 1.95
OPI-I
0.25%
2.07 a 0.31 10.92
a 2.12 14.41
a 1.39
OPI-I 0.5% 2.19 a 0.38 14.16
a 2.85 22.98
b 1.12
Cohesiveness
OPI 0.41 a 0.03 0.67
a 0.01 0.55
a 0.04
OPI-I 0.1% 0.47 a 0.06 0.63
a 0.07 0.56
a 0.05
OPI-I
0.25%
0.39 a 0.04 0.70
a 0.02 0.55
a 0.06

97
OPI-I 0.5% 0.26 b 0.03 0.68
a 0.05 0.55
a 0.08
Springiness (mm)
OPI 130.20 5.37 211.13 7.74 163.05 15.42 OPI-I 0.1% 159.83 21.43 193.13 6.14 228.21 20.47 OPI-I
0.25%
143.73 21.12 208.16 4.76 220.73 9.85 OPI-I 0.5% 197.82 17.65 208.88 12.73 217.81 17.46
Gumminess (N)
OPI 0.08 a 0.01 0.90
ab 0.09 0.73
a 0.12
OPI-I 0.1% 0.09 a 0.02 0.80
a 0.10 0.90
a 0.14
OPI-I
0.25%
0.10 a 0.02 0.94
ab 0.15 1.03
a 0.10
OPI-I 0.5% 0.08 a 0.01 1.16
b 0.13 1.68
b 0.18
Values are means standard deviation
4.3.2. Water-holding capacity (WHC)
WHC is a key property of gels and low values often result in dry products and low texture
stability. As shown in Figure 7, WHC values ranging from 85.09 to 93.29% were recorded
for all gels except for those prepared at pH 5 with values around 60%. This is in agreement
with the syneresis and observation of water released after the compressive tests at pH 5. With
increase of inulin, a slight increasing trend was observed for WHC value at pH 5. At pH 2.5
and 7 the addition of inulin did not significantly impact (p<0.05) the gel WHC.
The OPI and OPI-inulin gels exhibited higher or comparable WHC values to those of gels
prepared with soy protein/loctus bean gum (>60%) 265
, whey protein/cassava starch (>85%)
266 and egg white protein/konjac glucomannan (90.2%)
48.

98
Figure 7 Water holding capacity of OPI and OPI-inulin gels prepared at 100˚C.
Statistical analysis was performed separately for each pH, which was indicated by the
use of primed letters (a, a’ and a”). Values within the same pH not sharing a common
superscript differ (p<0.05).
4.3.3. Scanning electron microscopy (SEM)
Globular proteins generally form either particulate or fine-stranded gels depending on the
environmental pH and ionic strength 262
. At pH 5 (Figure 8) bundles of large spheroid
aggregates are randomly distributed along the oat protein networks, forming a characteristic
particulate gel. The low net charge of the protein produced minimal repulsion, thus protein
molecules unsystematically aggregate to form particulate microstructure. This also favored
the development of protein-protein interactions, whereas protein-water interactions were
limited, leading to gels with low water holding capacity 267
. It is interesting to notice that oat
protein gels (Figure 8) show percolating networks at pH 2.5 and 7, similar to that formed by
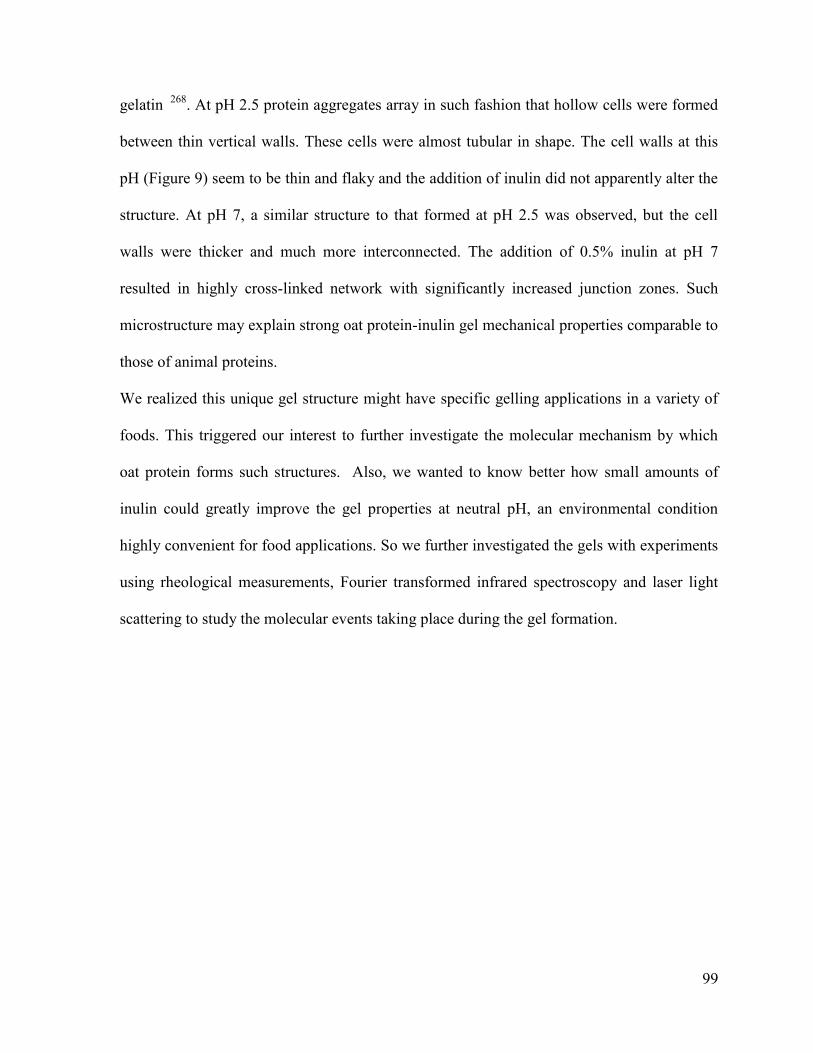
99
gelatin 268
. At pH 2.5 protein aggregates array in such fashion that hollow cells were formed
between thin vertical walls. These cells were almost tubular in shape. The cell walls at this
pH (Figure 9) seem to be thin and flaky and the addition of inulin did not apparently alter the
structure. At pH 7, a similar structure to that formed at pH 2.5 was observed, but the cell
walls were thicker and much more interconnected. The addition of 0.5% inulin at pH 7
resulted in highly cross-linked network with significantly increased junction zones. Such
microstructure may explain strong oat protein-inulin gel mechanical properties comparable to
those of animal proteins.
We realized this unique gel structure might have specific gelling applications in a variety of
foods. This triggered our interest to further investigate the molecular mechanism by which
oat protein forms such structures. Also, we wanted to know better how small amounts of
inulin could greatly improve the gel properties at neutral pH, an environmental condition
highly convenient for food applications. So we further investigated the gels with experiments
using rheological measurements, Fourier transformed infrared spectroscopy and laser light
scattering to study the molecular events taking place during the gel formation.
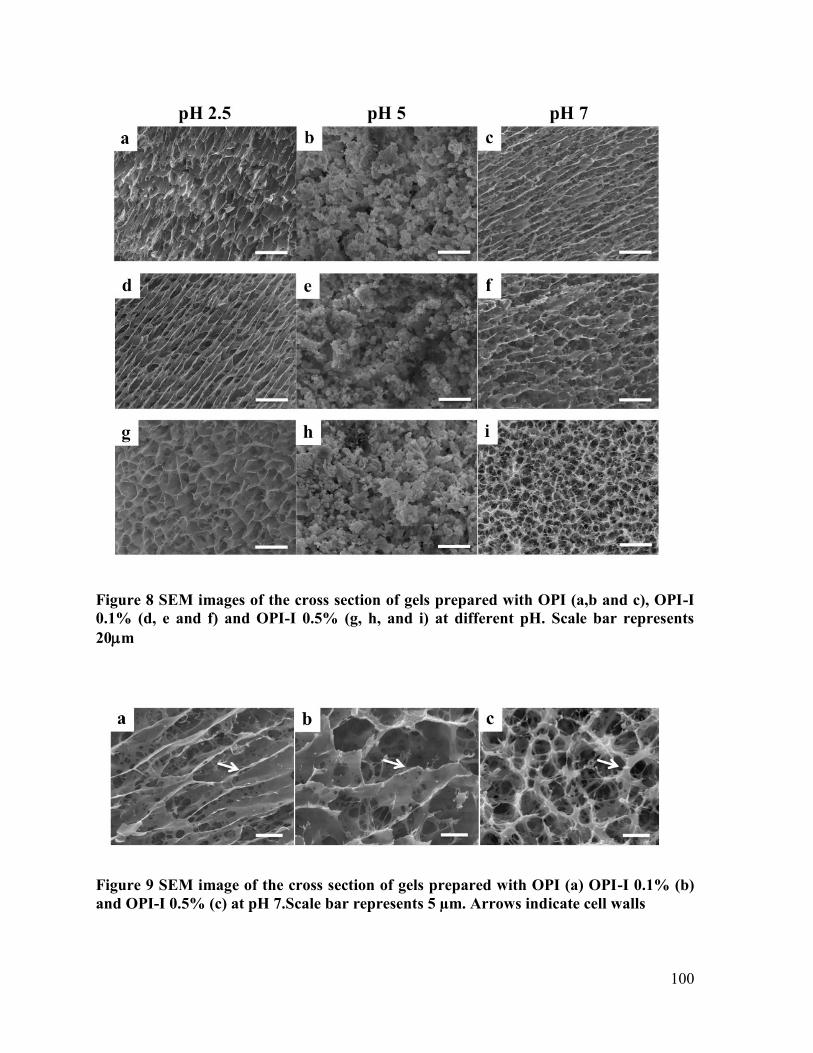
100
Figure 8 SEM images of the cross section of gels prepared with OPI (a,b and c), OPI-I
0.1% (d, e and f) and OPI-I 0.5% (g, h, and i) at different pH. Scale bar represents
20m
Figure 9 SEM image of the cross section of gels prepared with OPI (a) OPI-I 0.1% (b)
and OPI-I 0.5% (c) at pH 7.Scale bar represents 5 µm. Arrows indicate cell walls

101
4.3.4. Rheological measurements
To study the development of the gel network as a function of heating, a temperature ramp
was run for OPI and OPI-inulin suspensions with addition of 0.1 and 0.5 % inulin. Both G’
and G” were examined upon heating and cooling, however only G’ values are shown, as G”
were always lower than G’, even as a solution. This means that the elastic behavior
dominated the system. A similar phenomenon was observed for egg white, which showed
gel-like properties (G’>G’’) over the entire temperature range probed and even at low
temperature the native protein already forms a weak network that can propagate stress 269
. At
pH 7 (Figure 10a) the G’ value for OPI decreased at around 50˚C and a plateau was formed
until the temperature reached ~75˚C. This decrement could be attributed to weakened
hydrogen bonding 270
during heating. The sharp increase of G’ from ~70 to 95˚C indicates
that the formation of a rigid gel network occurred, as heat prompts protein unfolding,
exposing reactive groups of the molecule that enable the molecular interactions such as
hydrophobic interactions and disulfide bonds to reinforce the gel network 271
. It is clear, that
part of the development of the gel network also took place during the cooling stage because
G’ further increased during the cooling stage. Addition of small amount of inulin resulted in
great increase in G’, further confirming the synergistic effect between oat protein and inulin.
The addition of inulin also produced two phases in the development of the gel network.
According to previous reports 251,270
the first stage (~50˚C) is related to the development of
inulin network by molecular entanglement through hydrogen bonds and van der Waals forces
272, whereas the second stage (~70˚C) is related to the protein network development. This
result suggests phase separation during gel formation to form two networks, one rich in
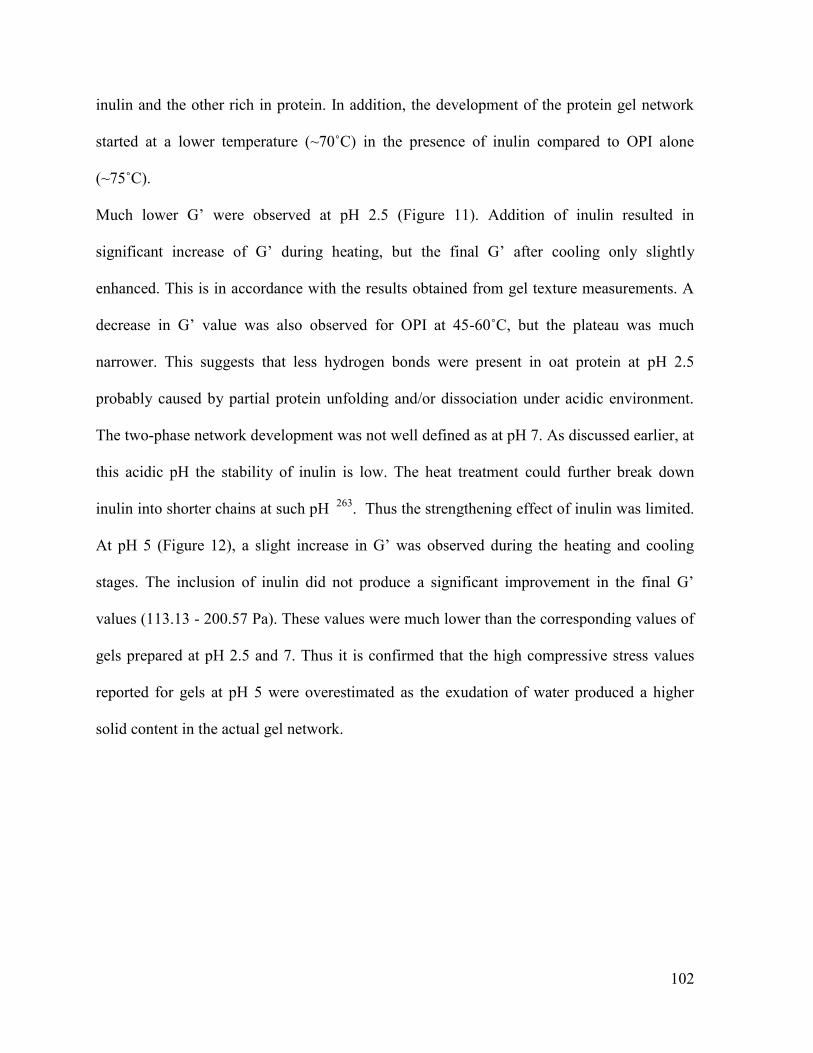
102
inulin and the other rich in protein. In addition, the development of the protein gel network
started at a lower temperature (~70˚C) in the presence of inulin compared to OPI alone
(~75˚C).
Much lower G’ were observed at pH 2.5 (Figure 11). Addition of inulin resulted in
significant increase of G’ during heating, but the final G’ after cooling only slightly
enhanced. This is in accordance with the results obtained from gel texture measurements. A
decrease in G’ value was also observed for OPI at 45-60˚C, but the plateau was much
narrower. This suggests that less hydrogen bonds were present in oat protein at pH 2.5
probably caused by partial protein unfolding and/or dissociation under acidic environment.
The two-phase network development was not well defined as at pH 7. As discussed earlier, at
this acidic pH the stability of inulin is low. The heat treatment could further break down
inulin into shorter chains at such pH 263
. Thus the strengthening effect of inulin was limited.
At pH 5 (Figure 12), a slight increase in G’ was observed during the heating and cooling
stages. The inclusion of inulin did not produce a significant improvement in the final G’
values (113.13 - 200.57 Pa). These values were much lower than the corresponding values of
gels prepared at pH 2.5 and 7. Thus it is confirmed that the high compressive stress values
reported for gels at pH 5 were overestimated as the exudation of water produced a higher
solid content in the actual gel network.
103
Figure 10 Storage modulus (G') of OPI and OPI-inulin mixtures (0.1 and 0.5%), during
heat-induced gelation at pH 7

104
Figure 11 Storage modulus (G') of OPI and OPI-inulin mixtures (o.1 and 0.5%), during
heat-induced gelation at pH 2.5

105
Figure 12 Storage modulus (G’) of OPI and OPI-inulin mixtures (0.1 and 0.5%), during
heat-induced gelation at pH 5
To determine the type of interactions involved in the gel network formation, a frequency
sweep test was conducted on gels treated with different dissociating reagents including urea
to interrupt hydrogen bonding, 2-ME to dissociate disulfide bonds and SDS to destroy

106
hydrophobic interactions. Figure 13 and 14 shows how G’ increased with increasing
frequency. Physical gels or gels with non-covalent linkages have been described as gels with
some frequency dependence 273
. A chemical gel, composed purely of covalent linkages,
would show a flat line indicating that neither low nor high frequency produces any alteration
in the bonds of the structure 274
. The behavior shown by OPI-Inulin gels indicates that G’ is
only affected at higher frequency, suggesting that the structure goes through a relaxation
process loosening the structure 275
.
The test on gels prepared at pH 2.5 was not performed as these gels swelled severely in the
presence of dissociating reagents, then ruptured, which did not permit an appropriate
measurement. This observation also confirms that the strength of the interactions formed at
pH 2.5 was inferior in comparison to those present in gels formed at pH 5 and 7. OPI gels
prepared at pH 7 were strongly affected by 2-ME, as the integrity of the gels was lost. This
indicates that disulfide bonds performed an essential role for gel formation. Gels in contact
with urea and SDS, showed similar response and in both cases G’ values were reduced
significantly, suggesting that hydrogen bonds and hydrophobic interactions also contributed
to the development of three-dimensional networks. In the case of OPI-I 0.5%, gels were
affected by 2-ME in the same way as the gels prepared with OPI alone. Thus, disulfide bonds
played an important role in the oat protein-inulin gel formation as well. In the presence of
urea and SDS, the gel structure was affected to a greater extent as a significant drop of G’
was observed. This indicates that addition of inulin strengthened hydrogen bonding and
hydrophobic interactions to further improve the gel network structure and mechanical
properties. At pH 5 there was not a significant contribution of disulfide bonds in gel
formation since the gel submerged in 2-ME showed similar trend compared to the control
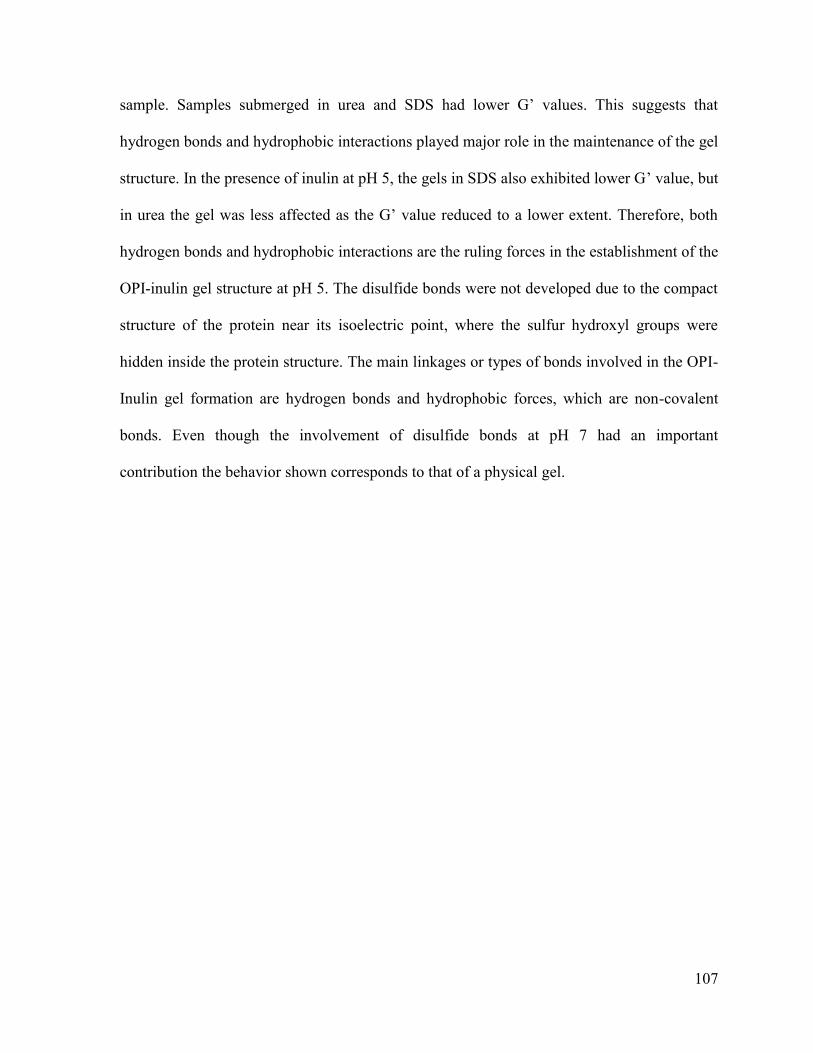
107
sample. Samples submerged in urea and SDS had lower G’ values. This suggests that
hydrogen bonds and hydrophobic interactions played major role in the maintenance of the gel
structure. In the presence of inulin at pH 5, the gels in SDS also exhibited lower G’ value, but
in urea the gel was less affected as the G’ value reduced to a lower extent. Therefore, both
hydrogen bonds and hydrophobic interactions are the ruling forces in the establishment of the
OPI-inulin gel structure at pH 5. The disulfide bonds were not developed due to the compact
structure of the protein near its isoelectric point, where the sulfur hydroxyl groups were
hidden inside the protein structure. The main linkages or types of bonds involved in the OPI-
Inulin gel formation are hydrogen bonds and hydrophobic forces, which are non-covalent
bonds. Even though the involvement of disulfide bonds at pH 7 had an important
contribution the behavior shown corresponds to that of a physical gel.

108
Figure 13 Storage modulus (G’) of OPI at pH 7 (a), pH 5 (b) as a function of angular
frequency

109
Figure 14 Storage modulus (G’) of OPI-I 0.5% at pH 7 (c) and pH 5 (d) as a function of
angular frequency

110
4.3.5. Confocal laser scanning microscopy (CSLM)
The microstructure of OPI and OPI-inulin gels was also observed with CSLM. Red color in
the photos corresponds to protein, whereas bright green regions indicate inulin. As shown in
Figure 15, OPI-inulin dispersions were homogeneous at pH 7 and room temperature. As
temperature increased the protein aggregates grew gradually, and around 60˚C phase
separation began. This suggests increased thermodynamic incompatibility of the oat protein
and inulin, probably due to the excluded volume effect when the protein started to unfold at
an elevated temperature 124
. From this temperature onward it was possible to see two phases,
in which the protein network formed a continuous phase with entrapped solid inulin particles
ranging in size from several hundreds nanometers to ~1μm. At higher inulin amount (0.5%),
early signs of phase separation were noted. The development of the protein network in the
presence of inulin was similar to that of protein alone, indicating that inulin did not interfere
with the development of the protein network; nonetheless it did reinforce the structure.
At pH 2.5 (Figure 16), much less inulin particles were observed through the heating stage as
well as in the final gels due to poor stability of inulin during heating under acidic conditions
263. Only a few reinforcement sections or junction zones were formed, explaining the limited
improvement observed in the reported compressive stress values. In the case of the gels
prepared at pH 5, larger aggregates with larger void spaces were formed (Figure 17). No
phase separation was seen, not even with increasing temperature. Apparently a protein
network composed of compact aggregates was formed and inulin was covered inside those
aggregates. Guggisberg et al. (2009) 259
evaluated the effect of inulin addition as a fat
replacer in yogurt and their CLSM images suggested that an inulin system could be built in
the protein network, as inulin was not visible by CSLM. The larger void spaces indicates

111
large pores, which led to the release of water from the network, a phenomenon consistent
with the low water holding capacity of the gels prepared at this pH.
Gels prepared at pH 7 showed promising application potential due to their excellent
mechanical strength and very unique structure. Samples prepared at this pH were selected to
further investigate the effect of inulin addition in the gel formation mechanism.
Figure 15 Confocal microscopic photographs of OPI and OPI-inulin (0.1 and 0.5%) at
pH 7 as a function of temperature. Scale bar represents 10 m
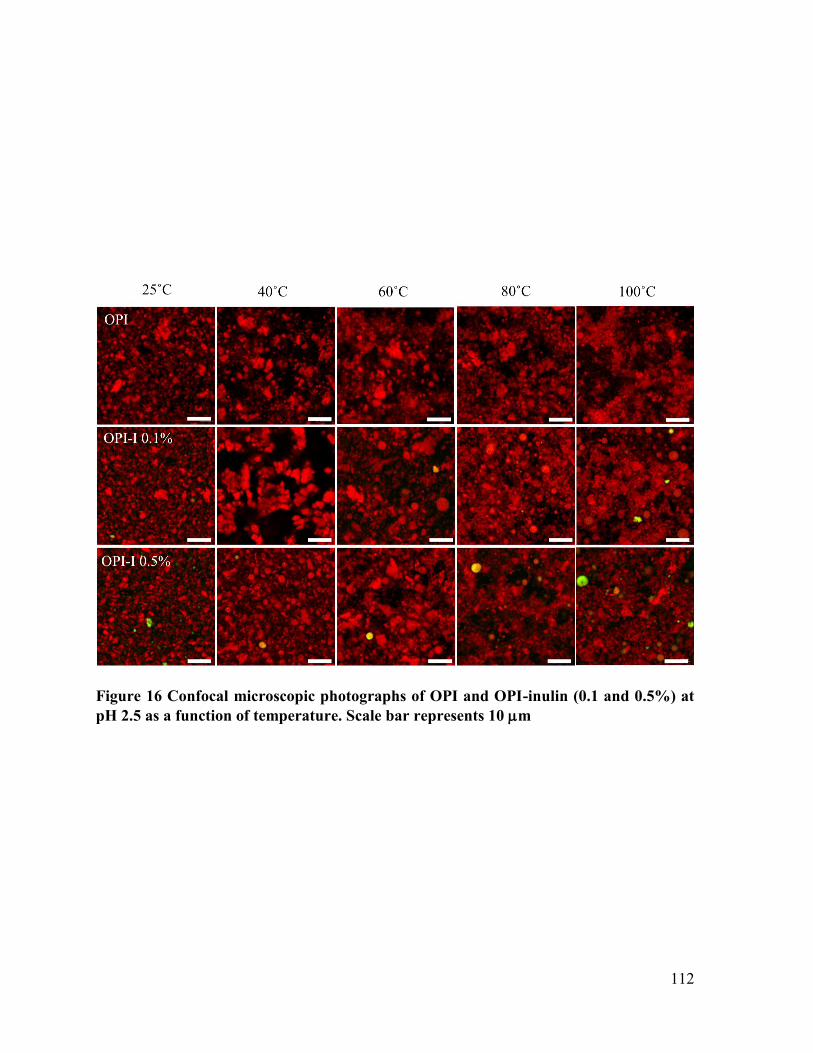
112
Figure 16 Confocal microscopic photographs of OPI and OPI-inulin (0.1 and 0.5%) at
pH 2.5 as a function of temperature. Scale bar represents 10 m
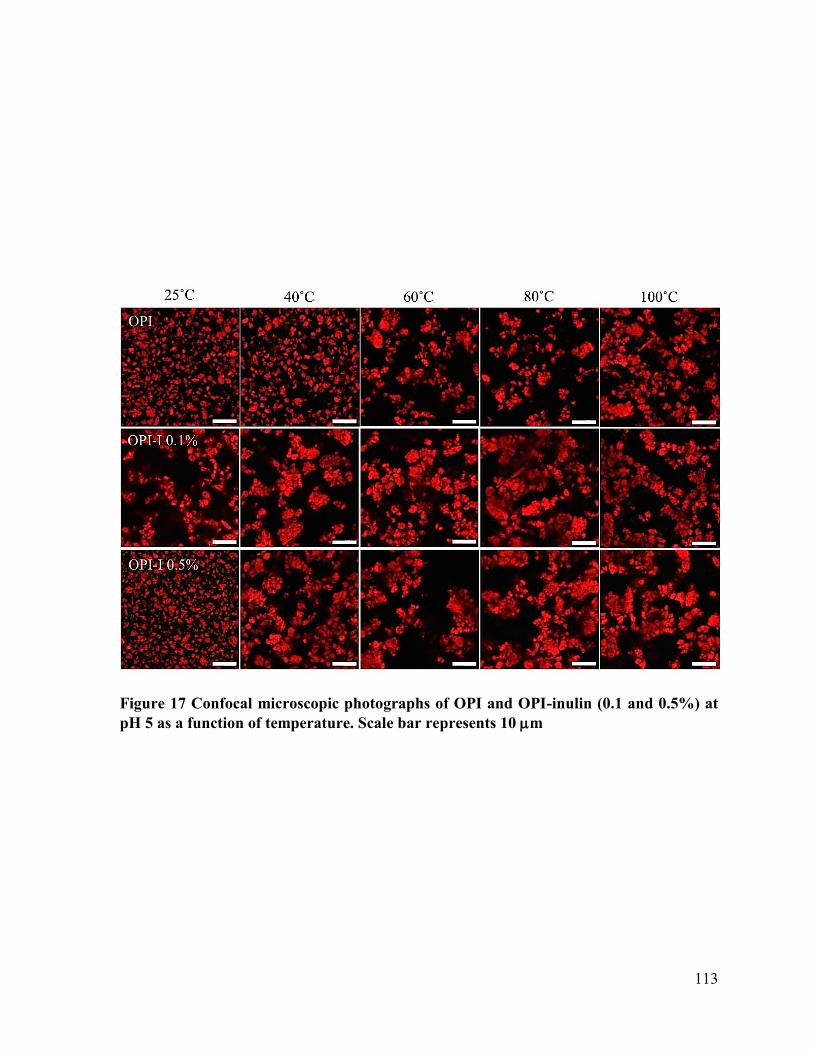
113
Figure 17 Confocal microscopic photographs of OPI and OPI-inulin (0.1 and 0.5%) at
pH 5 as a function of temperature. Scale bar represents 10 m

114
4.3.6. Protein size distribution
The change in the size distribution of protein molecules was studied as a function of heating
temperature. As shown in Figure 18 for OPI, Figure 19 for OPI-I 0.1% and Figure 20 for
OPI-I 0.5%, progressive reduction of the particle size occurred during heating with the same
trend for all samples, regardless of the inulin level added. At 100˚C the peak value (diameter)
detected for OPI was 10.1 nm, and 8.72 nm and 11.7 nm for OPI-I 0.1% and OPI-I 0.5%
respectively. According to previous literature, a diameter value of 11.8 nm was estimated for
oat globulin monomers with an extended conformation 276
. Thus the recorded peak values in
the current study suggest dissociation of oat protein hexamers down to monomers. The
thermal aggregation of oat globulin in previously study suggested oat globulin hexamers
dissociated first into trimmers and then into monomers that are highly reactive. These then
rapidly associate to larger and more stable molecules 276
. It is likely that the monomers
formed after the heating treatment, serve as building blocks in the establishment of the three-
dimensional network.

115
Figure 18 Number based particle size distribution of (a) OPI as a function of heating
temperature at pH 7

116
Figure 19 Number based particle size distribution of (b) OPI-I 0.1% as a function of
heating temperature at pH 7

117
Figure 20 Number based particle size distribution of (c) OPI-I 0.5% as a function of
heating temperature at pH 7

118
4.3.7. Fourier transform infrared (FTIR) spectroscopy
Figures 21, 22 and 23 show the de-convoluted spectra of OPI and OPI-I 0.1% and OPI-I
0.5% respectively, at different temperatures when pD was set at 7. For OPI, the amide I band
at 25˚C showed five clear components, including β-turn (1670 and 1658 cm-1
), α-helix (1649
cm-1
), random coil (1640 cm-1
), β-sheet (1630 cm-1
) and vibration of amino acid residues
(1609 cm-1
) 27,277
. This is in agreement with a previous report that α-helix and random coils
are the major secondary structures in oat globulin, followed by β-sheet and β-turn 277
. A small
peak was also observed at 1618 cm-1
, which was assigned to intermolecular β-sheet and is
believed to be related to protein aggregation via the exposed reactive groups. As temperature
increased from 25 to 80˚C, no major changes in the secondary structure were detected; this
could be related to the high heat stability of oat protein with a denaturation temperature of
112.4˚C as revealed by differential scanning calorimetry in our previous work 249
. The
absorption at 1690 (β-sheet), 1660 (β -turns) and 1619 cm-1
(intermolecular β-sheet)
increased gradually with temperature, suggesting more aggregates were formed via exposed
reactive sites. The amide I band was significantly altered when the OPI was heated to 100˚C.
In order to test whether the aggregation caused by the dry process impacted the protein
secondary structure, the dried gel powder formed at temperatures below 100˚C were tested.
The results indicated that the dried gels formed at these conditions had similar peaks with the
heated suspensions. Thus the protein secondary changes can be attributed to heating at
100˚C. The absorption at 1619 cm-1
disappeared, whereas a peak appeared at 1627 cm-1
. A
similar transition has been related to the dissociation of the dimeric form of β–lactoglobulin
into monomers 271
. This transition agrees with previous particle size results in which a
progressive reduction of the mean particle size was observed as function of temperature,
119
confirming the dissociation of oligomers down to the monomeric form. Increased absorption
intensity was observed at 1694, 1683, 1671 and 1659 cm-1
and two peaks appeared at 1649
and 1638 cm-1
. Such changes suggest partial protein unfolding during heating at 100˚C
followed by re-organization of protein secondary structure during gel formation 278
. Heating
of OPI-I 0.1% and 0.5% from 80 to 100˚C showed similar spectra as OPI alone. This further
supports the conclusion that addition of inulin did not significantly interfere or alter the
protein network construction.
Figure 21 Deconvoluted spectra of (a) OPI at pD 7, as a function of temperature

120
Figure 22 Deconvoluted spectra of (b) OPI-I 0.1% at pD 7, as a function of
temperature

121
Figure 23 Deconvoluted spectra of (c) OPI-I 0.5% at pD 7, as a function of
temperature.
122
4.3.8. Proposed formation mechanism of OPI-inulin gels at neutral pH
Based on fractal theory, protein particles form a fractal structure, ultimately leading to a gel
network built of fractal clusters. Three factors have been found relevant to the type of
structure formed: 1) the effective size of the building block of the fractal structure, 2) the
amount of protein incorporated in the fractal clusters at the moment of the gel is formed, and
3) the way in which the fractal clusters are linked together 33
. For globular proteins in
general (e.g. whey and soy protein), the formation of heat-induced gels involves unfolding of
the protein molecules by heating, leading to the exposure of active amino acid residues. This
is then followed by protein aggregation and dissociation of these aggregates to form either
filament or particulate gels depending on pH and ionic strength 27
. The unique percolating
network structure formed by oat protein gels at neutral pH is likely to be associated with
monomers as the predominant basic building blocks of the gel network. These smaller units
are highly reactive, which would allow the development of the protein gel network at a near
molecular level, resulting in development of strong interactions in oat protein gels with high
mechanical strength 276
. In addition, at pH 7, heat caused the dissociation of oat globulin
hexamers by breaking disulfide bonds linking the acidic and basic subunits. This allowed the
re-formation of disulfide bonds during the heating process. This disulfide bonds played major
role in gel formation, strengthening gel networks and their mechanical strength.
Addition of inulin led to formation of phase separated gels during heating processing. This
was expected, as it is highly unlikely for the OPI-inulin dispersions to establish electrostatic
interactions; the protein has a negative charge at pH 7, whereas inulin has no charge. In this
case protein-protein or inulin-inulin interactions require less energy than protein-inulin
interactions, thus the system separated into a protein-rich and an inulin-rich phase. In fact,
123
each polymer is excluded from a volume occupied by the other polymer; hence the effective
concentration of both polymers is increased 120
. In such way, higher intermolecular
interactions were developed in the oat protein network. Furthermore, the greatly improved
gel properties attributed to the addition of inulin in small amount can be explained by the
strengthening effect of inulin nanoparticles homogeneously distributed inside the protein
network. According to the rheological test, addition of inulin increased hydrogen bonding
and hydrophobic interactions to further improve the protein gels. Hydrophobic interactions
between inulin and other proteins such as casein 279
and β–lactoglobulin 280
have been
previously reported because inulin is able to form α-helix in solution 256
, which contains a
hydrophobic center. Also inulin is rich in hydroxyl groups that are able to take part in supra-
molecular interactions, in particular hydrogen bonding 281
. Thus, additional hydrogen bonds
and hydrophobic interactions can develop in the border between the continuous network and
discontinuous phase that work as a junction zones and provide extra support to the structure.
4.4. Conclusion
This work is the first to reveal unique percolating network structure for heat-induced oat
protein gels. Unlike many other globular proteins, which aggregate during heating, oat
protein dissociated from hexamers down to monomers. These small units are highly reactive
and allowed protein gel network development at a near molecular level. Addition of small
amount of inulin dramatically improved gel strength. In addition to the excluded volume
effect due to phase separation in the system, the inulin nano-particles contributed to the
formation of junction zones in which hydrogen bonds and hydrophobic forces were built at
the phase borders, leading to a highly crosslink gel network with a reinforced structure.

124
Protein and polysaccharides are often used in combination in the development of food
products. This research is critically important for future progress in the development of food
products including OPI-inulin mixtures. Novel products are now designed based on the
understanding of a growing consumer preference for natural and healthy foods, and oat
protein-derived ingredients show excellent potential to be well adopted by consumers. The
acceptance and utilization of oat and oat-inulin mixtures as value-added ingredients to
produce food products of different textures, could potentially contribute to the growth of the
food and agricultural industry. Also this research demonstrates the potential of oat protein as
an appropriate food gelling agent since the strongest gels were formed at neutral conditions;
in previous reports this was only achieved at alkaline conditions.

125
Chapter 5
5. Effect of different polysaccharides on phase separation during
thermal gelation of oat protein.
5.1. Introduction
Plant-based proteins are gaining importance as more consumers are changing their dietary
habits by incorporating more plant-based protein in their diets and in some cases, even full
replacement of animal protein sources by plant based sources is preferred. Currently soy and
wheat proteins dominate the plant protein market. Hence, as the plant-protein ingredient
sector grows, there is opportunity for novel protein sources to meet the increasing market
requirement for different functionalities and sensory attributes, such as oat. Our previous
work revealed that oat protein could form polymer like gels with percolating networks, which
may have specific gelling application in a variety of foods. Blends of proteins and
polysaccharides are applied to control or improve sensorial attributes in food products by
providing texture and water retention. Previous studies have demonstrated that gels with
different microstructure can be produced when proteins are mixed with polysaccharides.
Coacervate networks are one continuous network formed by favorable attractive interactions
between proteins and polysaccharides. Phase separated networks are formed when
interactions between protein and polysaccharide are repulsive resulting in a bi-continuous
phase. Interpenetrating networks are formed when no interactions are established between
polymers and each polymer forms an independent network 129
. The charge density of the
polysaccharide and environmental conditions such as pH and ionic strength have direct

126
influence on the gel structure and in consequence in the gelling properties 282
. By modulating
protein-polysaccharide interactions, a synergistic effect can be achieved in the binary gels
with improved properties. To date, most of the research has focus on the improvement of
gelling properties of dairy proteins in mixture with polysaccharides 134,283,284
and the research
efforts on plant protein based binary gels have included soy 264,285
, pea 286
and canola 287
protein. Yet the knowledge acquire is still limited.
The objective of this work is to systematically study how the presence of polysaccharide and
salt may impact the gelling properties and the microstructures of oat protein gels. Three
polysaccharides with different charges were selected including dextrin, carrageenan and
chitosan. Dextrin is a low molecular weight carbohydrate (~3 kDa) produced by partial acid
hydrolysis of starch, thus exhibiting the α-(1→4)-Glc structure of amylose and the α-(1→4)-
and α-(1→4,6)-Glc branched structure of amylopectin, but with lower polymerization 288,289
.
Carrageenan is a gel-forming polysaccharide derived from a number of seaweeds, it is a
sulfated polygalactan with 15 to 40% ester-sulfate content, which makes it and anionic
polysaccharide. It has an average relative molecular weight well above 100 kDa. It is formed
by alternate units of D-galactose and 3,6-anhydro-galactose (3,6-AG) joined by α-1,3 and β-
1,4-glycosidic linkage 290
. Chitosan is a linear-cationic polysaccharide derived from partial
N-deacetylation of chitin and is normally obtained from crustacean shells with the structure
α(1→4)-linked 2-amino-2deoxy-β-D- glucan 291
.
The impact of polysaccharide addition on gel microstructures, bulk properties including
mechanical strength and water holding capacity was evaluated at different pH and salt
concentrations. The oat protein gel formation mechanism in the presence of polysaccharide
was discussed with especial emphasis on phase-separated networks.

127
5.2. Materials and methods
5.2.1. Materials
Naked oat grains (Avena nuda) were purchased from Wedge Farms Ltd., Manitoba, Canada.
The protein content was 16.6% ± 0.64 as determined by Leco nitrogen analyzer (FP-428,
Leco Corporation, St Joseph, MI) using a protein calculation factor of 6.25. Oat protein
isolate (OP) was extracted according to our previous work 249
and the protein content was
determined to be 89.57 % ± 0.73 using the same Leco nitrogen analyzer. Urea, 2-
mercaptoethanol, sodium dodecyl sulfate, Rhodamine B, carrageenan and chitosan from
shrimp shells were obtained from Sigma-Aldrich Canada (Oakville, ON, Canada). Food
grade dextrin Capsul 2730 was obtained from Ingredion Canada Inc. (Mississagua, ON,
Canada)
5.2.2. Gel preparation
Dextrin, chitosan and carrageenan were selected in this study, representing a neutral, cationic
and anionic polysaccharide respectively. Gels were prepared by heating the protein-
polysaccharide suspensions at pH 3, 4 and 7 adjusted with 0.1 N NaOH or HCl, in the
presence of 0, 50, 150 and 300 mM NaCl. The concentration of OP in the mixtures was kept
constant at 15% (w/v) and the concentration of polysaccharide was 0.5% (w/v). These values
were determined based on preliminary trials, which allowed gel formation. Samples were
labeled as OP, OP-DE, OP-CH and OP-CA, representing gels containing oat protein, oat
protein-dextrin, oat protein-chitosan and oat protein–carrageenan respectively. Test tubes
containing the suspension were tightly closed and placed in an oil bath at 110˚C for 30 min.

128
Once the heat treatment was completed, the tubes were cooled in an ice bath and stored in the
refrigerator overnight.
5.2.3. Gel properties
The mechanical properties of the gels were evaluated using an Instron 5967 universal testing
machine (Instron Corp., Norwood, MA, USA). Gels were dismounted from test tubes and cut
into cylindrical pieces (∼10 mm height and ∼14 mm diameter). A two cycle compression test
using a 50 N load cell was performed at room temperature at a rate of 1 mm/min and 50%
compression to evaluate their mechanical properties. The textural profile parameters were
determined from the typical Instron force-time curve in which compressive stress was
calculated as the peak compression force in the 1st bite cycle, divided by the initial cross-
section area of the gel sample, and cohesiveness is the ratio of the area under the first and
second compression peaks.
Additionally the water holding capacity (WHC) of the gels prepared was evaluated. For this a
gel sample (0.9 – 1.2 g) was placed into a Vivaspin 20 centrifugal filter unit (GE Healthcare
Bio-Sciences AB, Uppsala, Sweden) and centrifuged at 453 × g for 10 min at room
temperature. The weight of the gel was recorded before (Wi) and after (Wf) centrifugation to
the nearest 0.0001 mg and the percentage of water loss after centrifugation was expressed as:
((
) )
5.2.4. Scanning electron microscopy (SEM)
The morphology observation of the gels was carried out with a Phillips XL-30 scanning
electron microscope (FEI Company, Oregon, USA) at an acceleration voltage of 20 kV. The
samples were frozen in liquid nitrogen and freeze-dried before observations. The cross-
129
section and surfaces of the dry gels were sputtered with gold and platinum, observed and
photographed.
5.2.5. Rheological measurements
The rheological measurements were done with a TA Discovery HR-3 rheometer (TA
instruments, New Castle, DE, USA). To evaluate the molecular interactions involved in the
formation of OP and OP-polysaccharide gels, a frequency sweep analysis was conducted.
Gels were prepared as previously described in the gel preparation section at pH 3 and 7 and
cut into approximately 1 cm (height) sections. The resulting gel disk were submerged for 48
h in solutions of 2-mercapthoethanol (2-ME) (0.2 M), urea (6 M) and sodium dodecyl sulfate
(SDS) (1% w/v), which could disrupt disulfide bonds, hydrogen bonds and hydrophobic
interactions respectively. A frequency sweep test was done to evaluate the dependence of G’
to frequency (0.1 – 100 rad/s) on gels compressed to 80% of its original height. To study the
changes in viscoelastic properties as a function of temperature, OP and OP-polysaccharide
suspensions were subject to a temperature ramp from 25 to 95˚C, hold at 95˚C for 5 min, and
then cooled down to 25˚C at a rate of 1.5˚C/min. Sample conditioning took place before and
after each temperature ramp for a period of 3 min. For these measurements, approximately 1
mL sample was loaded in the bottom plate of the parallel plate geometry; the upper plate was
lower to the appropriate geometry gap. To avoid evaporation during heating a solvent trap
was used and a thin layer of silicone oil was applied. The temperature of the bottom plate
was controlled with a Peltier system. All rheological measurements were done within a
predetermined linear viscoelastic region, which was determined in preliminary experiments,
setting the strain value at 0.05%.
130
5.2.6. Turbidity and Particle size measurements
Protein aggregation was followed by measuring the turbidity of samples before and after
heating (110˚C, 30 min). Changes in turbidity at 600 nm were recorded at a protein
concentration of 0.1% at pH 3 and 7 with 0 and 50 mM NaCl on a Jasco V-530 UV/VIS
spectrophotometer (Jasco Corporation, CA, USA). The absorbance was measured using
quartz cuvettes with a 10 mm path length.
A Zetasizer Nano ZS ZEN1600 system (Malvern Instruments, U.K.) was used to study the
change of particle size distribution caused by heating treatment (110˚C for 30 min). Samples
were immediately cooled in an ice bath to room temperature, after completing the heating
period. Samples were then diluted to a total concentration of 0.1% (w/v) and passed through
a 0.45 μm pore size filter prior to measurement. Number-based particle size distribution was
measured to identify the total number of particles of a given size 261
.
5.2.7. Surface Hydrophobicity (Ho)
Protein surface Hydrophobicity was determined using the apolar fluorescent dye, ANS 292
.
Protein and protein-polysaccharide suspensions (1% w/v) were prepared and heated for 30
min at 110˚C followed by cooling. Samples were diluted in phosphate buffer to obtain five
final concentrations ranging from 0.002 to 0.020% (w/v). 20 μL of ANS solution (8.0 mM in
0.1 M phosphate buffer, pH 7) were added to 4 mL sample. The relative fluorescence
intensity (RFI) was determined using a Fluorescence spectrophotometer Sprectramax M3
(Molecular devices, CA, USA) set at 390 and 470 as excitation and emission wavelengths,
respectively, with a constant excitation and emission slit of 5 nm. The initial slope of the RFI
versus protein concentration plot was calculated by linear regression analysis and used as an
index of Ho.
131
5.2.8. Fourier transform infrared (FTIR) spectroscopy
In order to detect changes in the protein conformation caused by addition of polysaccharide.
Gel samples were prepared as previously described and freeze-dried. The dried gel was crush
into powder, vacuum–dried at 40˚C overnight and mixed with KBr powder (1:100 w/w). The
mixtures were compressed to 13 mm discs and used for spectroscopy measurements. To
study the amide I region of the protein (1700-1600 cm-1
), Fourier self-deconvolutions were
performed using the software provided with the spectrometer (Omnic 8.1.210 software).
Each spectrum was the result of 128 scans; band narrowing was achieved with a full width at
half maximum of 20-25 cm-1
and with resolution enhancement factor of 2.0-2.5 cm-1
. During
measurements Nitrogen was continuously run through the spectrometer.
5.2.9. Confocal laser scanning microscopy (CSLM)
CSLM was used to observe the distribution of the polysaccharide within the protein network.
A laser scanning confocal microscope Zeiss LSM710 (Carl Zeiss Microscopy, Jena,
Germany) was used with a 10 × objective. Dextrin and carrageenan were labeled covalently
with FITC. Specifically, 0.5 g of the polysaccharide and 10mL of DMSO were stirred
overnight, and then 7mg of FITC were added to the polysaccharide-DMSO mixture. The
reaction mixture was protected from the light, heated at 90˚C for 2 hours and dialyzed
extensively against distilled water in the dark and freeze-dried. Rhodamine B was used for
non-covalent labeling of oat protein. A 15% protein suspension was prepared, and 40μL of
Rhodamine B (5mg/mL) were added to 1 mL of protein suspension. The mixture was stirred
for 2 h at room temperature, dialyzed against distilled water in the dark and freeze-dried.
Once protein and polysaccharide were labeled, OP-polysaccharide suspensions were
prepared as described previously in the gel preparation section. A thin slice of gel was cut
132
with scalpel and place in a slide. The fluorescent images were analyzed at wavelength of 488
nm and 516 nm. Images were processed with ZEN 2009 LE software (Carl Zeiss AG,
Oberkochen, Germany).
5.2.10. Statistical analysis
The results were evaluated by analysis of variance (ANOVA) and significant differences,
with minimum significance test set at the 5% level (p < 0.05) with Tukey's test to compare all
means, using GraphPad Prism 5 (GraphPad Software, La Jolla, CA, USA). All experiments
were performed at least in three independent trials and the results were reported as
mean ± standard deviation.
5.3. Results and discussion
5.3.1. Effect of polysaccharide
Figure 24 shows the microstructure of oat protein gels in the presence of polysaccharides at
pH 3 and 7. Normally, globular proteins form fine stranded gels at pH values that diverge
from the isoelectric point (pI) and with low ionic strength. Nevertheless, SEM images of oat
protein derived gels showed a percolating network structure similar to that observed in
polymer gels. It has been proposed that as a result of heating, oat globulin hexamers
dissociated first into trimmers and then into monomers that are highly reactive 276
. The
monomers were also unfolded during heating, thus a nearer side by side array of the
polypeptide chains took place, which promotes intermolecular interactions and consequently
strong percolating networks were formed 27
. At pH 3, the oat protein gels prepared with
dextrin and chitosan (OP-DE and OP-CH) (Figure 24 A and E) show networks that consisted
of hollow cells formed between vertical walls. The cells appeared to be interconnected in
133
OP-DE gels, whereas long walls forming large and empty compartments were observed in
OP-CH gels. In contrast gels prepared with carrageenan (OP-CA) (Figure 24 C) show a
condensed and compact structure with flaky appearance. At pH 7, gels with thick walls and
highly interconnected percolating networks were formed by OP-DE and OP-CA (Figure 24 B
and D). Whereas, a particulate structure was observed for OP-CH (Figure 24 F) with
spherical aggregates distributed among the gel network. To explain the effect that the type of
polysaccharide has upon the gelling properties of oat protein, it is necessary to consider the
type of interactions involved in the system. Using protein and anionic polysaccharide as an
example, at pH > pI, repulsion exists between protein and polysaccharide; at pH < pI,
electrostatic attraction exists between protein and polysaccharide, resulting in the formation
of coacervates. Coacervate networks are one continuous network formed by favorable
attractive interactions between proteins and polysaccharides. Phase-separated networks are
formed when interactions between protein and polysaccharide are repulsive, resulting in a bi-
continuous phase. Oat protein has a pI of ~5 223,293
, thus OP-CH at pH 3 and OP-CA at pH 7
were likely to form phase separated networks due to repulsive interactions between protein
and polysaccharide. However, no clear phase separation could be defined from the SEM
photos, probably due to the fact that only small amount of polysaccharide was added in the
system. Thus the observed changes in microstructure could be related to the effect that the
polysaccharide has on protein gel network formation. The balance between attractive and
repulsive forces is useful to explain why gel networks prepared at pH 3 seemed to be less
interconnected than those prepared at pH 7. Previous research suggested that the optimum
balance in the case of oat protein is reached at pH 5-7, whereas at a higher or lower pH,
disproportionate electrostatic repulsive forces may work as an obstacle warding off protein

134
molecules from crosslinking and forming a strong structure 249
. At pH 7 it is expected that the
repulsive forces involved in the system are counterbalanced by other type of attractive
interactions, for instance hydrophobic forces that facilitate the intermolecular crosslinking,
which produces a more interconnected structure and also provides higher mechanical
strength to the gels. The strong repulsion caused by an increased charge, has direct influence
on the number as well as the type of interactions taking place.
Figure 24 SEM images of the cross section of oat protein gels prepared at 110˚C without
salt. Scale bar represents 5 μm. A and B correspond to OP-DE gels prepared at pH 3
and 7 respectively. C and D corespond to OP-CA gels prepared at pH 3 and 7
respectively. E and F correspond to OP-CH gels prepared at pH 3 and 7 respectively.
Under conditions that promote associative interactions, such as in the case of OP-CA system
at pH 3 and OP-CH system at pH 7, electrostatic attractive forces are expected. These
135
attractive forces could restrict protein unfolding and promoted protein random aggregation,
leading to the formation of particulate networks with flaky appearance. The gels prepared
with dextrin (OP-DE) showed similar microstructure as that made of oat protein alone at both
pH 3 and 7. Dextrin being a neutral polysaccharide is not expected to produce any significant
change in the surface charge of protein molecular chains thus could be present as a co-solute.
Nevertheless, a phase-separated network could still be formed due to the thermodynamic
incompatibility between dextrin and oat protein during heating. In our previous work, oat
protein-inulin gels with micro phase separated structure were formed 294
. It was speculated
that during heating, the protein started to unfold, increasing the thermodynamic
incompatibility between oat protein and inulin due to the excluded volume effect 124
, thus the
system separated into a protein-rich and a inulin-rich phase 124
. At pH 4, particulate gels were
observed for oat protein alone and in combination with polysaccharides (SEM images not
shown). When pH was near to the pI, the low net charge on protein molecular chains
promoted random association of protein aggregates into large and spherical aggregates linked
together to form the gel network.
Figure 25 shows the mechanical properties and water holding capacity (WHC) of oat protein
gels in the presence of different polysaccharides. Compressive stress indicates the capacity of
the material to withstand a given deformation. At pH 3, oat protein had a compressive stress
value of 2.99 kPa. This value increased to 4.07 and 3.61 kPa in the presence of dextrin and
carrageenan respectively. The compressive stress decreased to 2.66 kPa with addition of
chitosan. At pH 7, addition of carrageenan significantly increased (p<0.05) the compressive
stress value of oat protein gels from 13.21 to 25.95 kPa. The gel strength was also improved
(16.87 kPa) with addition of dextrin but decreased in the presence of chitosan (11.61 kPa).
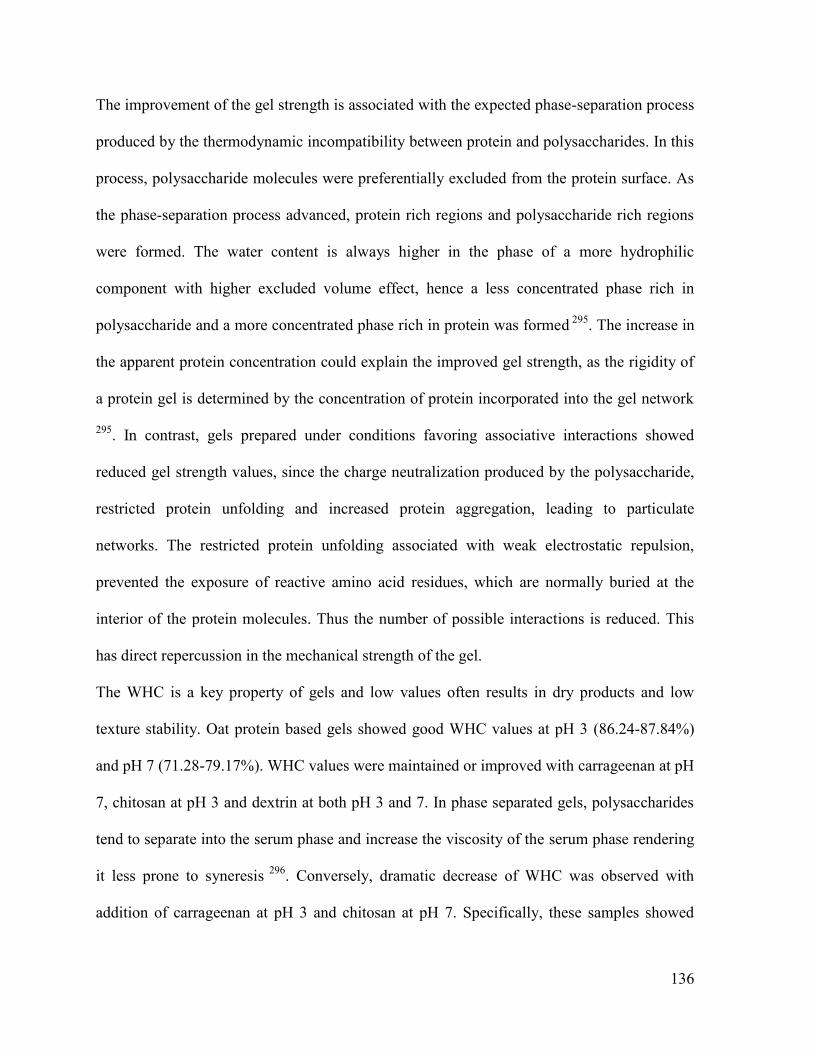
136
The improvement of the gel strength is associated with the expected phase-separation process
produced by the thermodynamic incompatibility between protein and polysaccharides. In this
process, polysaccharide molecules were preferentially excluded from the protein surface. As
the phase-separation process advanced, protein rich regions and polysaccharide rich regions
were formed. The water content is always higher in the phase of a more hydrophilic
component with higher excluded volume effect, hence a less concentrated phase rich in
polysaccharide and a more concentrated phase rich in protein was formed 295
. The increase in
the apparent protein concentration could explain the improved gel strength, as the rigidity of
a protein gel is determined by the concentration of protein incorporated into the gel network
295. In contrast, gels prepared under conditions favoring associative interactions showed
reduced gel strength values, since the charge neutralization produced by the polysaccharide,
restricted protein unfolding and increased protein aggregation, leading to particulate
networks. The restricted protein unfolding associated with weak electrostatic repulsion,
prevented the exposure of reactive amino acid residues, which are normally buried at the
interior of the protein molecules. Thus the number of possible interactions is reduced. This
has direct repercussion in the mechanical strength of the gel.
The WHC is a key property of gels and low values often results in dry products and low
texture stability. Oat protein based gels showed good WHC values at pH 3 (86.24-87.84%)
and pH 7 (71.28-79.17%). WHC values were maintained or improved with carrageenan at pH
7, chitosan at pH 3 and dextrin at both pH 3 and 7. In phase separated gels, polysaccharides
tend to separate into the serum phase and increase the viscosity of the serum phase rendering
it less prone to syneresis 296
. Conversely, dramatic decrease of WHC was observed with
addition of carrageenan at pH 3 and chitosan at pH 7. Specifically, these samples showed
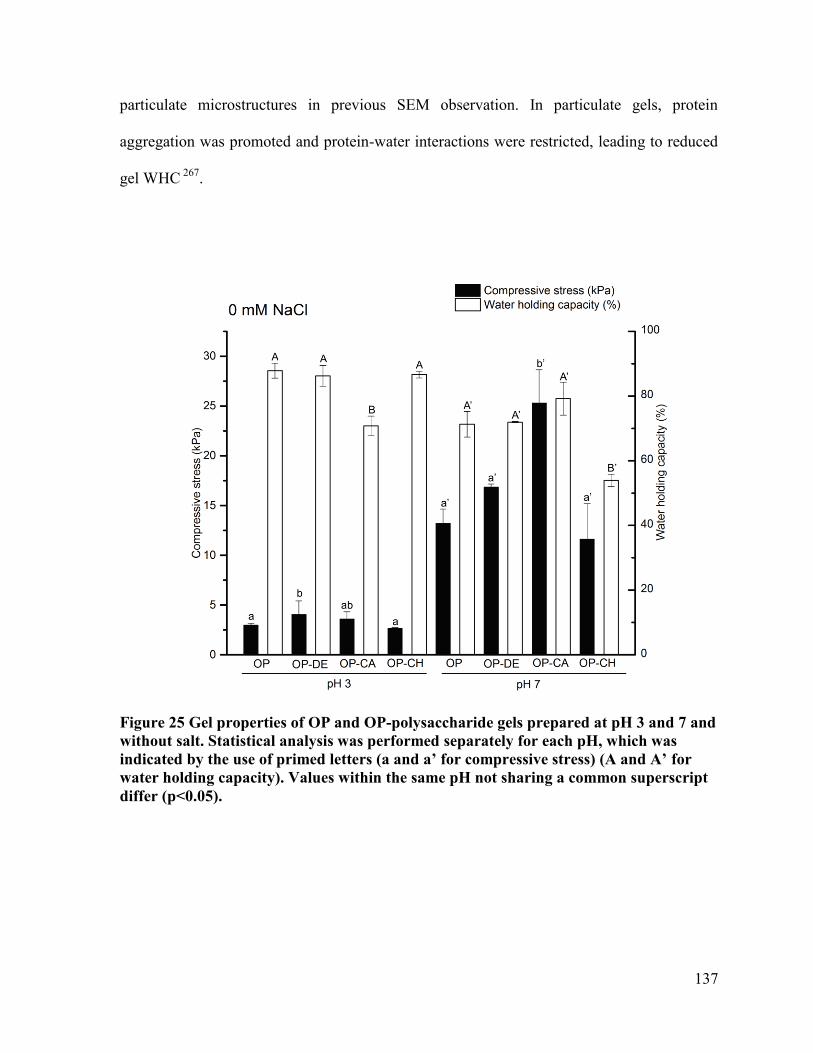
137
particulate microstructures in previous SEM observation. In particulate gels, protein
aggregation was promoted and protein-water interactions were restricted, leading to reduced
gel WHC 267
.
Figure 25 Gel properties of OP and OP-polysaccharide gels prepared at pH 3 and 7 and
without salt. Statistical analysis was performed separately for each pH, which was
indicated by the use of primed letters (a and a’ for compressive stress) (A and A’ for
water holding capacity). Values within the same pH not sharing a common superscript
differ (p<0.05).

138
5.3.2. Effect of salt
Salt is an important food ingredient and salt concentration is a process parameter that is often
adjusted in the development of new food products. For this reason, this investigation will
provide information on the effect of salt on the gelling properties of the protein-
polysaccharide blends. It is known that the presence of salt can suppress electrostatic
interactions 88
, as salt has a shielding effect on the surface charges, which reduces the
repulsive forces between protein molecules and between protein and polysaccharide.
Addition of salt can promote the random association of protein aggregates. Nevertheless, at
pH 3, such change was not evident for OP-DE and OP-CH gels (Figure 26 A and E) as SEM
images show similar microstructure to those formed without salt. These two systems have a
high positive surface charge, especially in the presence of chitosan, thus addition of salt at a
low concentration (50 mM NaCl) was not enough to suppress electrostatic repulsive forces.
In contrast, the gel structure formed at pH 3 with carrageenan in the presence of 50 mM NaCl
resulted in particulate gels (Figure 3 C). Since carrageenan neutralized the charge on oat
protein molecular chains, a small amount of salt could suppress the remaining electrostatic
repulsive forces, inducing formation of spherical aggregates. As it was previously mentioned,
the balance between attractive and repulsive forces could be reached at pH 7 249
to form
strong percolating networks in oat protein gels, however the shielding effect of salt disturbed
such balance, therefore the addition of salt induced formation of particulate gels in the
presence of dextrin and chitosan at this pH (Figure 26 B and F). The network formed by OP-
CA (Figure 26 D) was less affected by salt at pH 7 as the morphological differences between
the OP-CA images with and without salt are negligible due to high charge in the system.
Increasing the salt content from 50 mM to 150 mM intensified the appearance of spherical
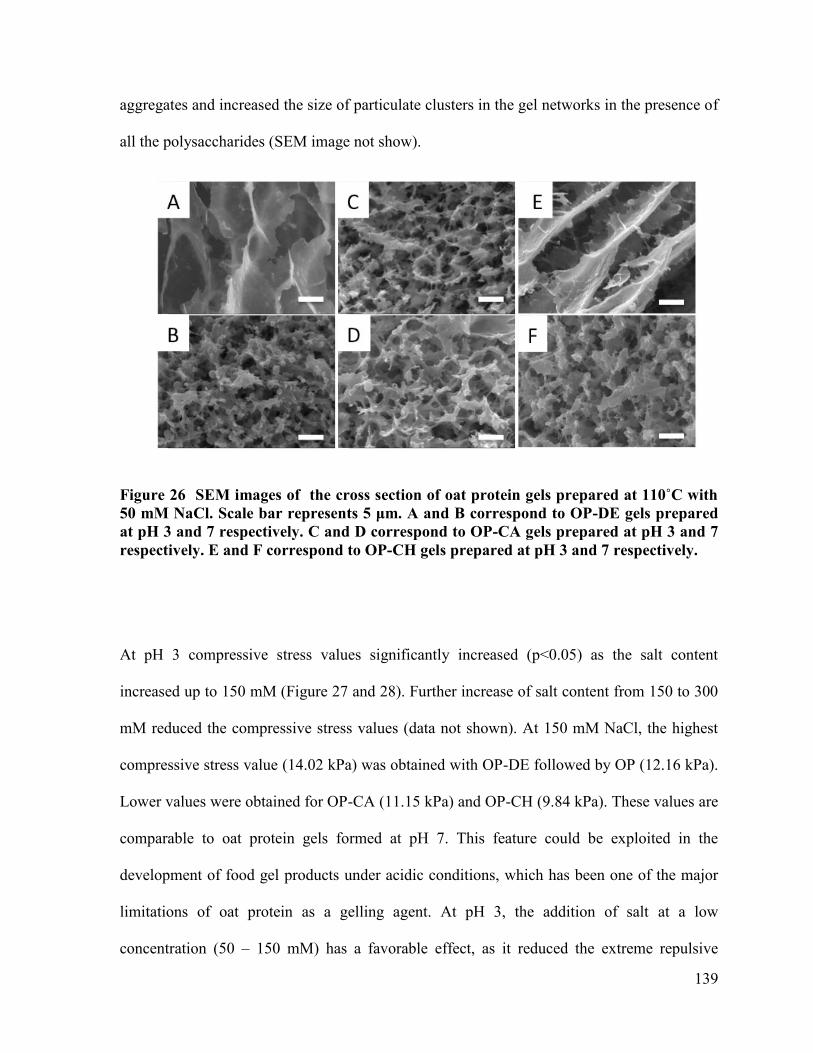
139
aggregates and increased the size of particulate clusters in the gel networks in the presence of
all the polysaccharides (SEM image not show).
Figure 26 SEM images of the cross section of oat protein gels prepared at 110˚C with
50 mM NaCl. Scale bar represents 5 μm. A and B correspond to OP-DE gels prepared
at pH 3 and 7 respectively. C and D correspond to OP-CA gels prepared at pH 3 and 7
respectively. E and F correspond to OP-CH gels prepared at pH 3 and 7 respectively.
At pH 3 compressive stress values significantly increased (p<0.05) as the salt content
increased up to 150 mM (Figure 27 and 28). Further increase of salt content from 150 to 300
mM reduced the compressive stress values (data not shown). At 150 mM NaCl, the highest
compressive stress value (14.02 kPa) was obtained with OP-DE followed by OP (12.16 kPa).
Lower values were obtained for OP-CA (11.15 kPa) and OP-CH (9.84 kPa). These values are
comparable to oat protein gels formed at pH 7. This feature could be exploited in the
development of food gel products under acidic conditions, which has been one of the major
limitations of oat protein as a gelling agent. At pH 3, the addition of salt at a low
concentration (50 – 150 mM) has a favorable effect, as it reduced the extreme repulsive
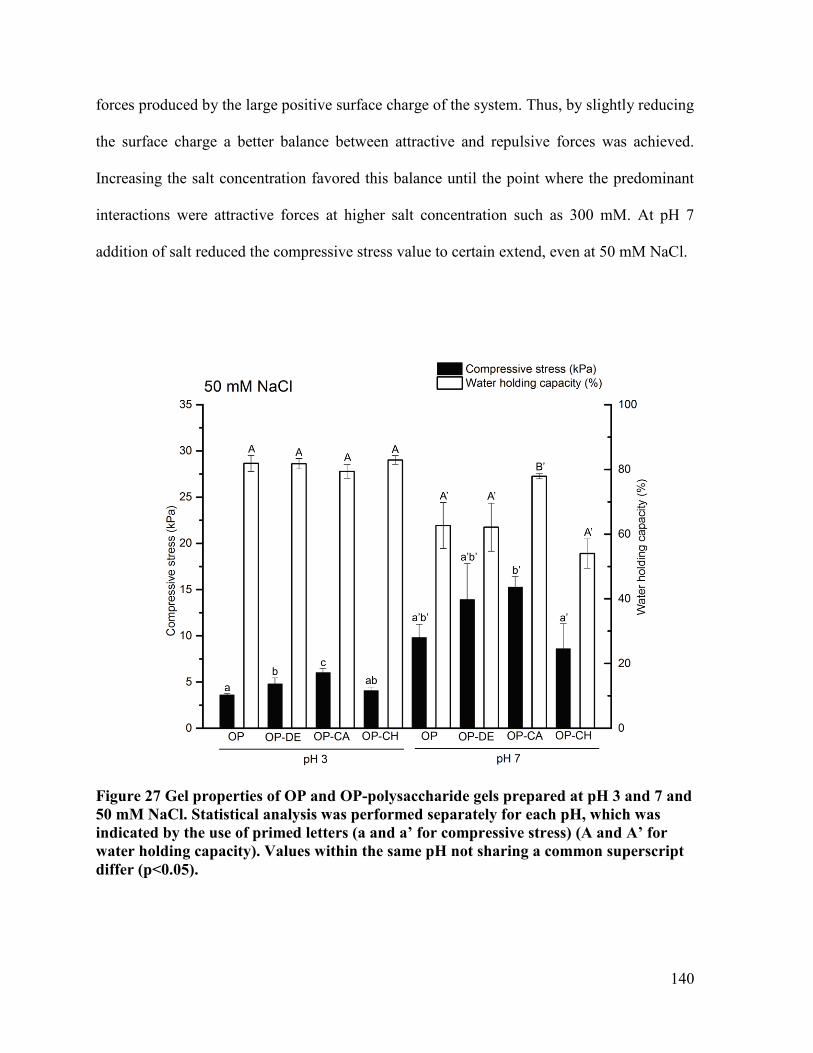
140
forces produced by the large positive surface charge of the system. Thus, by slightly reducing
the surface charge a better balance between attractive and repulsive forces was achieved.
Increasing the salt concentration favored this balance until the point where the predominant
interactions were attractive forces at higher salt concentration such as 300 mM. At pH 7
addition of salt reduced the compressive stress value to certain extend, even at 50 mM NaCl.
Figure 27 Gel properties of OP and OP-polysaccharide gels prepared at pH 3 and 7 and
50 mM NaCl. Statistical analysis was performed separately for each pH, which was
indicated by the use of primed letters (a and a’ for compressive stress) (A and A’ for
water holding capacity). Values within the same pH not sharing a common superscript
differ (p<0.05).
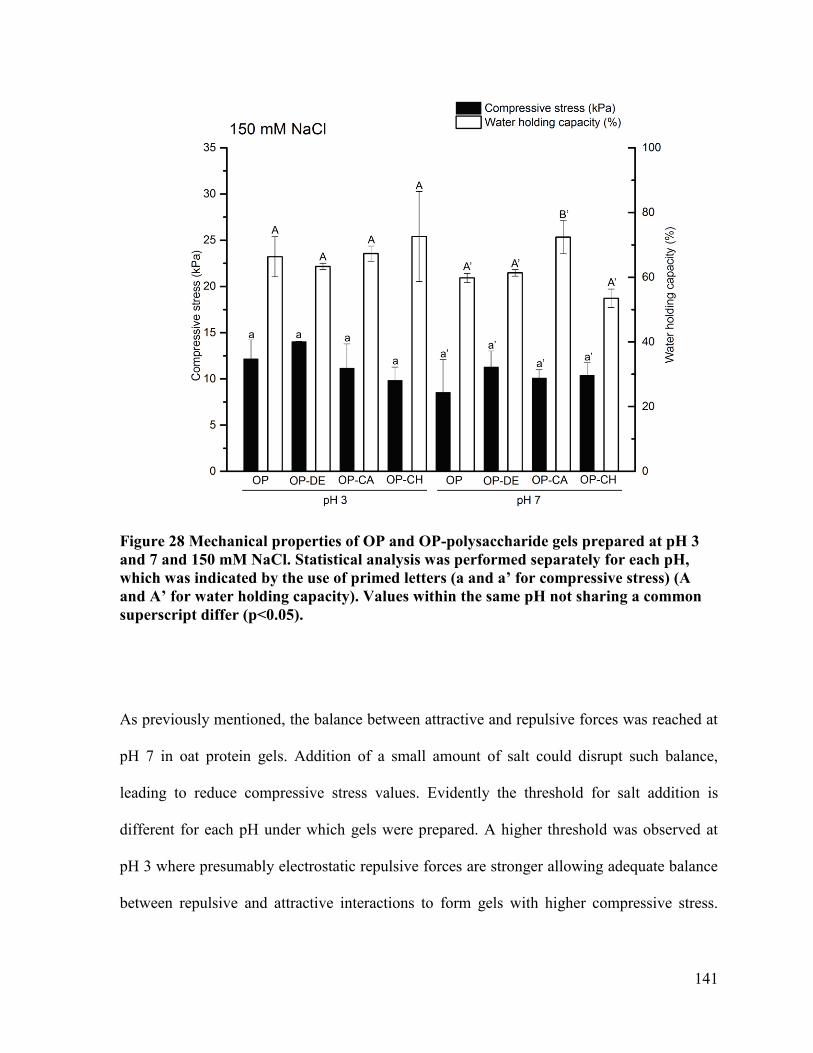
141
Figure 28 Mechanical properties of OP and OP-polysaccharide gels prepared at pH 3
and 7 and 150 mM NaCl. Statistical analysis was performed separately for each pH,
which was indicated by the use of primed letters (a and a’ for compressive stress) (A
and A’ for water holding capacity). Values within the same pH not sharing a common
superscript differ (p<0.05).
As previously mentioned, the balance between attractive and repulsive forces was reached at
pH 7 in oat protein gels. Addition of a small amount of salt could disrupt such balance,
leading to reduce compressive stress values. Evidently the threshold for salt addition is
different for each pH under which gels were prepared. A higher threshold was observed at
pH 3 where presumably electrostatic repulsive forces are stronger allowing adequate balance
between repulsive and attractive interactions to form gels with higher compressive stress.
142
This threshold was lower at pH 7 as a small amount of salt led to significant reduction of the
gel strength.
Increasing salt content also caused the WHC to decrease. At pH 3 the WHC diminished to
values ranging from 61.22 to 58.43% when the salt concentration was as high as 300 mM
NaCl (data not shown). Increasing salt concentration caused a progressive transition into a
particulate gel network 267
. Interestingly, WHC values of OP-CH gels were less impacted by
salt, showing values of 82.90 and 72.59% as salt content increased from with 50 to 150 mM
(Figure 27 and 28). OP-DE gels, also maintained a high WHC (81.78%) at 50 mM. This is in
accordance with the previous observation that the OP-CH and OP-DE gels did not undergo
significant changes due to the fact that salt at a low concentration (50 mM NaCl) was not
enough to suppress the electrostatic repulsive forces in oat protein networks. At pH 7, even
low salt concentrations (50 mM) had a detrimental effect on the WHC of the gels.
Nevertheless, gels prepared with OP-CA did not show any significant change (p<0.05) as the
salt content increased. This is also in agreement with the inspection of the gel morphology at
pH 7 with 50 mM NaCl, where the formation of spherical aggregates was less evident on OP-
CA compared to OP-DE and OP-CH.
The improvement of the gelling properties by blending with polysaccharides is highly related
to the type of interactions that are promoted in the system. Thus gelling properties were
strengthened without compromising the WHC, when gels where prepared under conditions
that favored segregative interactions. In contrast, gels formed under associative interactions,
showed reduced WHC values and reduced gel strength. A similar observation was done in a
whey protein-xanthan gum system 50
. In this case, xanthan gum had a synergistic effect when
gels were prepared under conditions that favored segregative phase separation and an

143
antagonistic effect when gels were prepare under conditions that promoted attractive
interactions, resulting in the protein-polysaccharide complex formation 50
.
The effect of salt could also be synergistic or antagonistic depending on prevalent conditions
in the system. In some instances and even though salt is known to induce the formation of
particulate gels, addition of salt can be advantageous in the interest of regulating the balance
between repulsive and attractive interaction. Whenever salt addition takes the system out of
this balance, salt exerts a deteriorating effect on the strength and in the WHC of the gels.
Carrageenan had a strong synergistic effect on oat protein gelling properties at pH 7, as the
compressive stress was almost doubled. Additionally OP-CA gels at neutral pH showed high
WHC even in the presence of salt. Addition of dextrin slightly improved the gel strength at
both acidic and neutral conditions. Thus OP-DE, OP-CA were selected for further
investigation to understand the influence that the type of polysaccharide has on the gel
formation mechanism.
It is worthy of notice that all gels prepared showed a continuous protein surface regardless of
the pH or salt content used in its preparation with the exception of gels prepared with OP-CA
at pH7, which showed a continuous protein surface with large insertions of carrageenan
particles with approximate size of 1.5 mm.
5.3.3. Protein interactions
While electrostatic attractions are the main driving force in protein-polysaccharide
complexation, other interactions such as hydrogen bonds and hydrophobic interactions may
contribute to the stability of the protein-polysaccharide system 38
. To elucidate the type of
interactions involved in the development of the oat protein-polysaccharide gels, gel
rheological properties were studied by a frequency test in the presence of dissociating
144
reagents including urea, 2-ME and SDS; that are known to interrupt hydrogen bonds,
disulfide bonds and hydrophobic interactions respectively. The gels prepared at pH 3 and
treated with SDS shrank and hardened. This was due to strong interaction develop between
positively charged protein and negatively charged SDS, which resulted in highly condensed
networks with reduced protein-water interactions. Thus, readings obtained for these samples
were considered not reliable and are not included. The participation of disulfide bonds on
gels prepared at pH 3 was not expected, as it is known that the ability of disulfide bond
formation is reduced at pH values lower than 7 where other interactions become more
relevant in the aggregation process 297
. This is associated to the fact that disulfide bonds are
unlikely to take place under acidic conditions due to low reactivity of cysteine 262
. Therefore
at pH 3, only the involvement of hydrogen bonding was evaluated and all samples treated
with urea showed greatly reduced G’ values and the reduction levels in OP-DE and OP-CA
were higher than gels with OP alone (Data not shown). This could indicate that the addition
of the polysaccharide increased hydrogen bonds in the gels. Hydrogen bonds may take place
between the C=O and N-H groups of the protein and hydroxyl groups of the polysaccharide
289 and hydrogen bonds are also believed to participate in the secondary stabilization of
complexes formed by electrostatic attractive forces 298
such as the one formed by OP-CA at
this pH. Hydrophobic bonds may also contribute to gel formation as urea can also disrupt
hydrophobic forces according to a previous report 299
. Figure 29 shows the response of G’ to
the variation on frequency of oat protein derived gels prepared at pH 7 with and without salt.
At this pH and in the absence of salt, all samples treated with SDS, urea and 2-ME showed
greatly reduced G’ values of OP gels. This indicates that hydrogen bonds, disulfide bonds
and hydrophobic forces all play essential role to stabilize gel networks.

145
In the case of OP-DE a similar effect was observed, however the G’ was slightly less affected
in the presence of 2-ME. In contrast, gels prepared with OP-CA were not affected by 2-ME
but were disturbed by SDS and urea. Thus hydrogen bonds and hydrophobic forces
constituted the main support of the OP-DE and OP-CA gel networks at neutral pH. Heat is
expected to cause the dissociation of oat globulin hexamers by breaking disulfide bonds
linking the acidic and basic subunits. This allows the re-formation of disulfide bonds during
the heating process and explains the involvement of disulfide bonds in OP gel formation. In
the case of gels containing carrageenan the development of new disulfide bonds may be
hindered. Probably due to the fact that strong repulsion hampered the required proximity for
the SH/S-S- interchange. This situation was not expected in the case of dextrin, since the
addition of this polysaccharide has slight effect on the electrostatic repulsion of the system.
Previous studies demonstrated that the presence of anionic polysaccharides appeared to
protect BSA against extensive aggregation associated to formation of intermolecular
disulfide bridges, during or after high-pressure treatment 300
. In spite of depleted disulfide
bonds for OP-CA gels, these gels showed superior mechanical strength than that of OP and
OP-DE. In the presence of salt, OP gels at pH 3 treated with urea also show reduced G’
values. Thus, hydrogen bonds and possibly hydrophobic forces are main contributors in gel
network building. In the case of OP-DE, G’ values were strongly reduced by treatment with
urea, as the development of hydrogen bonds is expected due to the hydroxyl content of
dextrin 289
. OP-CA with 50 mM NaCl showed a similar profile to OP-CA without salt (Data
not shown).

146
Figure 29 Storage modulus (G’) of oat protein derived gels prepared at pH 7 without
salt and 50 mM NaCl as a function of angular frequency

147
This is understandable as hydrogen bonds and hydrophobic forces are not affected by salt and
these interactions are expected to provide additional support to the complexes formed. At pH
7 and with addition of 50 mM NaCl the G’ values of all gels were mainly affected by urea
and SDS, and no effect of 2-ME was observed (Figure 29). As a result of salt addition the
contribution of disulfide bonds seems to be less important. This may be related to the
shielding effect that salt has in the surface charges, which reduces the repulsive forces
between protein molecules and between protein and polysaccharide. This promoted rapid
random association of protein aggregates and by doing so, disulfide bonds were not
developed due to the compact structure of the protein, where sulfhydryl groups could be
hidden inside. Thus, the main forces supporting the gel network in the presence of salt were
hydrogen and hydrophobic forces.
5.3.4. Turbidity and particle size
The changes in turbidity were recorded before and after heating OP and OP-polysaccharide
suspensions with the purpose of studying how the progression of the heat-induced
aggregation is affected by the presence of the polysaccharides. Before heating the turbidity of
OP at pH 3, showed the lowest value among samples (Figure 30). OP-DE and OP-CA
showed higher turbidity. This may be associated to hydrogen bonds taking place between the
protein and hydroxyl groups of dextrin 289
as it was suggested earlier. For OP-CA the
increased turbidity is primarily due to electrostatic attraction between the negatively charge
carrageenan and the positively charged protein, this produced charge neutralization and
bridging effects, leading to an increase in particle size and light scattering efficiency of the
protein-polysaccharide complexes 301
. Moreover, hydrogen bonding and hydrophobic
interactions are expected to participate in the secondary support of OP-CA complexes. Salt
148
addition significantly (p<0.05) increased the turbidity of OP suspension and the same effect
was observed for OP-DE and OP-CA. Salt addition reduced the electrostatic repulsion
between proteins, which promoted aggregation. To corroborate the changes in electrostatic
forces due to salt addition the zeta potential (ζ) of the OP and OP-polysaccharide suspensions
was also determined. In the case of OP the ζ changed from 26±0.4 l to 14±0.2 with addition
of 50 mM NaCl at pH 3, for OP-DE from 27±0.2 to 14±0.6 and for OP-CA from 22±0.4 to
10±0.1. The difference in the ζ in the case of OP-CA compared to OP and OP-DE is due to
the negative charge of carrageenan, which confirms that charge neutralization and bridging
effects are taking place. After heating the sample turbidity increased due to formation of
more aggregates, which impaired the light transmission due to the light scattering of
particles.
At pH 7, OP-DE also showed higher turbidity than OP. Remarkably the turbidity for OP-CA
was lower than OP and OP-DE. Strong repulsive forces between the negatively charged
carrageenan and the negatively charged protein prevented aggregation hence large aggregates
could not form. Addition of salt resulted in dramatic increase of the turbidity in OP
suspension, suggesting the electrostatic repulsion between proteins was greatly affected by
salt and aggregation was promoted. Considering that at pH 3, the repulsive forces are larger
than at pH 7 and thus, at neutral pH, the balance between repulsive and attractive forces is
reached in oat protein suspensions. Therefore, salt addition can easily disrupt this balance
and in turn, attractive forces may become the dominant type of interaction resulting in larger
aggregates. In contrast at pH 3 the changes in turbidity are limited as the weight of the
repulsive forces is higher and thus a higher salt concentration would be needed to produce a
similar effect as the one observed at pH 7. Turbidity of OP-DE also increased after salt
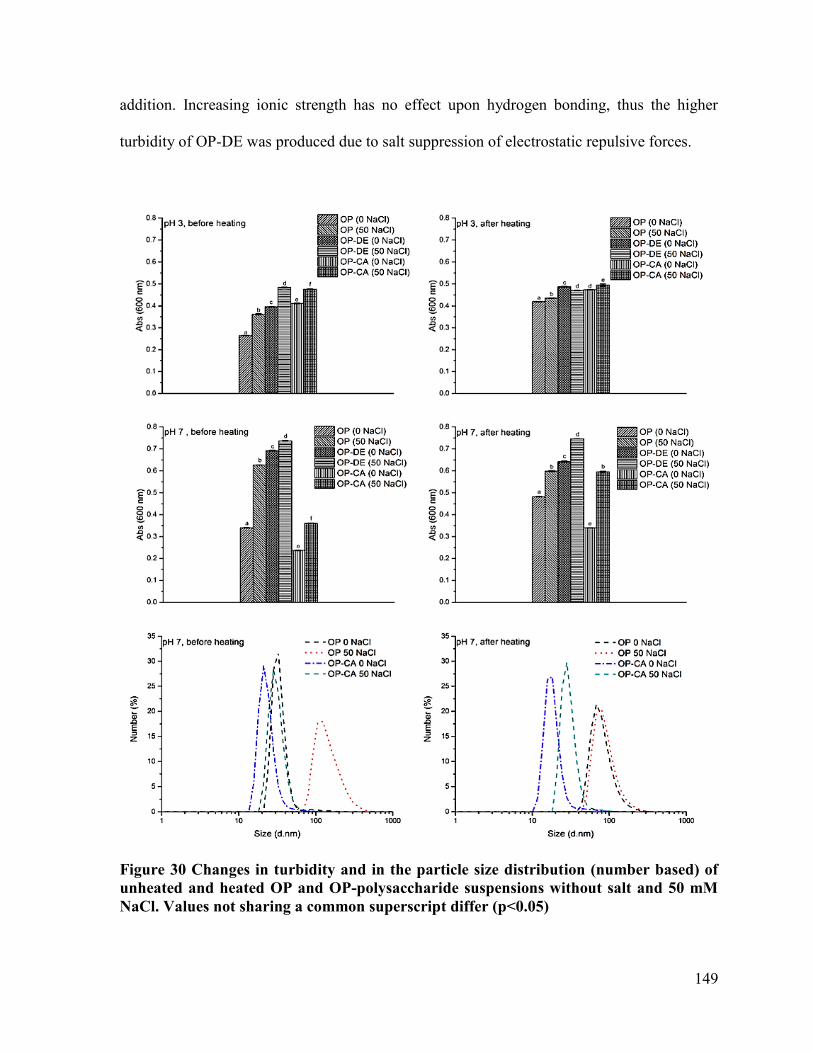
149
addition. Increasing ionic strength has no effect upon hydrogen bonding, thus the higher
turbidity of OP-DE was produced due to salt suppression of electrostatic repulsive forces.
Figure 30 Changes in turbidity and in the particle size distribution (number based) of
unheated and heated OP and OP-polysaccharide suspensions without salt and 50 mM
NaCl. Values not sharing a common superscript differ (p<0.05)
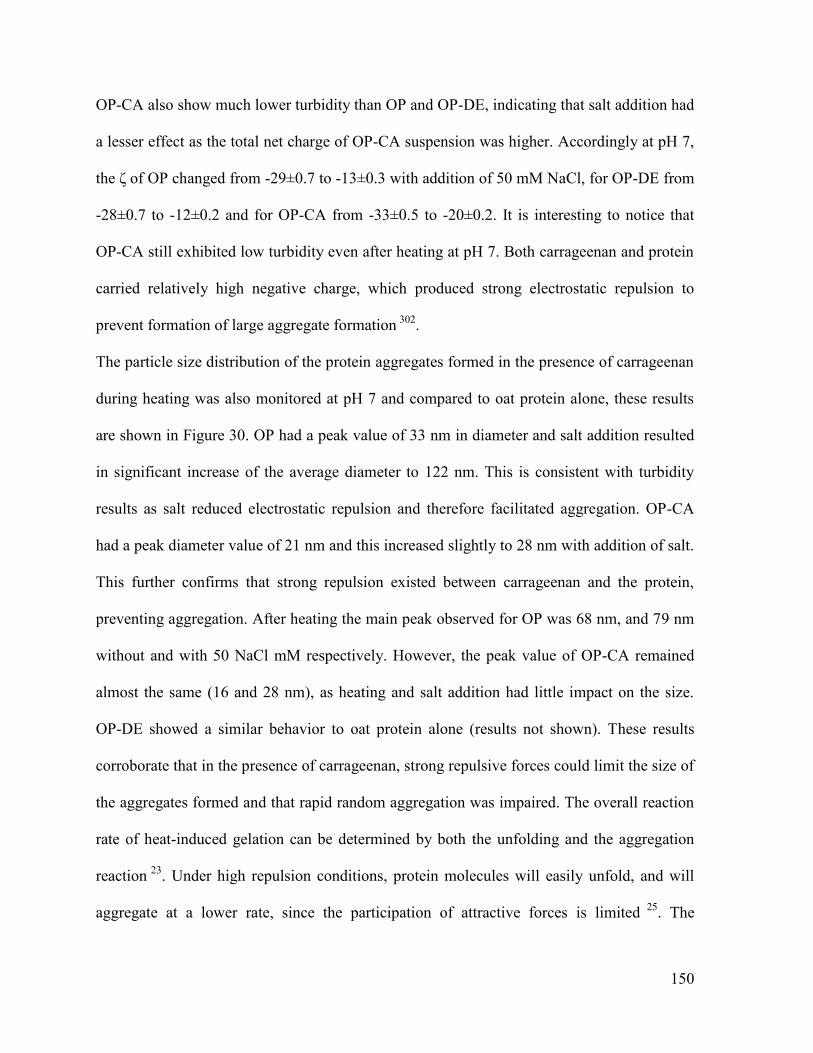
150
OP-CA also show much lower turbidity than OP and OP-DE, indicating that salt addition had
a lesser effect as the total net charge of OP-CA suspension was higher. Accordingly at pH 7,
the ζ of OP changed from -29±0.7 to -13±0.3 with addition of 50 mM NaCl, for OP-DE from
-28±0.7 to -12±0.2 and for OP-CA from -33±0.5 to -20±0.2. It is interesting to notice that
OP-CA still exhibited low turbidity even after heating at pH 7. Both carrageenan and protein
carried relatively high negative charge, which produced strong electrostatic repulsion to
prevent formation of large aggregate formation 302
.
The particle size distribution of the protein aggregates formed in the presence of carrageenan
during heating was also monitored at pH 7 and compared to oat protein alone, these results
are shown in Figure 30. OP had a peak value of 33 nm in diameter and salt addition resulted
in significant increase of the average diameter to 122 nm. This is consistent with turbidity
results as salt reduced electrostatic repulsion and therefore facilitated aggregation. OP-CA
had a peak diameter value of 21 nm and this increased slightly to 28 nm with addition of salt.
This further confirms that strong repulsion existed between carrageenan and the protein,
preventing aggregation. After heating the main peak observed for OP was 68 nm, and 79 nm
without and with 50 NaCl mM respectively. However, the peak value of OP-CA remained
almost the same (16 and 28 nm), as heating and salt addition had little impact on the size.
OP-DE showed a similar behavior to oat protein alone (results not shown). These results
corroborate that in the presence of carrageenan, strong repulsive forces could limit the size of
the aggregates formed and that rapid random aggregation was impaired. The overall reaction
rate of heat-induced gelation can be determined by both the unfolding and the aggregation
reaction 23
. Under high repulsion conditions, protein molecules will easily unfold, and will
aggregate at a lower rate, since the participation of attractive forces is limited 25
. The

151
combination of high unfolding rate with low aggregation rate allows formation of structures
with higher degree of order 25
. Therefore addition of carrageenan could facilitate formation of
a highly organized oat protein network. A highly order structure implies that the ensemble of
reactive units took place in an intimate lateral sequence, which later on allowed the
contribution of other intermolecular interaction as secondary support of the structure
culminating in stronger gels 27
which according to the previous rheological tests are hydrogen
bonds and hydrophobic forces. This may also explain the two-fold increase in compressive
stress with incorporation of small amount of carrageenan at pH 7, in addition to the apparent
increase in protein concentration due to phase separation 295
.
5.3.5. Surface hydrophobicity
Hydrophobic forces play an important role to stabilize oat protein based gels, therefore
changes in surface hydrophobicity after heating as induced by addition of different type of
polysaccharide or salt content were also investigated, and the results are demonstrated in
Figure 31. Normally, globular proteins are composed of charged side groups at their surface
and hydrophobic groups buried at the interior of the structure. After heating, proteins can
unfold exposing buried hydrophobic groups; these groups could alter the surface
characteristics by providing additional sites for crosslinking. Heating in the presence of
dextrin had no significant impact on the surface hydrophobicity as no strong electrostatic
interactions could be developed between oat protein and dextrin. In contrasts heating in the
presence of carrageenan increased the surface hydrophobicity especially with salt. This
suggests exposure of hydrophobic residues 287,303
due to strong repulsive forces in the OP-CA
suspension.
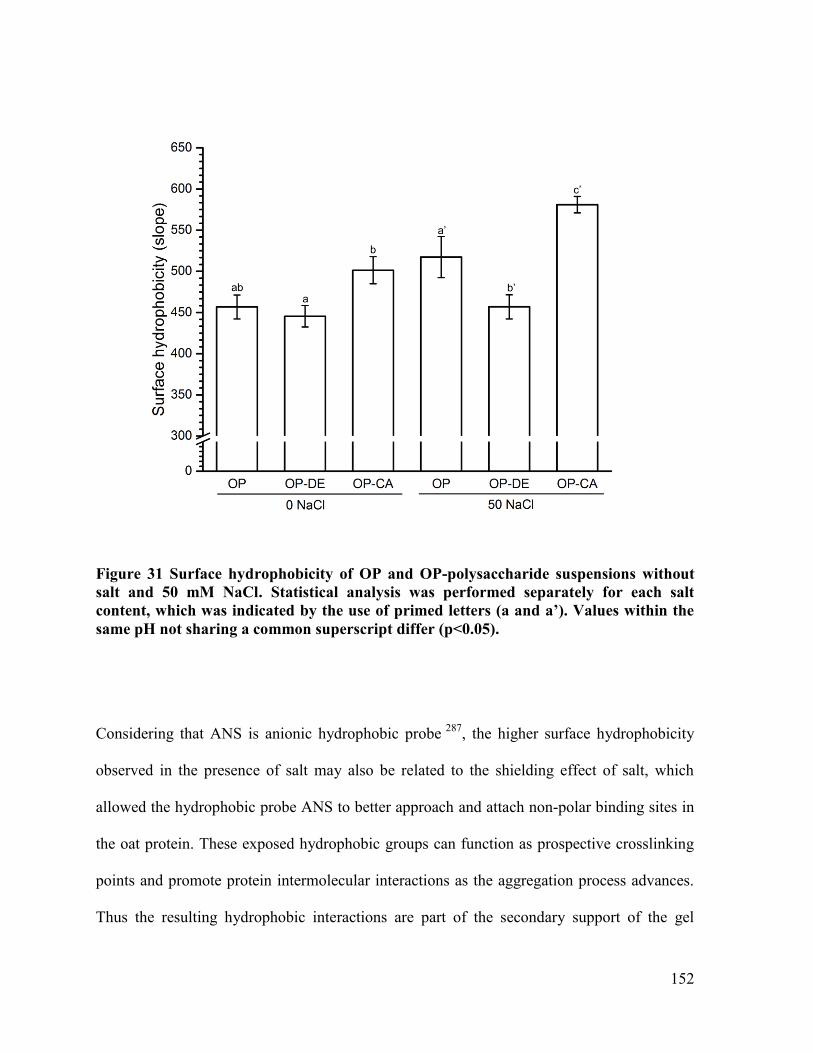
152
Figure 31 Surface hydrophobicity of OP and OP-polysaccharide suspensions without
salt and 50 mM NaCl. Statistical analysis was performed separately for each salt
content, which was indicated by the use of primed letters (a and a’). Values within the
same pH not sharing a common superscript differ (p<0.05).
Considering that ANS is anionic hydrophobic probe 287
, the higher surface hydrophobicity
observed in the presence of salt may also be related to the shielding effect of salt, which
allowed the hydrophobic probe ANS to better approach and attach non-polar binding sites in
the oat protein. These exposed hydrophobic groups can function as prospective crosslinking
points and promote protein intermolecular interactions as the aggregation process advances.
Thus the resulting hydrophobic interactions are part of the secondary support of the gel

153
structure. The high repulsive forces in the OP-CA system could control the rate of
aggregation and expose hydrophobic groups during heating that in turn produced a highly
ordered structure 36
with higher level of crosslinking, leading to greatly improved mechanical
strength.
5.3.6. Fourier transformed infrared (FTIR) spectroscopy
In order to understand the impact of phase separation on the protein network formation, the
protein secondary structure in the gel was studied by FTIR. OP-CA system was addressed
due to the interesting observations of the changes on protein aggregation in the presence of
carrageenan. Figure 32 shows the deconvoluted spectra of gels prepared with OP without salt
and OP-CA with 0 and 50 mM NaCl. The amide I band between 1700 and 1600 cm-1
is used
to observe changes in the secondary structure of proteins. The spectrum of OP showed seven
components 277
: 1693 cm-1
(β-sheet), 1680 cm-1
(β-sheet), 1670 cm-1
and 1659 cm-1
(β-turn),
1643 cm-1
(random coil), 1625 cm-1
(β-sheet) and 1609 cm-1
(side chain vibrations). The
addition of carrageenan caused remarkable increase in absorption intensity, suggesting that
the protein molecules rearranged into a more organized structure 304
in the gel networks both
with and without salt.
154
Figure 32 Deconvoluted spectra of OP and OP-CA gels without salt and 50 mM NaCl at
pH 7
5.3.7. Confocal laser scanning microscopy (CSLM)
Confocal images of OP showed a continuous protein network, OP-DE and OP-CA exhibited
a similar structure to the one formed by OP alone at neutral pH (Figure 33). Nonetheless, OP-
CA showed some localized inclusions of transparent gel (carrageenan) randomly distributed
among the protein continuous network, confirming phase separation in the gel system.

155
Confocal images confirm that dextrin and carrageenan were present in the void spaces of the
protein network and that dextrin insertions were more and had a smaller size (~20 μm),
whereas carrageenan insertions were much larger in size but fewer. These carrageenan
inclusions varied in size and could be as large as 1.5 mm. This indicates that a different
degree of phase separation occurred in these two systems. A higher degree of phase
separation refers to a phase-separated microstructure in which the protein phase contains a
small number of large polysaccharide insertions, whereas a lower degree of phase separation
is related to a large number of small polysaccharide insertions.
Figure 33 Confocal microscopic photographs of OP and OP-polysaccharide gels formed
at pH 7. Scale bar represents 100 μm
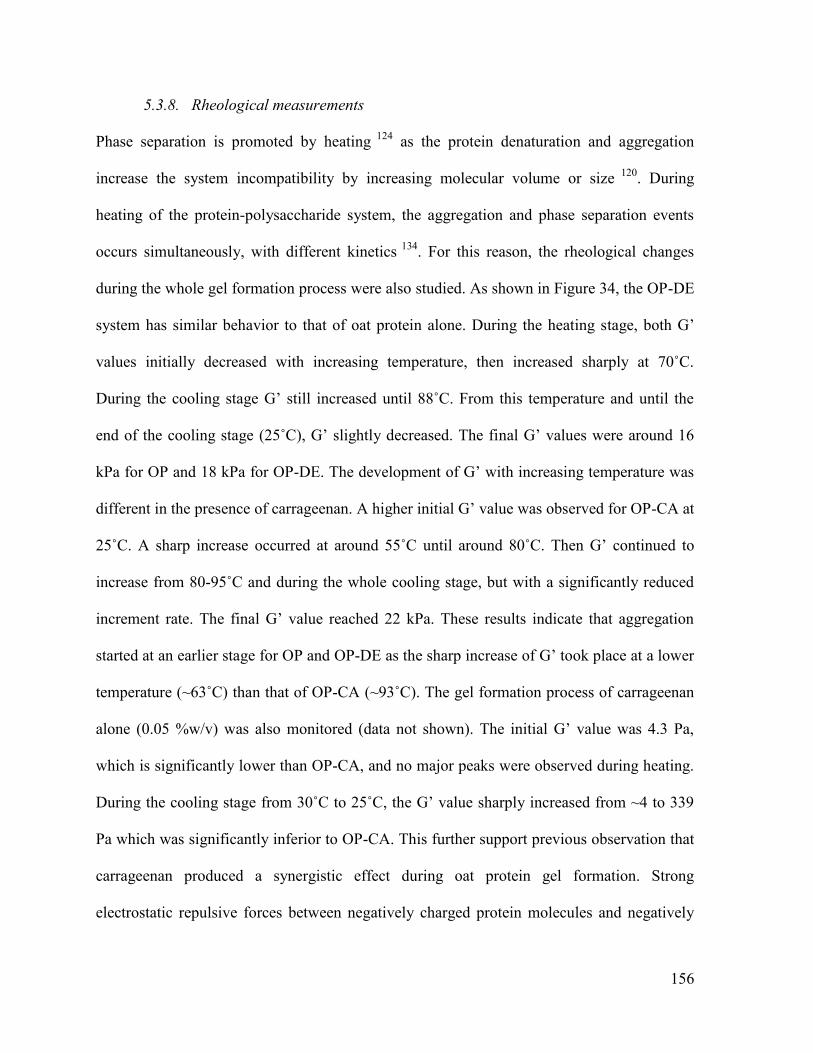
156
5.3.8. Rheological measurements
Phase separation is promoted by heating 124
as the protein denaturation and aggregation
increase the system incompatibility by increasing molecular volume or size 120
. During
heating of the protein-polysaccharide system, the aggregation and phase separation events
occurs simultaneously, with different kinetics 134
. For this reason, the rheological changes
during the whole gel formation process were also studied. As shown in Figure 34, the OP-DE
system has similar behavior to that of oat protein alone. During the heating stage, both G’
values initially decreased with increasing temperature, then increased sharply at 70˚C.
During the cooling stage G’ still increased until 88˚C. From this temperature and until the
end of the cooling stage (25˚C), G’ slightly decreased. The final G’ values were around 16
kPa for OP and 18 kPa for OP-DE. The development of G’ with increasing temperature was
different in the presence of carrageenan. A higher initial G’ value was observed for OP-CA at
25˚C. A sharp increase occurred at around 55˚C until around 80˚C. Then G’ continued to
increase from 80-95˚C and during the whole cooling stage, but with a significantly reduced
increment rate. The final G’ value reached 22 kPa. These results indicate that aggregation
started at an earlier stage for OP and OP-DE as the sharp increase of G’ took place at a lower
temperature (~63˚C) than that of OP-CA (~93˚C). The gel formation process of carrageenan
alone (0.05 %w/v) was also monitored (data not shown). The initial G’ value was 4.3 Pa,
which is significantly lower than OP-CA, and no major peaks were observed during heating.
During the cooling stage from 30˚C to 25˚C, the G’ value sharply increased from ~4 to 339
Pa which was significantly inferior to OP-CA. This further support previous observation that
carrageenan produced a synergistic effect during oat protein gel formation. Strong
electrostatic repulsive forces between negatively charged protein molecules and negatively
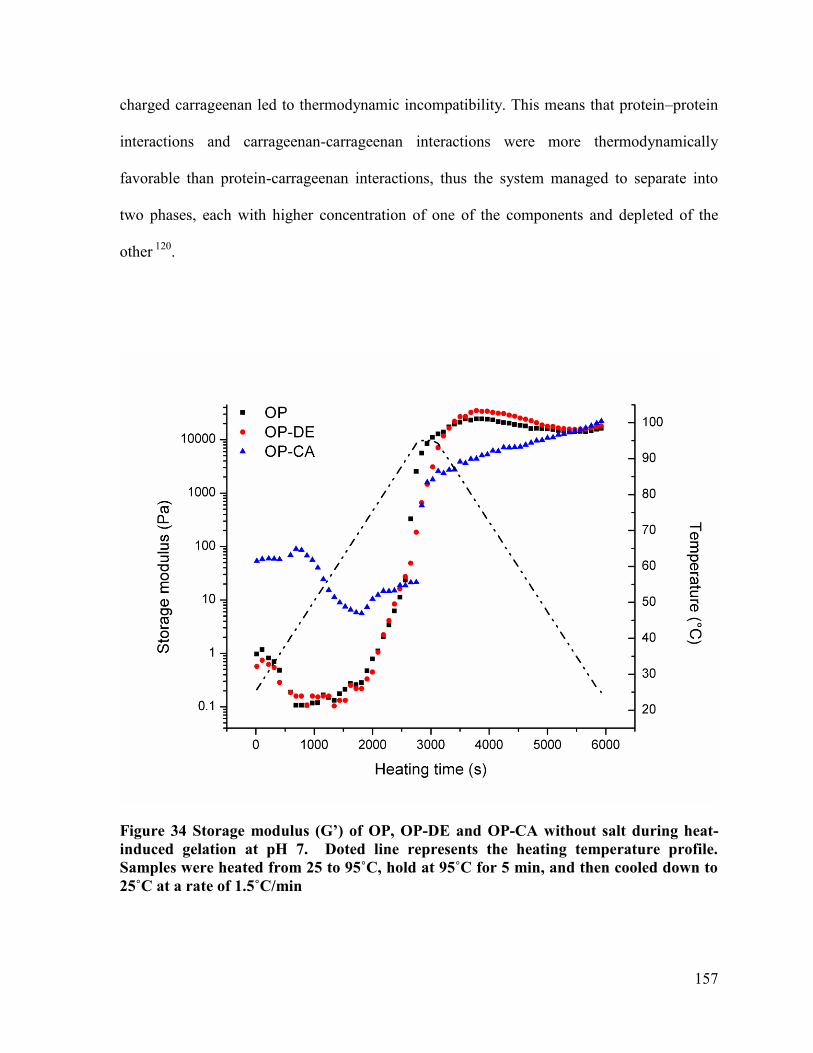
157
charged carrageenan led to thermodynamic incompatibility. This means that protein–protein
interactions and carrageenan-carrageenan interactions were more thermodynamically
favorable than protein-carrageenan interactions, thus the system managed to separate into
two phases, each with higher concentration of one of the components and depleted of the
other 120
.
Figure 34 Storage modulus (G’) of OP, OP-DE and OP-CA without salt during heat-
induced gelation at pH 7. Doted line represents the heating temperature profile.
Samples were heated from 25 to 95˚C, hold at 95˚C for 5 min, and then cooled down to
25˚C at a rate of 1.5˚C/min
158
As a nonionic polysaccharide dextrin could also show thermodynamic incompatibility with
the negatively charged oat protein at neutral pH during heating. Phase separation between oat
protein and inulin, another neutral polysaccharide, resulted in formation of inulin
nanoparticles homogeneously distributed inside the protein network 294
. Thermodynamic
incompatibility does not only arise from electrostatic repulsion, it can also be related to
differences in the size and shape of the molecules. Before heating, the entropy of mixing
allows a homogenous system, but with increasing temperature the size of the aggregates
increases, and the entropy of mixing is reduced and therefore the stability of the system 35
leading to phase separation phenomenon. In the interest of better understanding the formation
of phase-separated gel networks it is necessary to consider that two events are taking place
simultaneously. One is the phase separation process and as it was previously mentioned, this
process is stimulated with increasing temperature. The second event is the gelation process.
The establishment of a rigid gel network is related to the process of unfolding and the
exposure of reactive groups that enable the molecular interactions such as hydrophobic
interactions to reinforce the gel network 271
. During heating, as phase-separation proceeds,
polysaccharide molecules are preferentially excluded from the protein surface. The
polysaccharide rich phase, which is more hydrophilic and has a higher excluded volume
effect, will have higher water content and hence a more concentrated phase, rich in protein
will be formed 120
. A higher apparent concentration in the protein phase explains the
improvement seen in the gelling properties, as more intermolecular interactions were
developed in the oat protein network. Other point of consideration is the fact that in the OP-
CA gel formation, the process was greatly controlled by strong repulsive forces and in
consequence the aggregation process was better organized. This was supported by the fact

159
that G’ values of OP-CA increased at a later time and a higher temperature than OP and OP-
DE during the heating process. The extent of the phase separation and thus the heterogeneity
of the gels depend on the rate of phase separation compared to the rate of aggregation 305
.
During cooling the protein network was further reinforced probably by hydrogen bonds as
part of the secondary support of the gel network as it was suggested earlier in section 5.3.3.
Thermodynamic incompatibility of protein and polysaccharides arises from differences on
their molecular properties such as shape, size or charge 282
. Hence, the different
characteristics produced by OP-DE and OP-CA gels may be related to the difference in the
extent of phase separation. In the case of OP-DE the rate of phase separation is slower than
the rate at which OP forms gel, as no obvious change in the G’ development profile was
observed during heating. Thus is speculated that dextrin is uniformly distributed within the
OP network. On the other hand, OP-CA showed a higher rate of phase separation, as small
carrageenan insertions were visible in the protein continuous networks, possibly due to the
slower aggregation process, which allowed the formation of carrageenan rich domains embed
in the protein network.
The charge density played an important role to determine the extent of phase separation, as it
directly impacts the strength of the electrostatic repulsive forces between protein and
polysaccharide as well as the degree of protein unfolding. The difference in molecular weight
between dextrin and carrageenan may also contribute to such different degree of phase
separation by affecting the volume occupied by the polysaccharide, which in consequence
impacted the apparent protein concentration in the protein rich phase for gel formation. The
excluded volume effect is significantly greater for molecules with a larger size and non-
160
spherical macromolecules such as linear polysaccharide 306
. Since dextrin had a much lower
molecular weight than carrageenan, thus the space occupied by carrageenan was much higher
5.4. Conclusion
The gel strength improvement by addition of dextrin or carrageenan at neutral pH was
studied and results suggested that, as polysaccharides have a more hydrophilic character than
proteins, the polysaccharide rich domains hold a large amount of water and consequently the
protein rich domain has an increased concentration. The improved gel strength observed in
OP-DE and OP-CA gels is then associated to the apparent increase in protein concentration
as the firmness of a protein gel is determined by the concentration of particles incorporated
into the gel network 295
. It was also revealed that different levels of phase separation occurred
in the OP-DE and OP-CA gels and the heterogeneity depends on the rate of phase separation
compared to the rate of protein aggregation. OP-CA gels showed a higher level of phase
separation, as small carrageenan insertions were visible in the protein continuous network
due to the slower aggregation process, which allowed the formation of carrageenan rich
domains embed in the protein network. Whereas in the case of OP-DE, the rate of phase
separation was slower than the rate at which OP forms gel, thus dextrin particles were
uniformly distributed within the protein network. Additionally the polysaccharide rich phase
exerts a filling effect by occupying the void spaces of the protein network. This is more
evident in the case of carrageenan as gels with higher heterogeneity were formed. The
different degree of phase separation produced gels with different strength. Moreover, it has
been suggested that strong repulsive forces caused by carrageenan addition resulted in a
highly order network structure, thus the ensemble of the reactive protein molecules may take
161
place in an intimate lateral sequence, which permitted the development of hydrogen and
hydrophobic interactions to further strengthen the protein networks.

162
Chapter 6
6. Final remarks
6.1. Summary and conclusions
The endeavor of this research required the improvement of the gelling properties as the
previous work of Ma et al. 144,145
has shown that oat protein can form strong gels under
alkaline conditions, but at acidic and neutral pH, very weak gels with poor water holding
capacity were obtained. This makes the incorporation of oat protein in food products very
challenging. For this, different strategies to improved gelling properties of oat protein were
investigated in the precedent chapters yielding favorable results. In the following paragraphs
the highlights of each chapter are included in the interest of validating the potential of oat
protein as an appropriate food gelling agent.
Chapter 1 includes a literature review, which tried to underline the many unique features that
make oat a prospective source of plant protein. This review also covered the thermal gelation
of proteins and the description of the different gel network structures that can be produce.
Also various proposed gelation mechanisms were addressed. The technological alternatives
available for further improvement of gelling properties were included as well. Special
attention was given to two different strategies for improvement of gelling properties. These
strategies included, enzymatic hydrolysis and protein-polysaccharide interactions. Unlike the
other alternatives available, these strategies have not been previously used for improvement
of the gelling properties of oat protein. Additionally, these two strategies may be regarded by

163
consumers as more “natural” and thus better accepted. In the last section of Chapter 1 the
motivation for this research and the objectives were detailed.
Enzymatic hydrolysis is a desirable tool for the improvement of functional properties of
proteins. For this reason in Chapter 2 the utilization of EMR was presented as an interesting
alternative for production of protein hydrolysates derived from food ingredients. The
combination of enzymatic hydrolysis and membrane technology presents some practical and
economical advantages that make this technology suitable for preparation of value added
ingredients at industrial scale. Functional properties such as gelation are strongly influenced
by the molecular weight of the hydrolysates. Thus, through the application of EMR, the
molecular weight of the end product can be carefully controlled. In this chapter the
preparation of various value added ingredients from different food components including
lipids, proteins and carbohydrates was also discuss. Some examples of the design
implemented for the concentration, purification or separation of these values added
ingredient such as the implementation of integrated membrane processes which includes
sequential filtration process or electro-membrane filtration were also discussed.
In Chapter 3, the effect of partial hydrolysis on structure and gelling properties of oat
globular proteins was investigated. A systematic study of the thermal gelation of oat protein
and its hydrolysates under different environmental conditions was performed with the
underlining objective of improving the gelling properties. The improvement of the gelling
properties is enzyme specific. Alcalase and pepsin hydrolysated showed reduced gelling
capacity. In contrast, flavourzyme and trypsin hydrolysates could form gels with similar
mechanical strength and water-holding capacity comparable to egg white. The acidic
polypeptide of the 12S fraction exerted great influence over the gelling ability of oat protein,
164
as only the hydrolysates with well-preserved acidic polypeptide demonstrated good gelling
properties, possibly due to the larger molecular weight of this fraction. Partial hydrolysis
with the appropriate enzyme altered the charges on the protein molecular chains, allowing a
balance between attractive and repulsive forces at pH 8 and 9 to establish strong three-
dimensional gel networks when heated at 110 and 120˚C. Additionally it was suggested that
the partial hydrolysis also led to increased exposure of hydrophobic groups that remained in
the peptide chains, which allowed development of gel with improved strength via
hydrophobic interactions. Both oat protein and the hydrolysate gels exhibited excellent water
holding capacity at neutral or mildly alkaline conditions. The results of this study indicate
that oat protein have promising potential to be used as a new cost-effective gelling ingredient
of plant origin to provide texture and structure in food products.
In Chapter 4 the second strategy for the improvement of gelling properties was addressed.
For this the development of protein-polysaccharide interactions, for the enhancement of the
gelling properties of oat protein was investigated. Oat protein was mixed with small amounts
of inulin and the gelling mechanism of such system was studied by correlating protein
structure changes during heating to gel microstructures and bulk properties. Unlike many
other globular proteins that aggregate during heating, oat protein dissociated from hexamers
down to monomers. In turn, monomers worked as building blocks, which are highly reactive
and allowed protein gel network development at a near molecular level, resulting in the
development of strong interactions in gel networks with high mechanical strength. Heat
treatment also disrupted the disulfide bond that links the acidic and basic polypeptides in the
12S fraction of oat. As a consequence of this, new disulfide bonds were produced during the
gel formation process, which further strengthened the gel networks. A strong synergistic
165
effect was achieved by adding a small amount of inulin into the oat protein gel system. Inulin
and oat protein showed thermodynamic incompatibility during heating, causing the system to
separate into two different phases, one enriched in protein and the other one enriched in
polysaccharide. Consequently, a higher apparent concentration in the protein phase explains
the improvement seen in the gelling capacity of oat protein, since a higher number of
interactions were developed in the oat protein network. Moreover, inulin contributed to the
formation of junction zones in which hydrogen bonds and hydrophobic forces were built at
the phase borders, leading to a vastly cross-linked gel network with a reinforced structure.
Since mixtures of protein and polysaccharides are often used in the development of food
products. It should be noted that strong oat protein-inulin gels were formed at neutral pH
when heated at 100˚C. This has greatly broadened the application of oat protein based gels
for food and non-food applications as the denaturation temperature of oat protein has been
determined to be 120˚C and strong gels were only produced at pH 9 or higher.
Chapter 5, attempted to broaden the scope of application of protein-polysaccharides
interactions for improvement of oat protein gelling properties based on the positive results
obtained in in Chapter 4. This triggered our interested to systematically investigate the
impact of different polysaccharide on oat protein gelling properties. Three different types of
polysaccharides with different electric charge were used in order to promote different types
of interactions. In this work it was proposed that the thermodynamic incompatibility between
oat protein and dextrin or carrageenan arises from differences in the charge density and size
of the molecules. Accordingly, gels with different mechanical properties and characteristics
were formed with lower or higher degree of phase separation. Rheological measurements of
OP-DE during heating showed G’ development similar to that obtained by OP, thus it was
166
speculated that the rate of phase separation is slower than the rate at which OP forms the gel,
hence dextrin is uniformly distributed within the OP network. In contrast, a higher rate of
phase separation was expected with OP-CA as the aggregation process was greatly controlled
by electrostatic repulsion allowing the system to phase separate in a larger extent. This was
confirmed as G’ values of OP-CA increased at a later time and a higher temperature than OP
and OP-DE during the heating process. As phase separation and aggregation processes are
simultaneous, the rate at which each process takes place will determine the extent of phase
separation reached by a protein-polysaccharide system. Since the addition of carrageenan
slowed down the aggregation process due to strong repulsive forces a highly organized
structure was formed which also contributed to enhancement of the gel strength.
Additionally, phase separation also produced a higher apparent concentration in the protein
phase, which in turn increased the number of interactions develop in the oat protein network.
This research confirmed the initial hypotheses, that oat protein gelling properties can be
improved by enzymatic modification or by mixing with polysaccharides. In both cases,
modification ultimately promotes interaction development in protein gel networks. The
protein gel microstructure, mechanical properties, water holding capacity and other
properties are closely related to the type of interactions produced after modification. Proper
control and modulation of processing conditions, that favor those interactions associated with
a strengthening effect, is imperative for the design of novel applications. Basically, the
investigation of the gel formation mechanism at a molecular level provided the knowledge
necessary to do a rational design. Taking advantage of this, optimized properties for
particular applications can be produced.

167
6.2. Significance of this work
The plant-based protein market is growing rapidly due to the increasing demand for
nutritious and healthy food products. Additionally, consumers have a favorable image of a
protein-based diet. For many years plant based gelling agents have been incorporated into
foods to reduce cost, to improve processing yield, to decrease caloric content or cholesterol
and to confer texture and support in foods. This research demonstrates that oat protein gels
can be produced under more food appropriate conditions, considering that the precedent
work of Ma 144,145
exhibited limited applications. Significant improvement of the oat protein
gelling properties was achieved and the scope of application was also expanded to food and
non-food applications. To our knowledge, this work is the first to address the improvement of
gelling properties through enzymatic hydrolysis or protein-polysaccharide interactions.
Furthermore the systematic study of the molecular mechanism of oat protein gelation and the
correlation of protein structure changes during heating to physical properties of the gels,
allowed the generation of new knowledge associated to the molecular events taking place
during the gel structure formation, which is key for the rational design of different textures
with specific mechanical, rheological or microstructural characteristics.
The findings from this work may encourage oat producers to promote the utilization of oat as
an ingredient for human consumption, which could add economic value to their operations,
and also motivate food producers to apply, oat protein as a gelling agent in response to the
increasing demand for plant-based proteins, which could increase the profit generated by
producers and processors. Ultimately, the stimulated utilization of this crop may also benefit
consumers by having more choices, furthermore delivering the inherent health benefits of
this crop.
168
6.3. Perspectives
The initial hurdle for the utilization of oat protein as a food ingredient has to be the extraction
process at industrial level. It is necessary to develop sustainable and economical method for
isolation of oat protein. Only if derived from a cost-conscious process, oat protein may be
considered a cost-effective gelling agent.
Secondly the introduction of oat protein into a multicomponent food system such as
comminuted meat products will allow assessment of the multiple interactions with other
ingredients as well as the evaluation of the impact that the other ingredients such as fat,
starch or meat proteins may have on oat protein gelation in the full system. Consequently
sensory evaluation should be conducted in the interest of assessing consumers’ acceptance.
Additionally, biomedical applications generate plenty of interest and give great opportunity
for oat protein as a biopolymer. Taking advantage of its GRAS character, biocompatibility
and biodegradability, multiple uses related to tissue engineering as well as the design of
novel drug delivery systems may represent an enormous field of application.
169
References
References
1. Butt, M.S.; Shabir, R.; Butt, M.S.; Tahir-Nadeem, M.; Khan, M.K.I. Oat: unique among the cereals
[electronic resource]. Eur. J. Nutr. 2008, 47, 68-79.
2. Magness, J.; Markle, G.; Compton, C.C. Food and feed crops of the United States. 1971,
3. Gulvady, A.A.; Brown, R.C.; Bell, J.A. Nutritional Comparison of Oats and Other Commonly Consumed Whole Grains. Oats Nutrition and Technology 2013, 71-93.
4. Youngs, V.L. Oat lipd and lipid related enzymes, In Oats: Chemistry and Technology, Webster, F., Ed.;1986; pp. 205-226.
5. Biel, W.; Bobko, K.; Maciorowski, R. Chemical composition and nutritive value of husked and
naked oats grain. J. Cereal Sci. 2009, 49, 413-418.
6. Agriculture & Agri-Food Canada Market Outlook Report Volume 2 Number 3. Oats: Situation and outlook. 2010,
7. US FDA <br />Food labeling: Health claims; oats and coronary heart disease: Final rule. Federal <br /> . 1997, Register 62, 3584–3601.,
8. Singh, R.; De, S.; Belkheir, A. Avena sativa (Oat), a potential neutraceutical and therapeutic agent:
an overview. Crit. Rev. Food Sci. Nutr. 2013, 53, 126-144.
9. Health Canada Oat products and cholesterol lowering. Summary of assessment. 2010,
10. Vasanthan, T.; Temelli, F. Grain fractionation technologies for cereal beta-glucan concentration.
Food Res. Int. 2008, 41, 876-881.
11. Webster, F. Whole-grain oats and oat products. Whole-Grain Foods in Health and Disease.St.Paul, MN, USA: Amer.Assoc.Cereal Chem 2002, 83-123.
12. Sahlstrom, S.; Knutsen, S.H. Oats and rye: Production and usage in Nordic Baltic countries. Cereal Foods World 2010,
13. Robert, L.S.; Nozzolillo, C.; Cudjoe, A.; Altosaar, I. Total Solubilization of Groat Proteins in
High Protein Oat ( Avena sativa L. cv. Hinoat): Evidence that Glutelins are a Minor Component. Canadian Institute of Food Science and Technology Journal 1983, 16, 196-200.
14. Ma, C.Y.; Harwalkar, V.R. Chemical characterization and functionality assessment of oat protein fractions. J. Agric. Food Chem. 1984, 32, 144-149.
15. Peterson, D.M. Subunit structure and composition of oat seed globulin. Plant Physiol. 1978, 62,
506-509.
170
16. Klose, C.; Arendt, E.K. Proteins in Oats; their Synthesis and Changes during Germination: A Review. Critical Reviews in Food Science & Nutrition 2012, 52, 629-639.
17. Burgess, S.; Shewry, P.; Matlashewski, G.; Altosaar, I.; Miflin, B. Characteristics of oat (Avena
sativa L.) seed globulins. J. Exp. Bot. 1983, 34, 1320-1332.
18. Muench, D.G.; Okita, T.W. The storage proteins of rice and oat, In Cellular and molecular biology of plant seed development, Anonymous ; Springer: 1997; pp. 289-330.
19. Liu, G.; Chen, J.; Liu, Y.; Huang, Q.; Li, J.; Shi, K.; Wang, S. Composition, Secondary Structure,
and Self-Assembly of Oat Protein Isolate [electronic resource]. J. Agric. Food Chem. 2009, 57, 4552-
4558.
20. Kinsella, J.E. Functional properties of proteins: Possible relationships between structure and function in foams. Food Chem. 1981, 7, 273-288.
21. Kinsella, J.E.; Melachouris, N. Functional properties of proteins in foods: a survey. Critical Reviews in Food Science & Nutrition 1976, 7, 219-280.
22. Mleko, S.; Tomczyńska-Mleko, M.; Targoński, Z. Globular protein gels as carriers of active
substances. Agro Food Ind.Hi-Tech 2010, 21, 14-16.
23. Banerjee, S.; Bhattacharya, S. Food gels: gelling process and new applications. Crit. Rev. Food Sci. Nutr. 2012, 52, 334-346.
24. Foegeding, E.A.; Davis, J.P. Food protein functionality: A comprehensive approach. Food Hydrocoll. 2011, 25, 1853-1864.
25. Totosaus, A.; Montejano, J.G.; Salazar, J.A.; Guerrero, I. A review of physical and chemical protein‐ gel induction. Int. J. Food Sci. Tech. 2002, 37, 589-601.
26. Phillips, L.G.; Whitehead, D.M.; Kinsella, J. CHAPTER 9 - Protein Gelation, In Structure–
Function Properties of Food Proteins, Kinsella, L.G.P.M.W., Ed.; Academic Press: Boston, 1994; pp. 179-204.
27. Lefevre, T.; Subirade, M. Molecular differences in the formation and structure of fine‐ stranded and particulate β‐ lactoglobulin gels. Biopolymers 2000, 54, 578-586.
28. Ross-Murphy, S.B. Rheological Characterisation of Gels1. J. Texture Stud. 1995, 26, 391-400.
29. Clark, A.; Judge, F.; Richards, J.; Stubbs, J.; Suggett, A. ELECTRON MICROSCOPY OF
NETWORK STRUCTURES IN THERMALLY‐ INDUCED GLOBULAR PROTEIN GELS. Int. J. Pept. Protein Res. 1981, 17, 380-392.
30. Morris, V.J. Gels. The chemical physics of food 2007, 151-198.
31. Puppo, M.C.; Añón, M.C. Structural properties of heat-induced soy protein gels as affected by ionic strength and pH. J. Agric. Food Chem. 1998, 46, 3583-3589.

171
32. Clark, A.H.; Kavanagh, G.M.; Ross-Murphy, S.B. Globular protein gelation—theory and experiment. Food Hydrocoll. 2001, 15, 383-400.
33. van Vliet, T. Structure and rheology of gels formed by aggregated protein particles, In
Hydrocolloids, Nishinari, K., Ed.; New York, Elsevier Science: 2000; pp. 367-377.
34. Clark, A.H. Gels and gelling. Physical chemistry of foods 1992, 7, 263-305.
35. Schmitt, C.; Sanchez, C.; Desobry-Banon, S.; Hardy, J. Structure and technofunctional properties of protein-polysaccharide complexes: a review. Crit. Rev. Food Sci. Nutr. 1998, 38, 689-753.
36. Bryant, C.M.; McClements, D.J. Molecular basis of protein functionality with special
consideration of cold-set gels derived from heat-denatured whey. Trends Food Sci. Technol. 1998, 9,
143-151.
37. Phillips, L.G.; Whitehead, D.M.; Kinsella, J. CHAPTER 2 - Protein Stability, In Structure–
Function Properties of Food Proteins, Kinsella, L.G.P.M.W., Ed.; Academic Press: Boston, 1994; pp. 25-61.
38. McClements, D.J. Non-covalent interactions between proteins and polysaccharides. Biotechnol.
Adv. 2006, 24, 621-625.
39. Semenova, M.G.; Dickinson, E.; Burlakova, E.B.; Zaikov, G.E. Biopolymers in food colloids : thermodynamics and molecular interactions. Leiden ; Boston : Brill, 2010: 2010;
40. McClements, D.J. Food emulsions [electronic resource] : principles, practices, and techniques / David Julian McClements. Boca Raton : CRC Press, c2005; 2nd ed: 2005;
41. Jones, O.G.; McClements, D.J. Functional biopolymer particles: design, fabrication, and applications. Comprehensive Reviews in Food Science and Food Safety 2010, 9, 374-397.
42. de Jongh, H.H.J. Protein in food microstructure formation, In Understanding and controlling the
microstructure of complex foods, McClements, D.J., Ed.; Boca Raton : CRC Press ; Cambridge, England : Woodhead Pub., 2007: 2007;
43. Zhao, G.; Liu, Y.; Zhao, M.; Ren, J.; Yang, B. Enzymatic hydrolysis and their effects on
conformational and functional properties of peanut protein isolate. Food Chem. 2011, 127, 1438-
1443.
44. Liu, Q.; Kong, B.; Xiong, Y.L.; Xia, X. Antioxidant activity and functional properties of porcine
plasma protein hydrolysate as influenced by the degree of hydrolysis. Food Chem. 2010, 118, 403-410.
45. Chin, K.B.; Go, M.Y.; Xiong, Y.L. Konjac flour improved textural and water retention properties
of transglutaminase-mediated, heat-induced porcine myofibrillar protein gel: Effect of salt level and transglutaminase incubation. Meat Sci. 2009, 81, 565-572.
46. Li, Y.; Lu, F.; Luo, C.; Chen, Z.; Mao, J.; Shoemaker, C.; Zhong, F. Functional properties of the Maillard reaction products of rice protein with sugar. Food Chem. 2009, 117, 69-74.

172
47. Mirmoghtadaie, L.; Kadivar, M.; Shahedi, M. Effects of succinylation and deamidation on functional properties of oat protein isolate. Food Chem. 2009, 114, 127-131.
48. Liu, J.; Zhu, K.; Ye, T.; Wan, S.; Wang, Y.; Wang, D.; Li, B.; Wang, C. Influence of konjac
glucomannan on gelling properties and water state in egg white protein gel. Food Res. Int. 2013, 51, 437-443.
49. Fitzsimons, S.M.; Mulvihill, D.M.; Morris, E.R. Large enhancements in thermogelation of whey
protein isolate by incorporation of very low concentrations of guar gum. Food Hydrocoll. 2008, 22,
576-586.
50. Bertrand, M.; Turgeon, S.L. Improved gelling properties of whey protein isolate by addition of xanthan gum. Food Hydrocoll. 2007, 21, 159-166.
51. Turgeon, S.L.; Beaulieu, M. Improvement and modification of whey protein gel texture using polysaccharides. Food Hydrocoll. 2001, 15, 583-591.
52. Li-Chan, E.C.Y. Properties of proteins in food systems: an introduction, In Proteins in Food
Processing, Yada, R.Y., Ed.; Woodhead Publishing: 2004; pp. 6-25.
53. Phillips, L.G.; Whitehead, D.M.; Kinsella, J. CHAPTER 10 - Modification Reactions and Protein
Structure, In Structure–Function Properties of Food Proteins, Kinsella, L.G.P.M.W., Ed.; Academic Press: Boston, 1994; pp. 207-232.
54. Caillard, R.; Boutin, Y.; Subirade, M. Characterization of succinylated β-lactoglobulin and its
application as the excipient in novel delayed release tablets. Int. Dairy J. 2011, 21, 27-33.
55. Pinto Ramos, C.M.; Bora, P.S. Functionality of succinylated Brazil nut (Bertholletia excelsa
HBK) kernel globulin. Plant Foods for Human Nutrition 2005, 60, 1-6.
56. Ma -Y., C.; Wood F., D. Functional properties of oat protein modified by acylation, trypsin hydrolysis or linoleate treatment. J. Am. Oil Chem. Soc. 1987, 64, 1726-1731.
57. Gruener, L.; Ismond, M.A.H. Effects of acetylation and succinylation on the functional properties of the canola 12S globulin. Food Chem. 1997, 60, 513-520.
58. Hamada, J.S.; Swanson, B. Deamidation of food proteins to improve functionality. Critical
Reviews in Food Science & Nutrition 1994, 34, 283-292.
59. Dimitrijev-Dwyer, M.; He, L.; James, M.; Nelson, A.; Wang, L.; Middelberg, A.P. The effects of
acid hydrolysis on protein biosurfactant molecular, interfacial, and foam properties: pH responsive protein hydrolysates. Soft Matter 2012, 8, 5131-5139.
60. Cabra, V.; Arreguin, R.; Vazquez-Duhalt, R.; Farres, A. Effect of alkaline deamidation on the
structure, surface hydrophobicity, and emulsifying properties of the Z19 α-zein. J. Agric. Food Chem. 2007, 55, 439-445.
173
61. Lei, L.; Zhao, Q.; Selomulya, C.; Xiong, H. The effect of deamidation on the structural,
functional, and rheological properties of glutelin prepared from Akebia trifoliata var. australis seed.
Food Chem. 2015, 178, 96-105.
62. Ma, C.; Khanzada, G. Functional properties of deamidated oat protein isolates. J. Food Sci. 1987,
52, 1583-1587.
63. Matheis, G. Phosphorylation of food proteins with phosphorus oxychloride—Improvement of functional and nutritional properties: A review. Food Chem. 1991, 39, 13-26.
64. Matheis, G.; Whitaker, J.R. Chemical phosphorylation of food proteins: an overview and a
prospectus. J. Agric. Food Chem. 1984, 32, 699-705.
65. Vojdani, F.; Whitaker, J.R. Phosphorylation of proteins and their functional and structural
properties, In Macromolecular interactions in food technology, Parris, N., Kato, A., Creamer, L.K. and Pearce, J., Eds.; Washington, DC : American Chemical Society, c1996: 1996;
66. Li, C.; Ibrahim, H.R.; Sugimoto, Y.; Hatta, H.; Aoki, T. Improvement of functional properties of
egg white protein through phosphorylation by dry-heating in the presence of pyrophosphate. J. Agric. Food Chem. 2004, 52, 5752-5758.
67. Li, C.P.; Enomoto, H.; Ohki, S.; Ohtomo, H.; Aoki, T. Improvement of Functional Properties of
Whey Protein Isolate Through Glycation and Phosphorylation by Dry Heating. J. Dairy Sci. 2005, 88,
4137-4145.
68. Li, C.; Enomoto, H.; Hayashi, Y.; Zhao, H.; Aoki, T. Recent advances in phosphorylation of food proteins: A review. LWT - Food Science and Technology 2010, 43, 1295-1300.
69. Oliver, C.M.; Melton, L.D.; Stanley, R.A. Creating proteins with novel functionality via the Maillard reaction: a review. Crit. Rev. Food Sci. Nutr. 2006, 46, 337-350.
70. Chevalier, F.; Chobert, J.; Popineau, Y.; Nicolas, M.G.; Haertlé, T. Improvement of functional
properties of β-lactoglobulin glycated through the Maillard reaction is related to the nature of the
sugar. Int. Dairy J. 2001, 11, 145-152.
71. Chobert, J. Milk protein modification to improve functional and biological properties. Adv. Food Nutr. Res. 2003, 47, 1-71.
72. Oliver, C.M.; Melton, L.D.; Stanley, R.A. Functional properties of caseinate glycoconjugates prepared by controlled heating in the ‘dry’state. J. Sci. Food Agric. 2006, 86, 732-740.
73. Liu, J.; Ru, Q.; Ding, Y. Glycation a promising method for food protein modification:
Physicochemical properties and structure, a review. Food Res. Int. 2012, 49, 170-183.
74. Junfeng, F.; Yanyan, Z.; Szesze, T.; Fengjuan, L.; Manyu, Z.; Saito, M.; Tatsumi, E.; Lite, L.
Improving functional properties of soy protein hydrolysate by conjugation with curdlan. J. Food Sci. 2006, 71, C285-C291.

174
75. Liu, G.; Zhong, Q. Thermal aggregation properties of whey protein glycated with various saccharides. Food Hydrocoll. 2013, 32, 87-96.
76. Jing, H.; Kitts, D.D. Chemical and biochemical properties of casein–sugar Maillard reaction
products. Food and Chemical Toxicology 2002, 40, 1007-1015.
77. Spotti, M.J.; Perduca, M.J.; Piagentini, A.; Santiago, L.G.; Rubiolo, A.C.; Carrara, C.R. Gel
mechanical properties of milk whey protein–dextran conjugates obtained by Maillard reaction. Food Hydrocoll. 2013, 31, 26-32.
78. Sun, Y.; Hayakawa, S.; Izumori, K. Modification of ovalbumin with a rare ketohexose through
the Maillard reaction: effect on protein structure and gel properties. J. Agric. Food Chem. 2004, 52, 1293-1299.
79. Cabodevila O.; Hill S.E.; Armstrong H.J.; de, S.I.; Mitchell J.R. Gelation enhancement of soy
protein isolate using the Maillard reaction and high temperatures<br />. J. Food Sci. 1994, 59, 872-
875.
80. McDonald, J.K. An overview of protease specificity and catalytic mechanisms: aspects related to nomenclature and classification. Histochem. J. 1985, 17, 773-785.
81. Whitaker, J.R. Factors affecting enzyme activity in foods, In Proteins in Food Processing<br />, Yada, R.Y., Ed.; Woodhead Publishing, Limited: 2004;
82. Dutta, R. Fundamentals of biochemical engineering. New Delhhi: Ane Books India.: 2008;
83. Aguilera, J.M.; Rademacher, B. Protein gels. Proteins in Food Processing 2004, 468-482.
84. DeJong, G.; Koppelman, S. Transglutaminase catalyzed reactions: impact on food applications. J. Food Sci. 2002, 67, 2798-2806.
85. Ohtsuka, T.; Umezawa, Y.; Nio, N.; Kubota, K. Comparison of deamidation activity of
transglutaminases. J. Food Sci. 2001, 66, 25-29.
86. Pinterits, A.; Arntfield, S.D. Improvement of canola protein gelation properties through enzymatic modification with transglutaminase. LWT-food Science and Technology 2008, 41, 128-138.
87. Jiang, S.; Zhao, X. Transglutaminase-induced cross-linking and glucosamine conjugation in
soybean protein isolates and its impacts on some functional properties of the products. European
Food Research and Technology 2010, 231, 679-689.
88. Siu, N.; Ma, C.; Mock, W.; Mine, Y. Functional properties of oat globulin modified by a calcium-independent microbial transglutaminase. J. Agric. Food Chem. 2002, 50, 2666-2672.
89. Tang, C.; Wu, H.; Chen, Z.; Yang, X. Formation and properties of glycinin-rich and β-
conglycinin-rich soy protein isolate gels induced by microbial transglutaminase. Food Res. Int. 2006,
39, 87-97.
175
90. Sun, X.D.; Arntfield, S.D. Gelation properties of salt-extracted pea protein isolate catalyzed by microbial transglutaminase cross-linking. Food Hydrocoll. 2011, 25, 25-31.
91. Prieto, C.A.; Guadix, E.M.; Guadix, A. Recent Patents on Whey Protein Hydrolysates
Manufactured by Proteolysis Coupled to Membrane Ultrafiltration. Recent Patents on Chemical Engineering 2010, 3, 115-128.
92. Qi, W.; He, Z. Enzymatic hydrolysis of protein: Mechanism and kinetic model. Frontiers of Chemistry in China 2006, 1, 308.
93. Korhonen, H.; Tupasela, T.; Rantamaki, P.; Pihlanto-Leppala, A. Impact of processing on
bioactive proteins and peptides. Trends Food Sci. Technol. 1998, 9, 307-319.
94. Adler-Nissen, J. Ezymic hydrolysis of food proteins. Elsevier Applied Science Publishers: 1986;
95. Rutherfurd, S.M. Methodology for determining degree of hydrolysis of proteins in Hydrolysates: a review. J. AOAC Int. 2010, 93, 1515-1522.
96. Benitez, R.; Ibarz, A.; Pagan, J. Protein hydrolysates: processes and applications. Acta Bioquim. Clin. Latinoam. 2008, 42, 227-236.
97. Pinterits, A.; Arntfield, S.D. The effect of limited proteolysis on canola protein gelation. Food
Chem. 2007, 102, 1337-1343.
98. Hou, Y.; Zhao, X. Limited hydrolysis of two soybean protein products with trypsin or neutrase
and the impacts on their solubility, gelation and fat absorption capacity. Biotechnology 2011, 10, 190-196.
99. Yeom, H.; Lee, E.; Ha, M.; Ha, S.; Bae, D. Production and physicochemical properties of rice
bran protein isolates prepared with autoclaving and enzymatic hydrolysis. Journal of the Korean
Society for Applied Biological Chemistry 2010, 53, 62-70.
100. Sanchez, A.C.; Burgos, J. Factors affecting the gelation properties of hydrolyzed sunflower proteins. J. Food Sci. 1997, 62, 284-288.
101. Mannheim, A.; Cheryan, M. Continuous hydrolysis of milk protein in a membrane reactor. J. Food Sci. 1990, 55, 381-385.
102. Pinelo, M.; Jonsson, G.; Meyer, A.S. Membrane technology for purification of enzymatically
produced oligosaccharides: Molecular and operational features affecting performance. Sep. Purif. Technol. 2009, 70, 1-11.
103. Rios, G.M.; Belleville, M.P.; Paolucci, D.; Sanchez, J. Progress in enzymatic membrane reactors – a review. J. Membr. Sci. 2004, 242, 189-196.
104. Wöltinger, J.; Karau, A.; Leuchtenberger, W.; Drauz, K. Membrane reactors at Degussa. Adv.
Biochem. Eng. Biotechnol. 2005, 92, 289-316.

176
105. Akpinar-Bayizit, A.; Ozcan, T.; Yilmaz-Ersan, L. Membrane processes in production of functional whey components. Mljekarstvo / Dairy 2009, 59, 282-288.
106. Bazinet, L.; Firdaous, L. Membrane processes and devices for separation of bioactive peptides.
Recent Pat Biotechnol 2009, 3, 61-72.
107. Dewettinck, K.; Le, T.T. Membrane Separation in Food Processing<br />, In Alternatives to
conventional food processing, Proctor, A. and Royal Society of Chemistry (Great Britain), Eds.; Cambridge: Royal Society of Chemistry.: 2010;
108. Chen, J.P.; Mou, H.; Wang, L.K.; Matsuura, T. Membrane Filtration, In Advanced
physicochemical treatment processes, Wang, L.K., Hung, Y.-. and Shammas, N.K., Eds.; Humana Press: Totowa, N.J., 2007;
109. Wei, J.; Chiang, B. Bioactive peptide production by hydrolysis of porcine blood proteins in a continuous enzymatic membrane reactor [electronic resource]. J. Sci. Food Agric. 2009, 89, 372-378.
110. Chiang, W.; Tsou, M.; Tsai, Z.; Tsai, T. Angiotensin I-converting enzyme inhibitor derived from
soy protein hydrolysate and produced by using membrane reactor. Food Chem. 2006, 98, 725-732.
111. Kapel, R.; Rahhou, E.; Lecouturier, D.; Guillochon, D.; Dhulster, P. Characterization of an
antihypertensive peptide from an Alfalfa white protein hydrolysate produced by a continuous enzymatic membrane reactor. Process Biochemistry 2006, 41, 1961-1966.
112. Huang, W.; Sun, J.; He, H.; Dong, H.; Li, J. Antihypertensive effect of corn peptides, produced
by a continuous production in enzymatic membrane reactor, in spontaneously hypertensive rats. Food Chem. 2011, 128, 968-973.
113. Chiang, W.-.; Shih, C.-.; Chu, Y.-. Functional properties of soy protein hydrolysate produced from a continuous membrane reactor system. Food Chem. 1999, 65, 189-194.
114. Conidi, C.; Cassano, A.; Drioli, E. A membrane-based study for the recovery of polyphenols from bergamot juice. J. Membr. Sci. 2011, 375, 182-190.
115. Tessier, B.; Harscoat-Schiavo, C.; Marc, I. Selective separation of peptides contained in a
rapeseed (Brassica campestris L.) protein hydrolysate using UF/NF membranes. J. Agric. Food Chem. 2006, 54, 3578-3584.
116. Cummings, J.; Stephen, A. Carbohydrate terminology and classification. Eur. J. Clin. Nutr. 2007, 61, S5-S18.
117. Morris, V. Polysaccharides: their role in food microstructure. In Understanding and controlling
the microstructure of complex foods, McClements, D., Ed.; Woodhead Publishing Ltd: 2007; pp. 3-39.
118. de Jong, S.; van de Velde, F. Charge density of polysaccharide controls microstructure and large deformation properties of mixed gels. Food Hydrocoll. 2007, 21, 1172-1187.

177
119. Morris, E.R. Functional interactions in gelling biopolymer mixtures, In Modern Biopolymer Science, Kasapis, S., Norton, I.T. and Ubbink, J.B., Eds.;2009; pp. 167-198.
120. Tolstoguzov, V. Ingredient interactions in complex foods: aggregation and phase separation. In
Understanding and controlling the microstructure of complex foods , McClements, D., Ed.; Woodhead Publishing in Food Science, Technology and Nutrition: 2007; pp. 185-206.
121. Tolstoguzov, V. Functional properties of food proteins and role of protein-polysaccharide interaction. Food Hydrocoll. 1991, 4, 429-468.
122. De Kruif, C.; Tuinier, R. Polysaccharide protein interactions. Food Hydrocoll. 2001, 15, 555-
563.
123. Dickinson, E. Hydrocolloids at interfaces and the influence on the properties of dispersed systems. Food Hydrocoll. 2003, 17, 25-39.
124. Turgeon, S.; Beaulieu, M.; Schmitt, C.; Sanchez, C. Protein–polysaccharide interactions: phase-
ordering kinetics, thermodynamic and structural aspects. Current opinion in colloid & interface
science 2003, 8, 401-414.
125. Doublier, J.; Garnier, C.; Renard, D.; Sanchez, C. Protein–polysaccharide interactions. Current Opinion in Colloid & Interface Science 2000, 5, 202-214.
126. Ghosh, A.K.; Bandyopadhyay, P. Polysaccharide-Protein Interactions and Their Relevance in Food Colloids, In The Complex World of Polysaccharides, Karunaratne, D.N., Ed.;2012; pp. 395-406.
127. Turgeon, S.; Schmitt, C.; Sanchez, C. Protein–polysaccharide complexes and coacervates. Current Opinion in Colloid & Interface Science 2007, 12, 166-178.
128. Clark, A. Mixed biopolymer gelation: a route to versatile soft solids and complex gel
microstructure, In Gums and Stabilisers for the Food Industry 13, Williams, P.A. and Phillips, G.O., Eds.; Royal Society of Chemistry: Cambridge, 2006;
129. Morris, V. Multicomponent gels, In Gums and Stabilisers for the Food Industry 3, Phillips, G., Wedloc, D. and williams, P., Eds.; Elsevier Applied Science: London, 1986; Vol.3 pp. 87-99.
130. Zasypkin, D.; Braudo, E.; Tolstoguzov, V. Multicomponent biopolymer gels. Food Hydrocoll.
1997, 11, 159-170.
131. Corredig, M.; Sharafbafi, N.; Kristo, E. Polysaccharide–protein interactions in dairy matrices, control and design of structures. Food Hydrocoll. 2011, 25, 1833-1841.
132. Laneuville, S.I.; Turgeon, S.L.; Sanchez, C.; Paquin, P. Gelation of native β-lactoglobulin induced by electrostatic attractive interaction with xanthan gum. Langmuir 2006, 22, 7351-7357.
133. Almrhag, O.; George, P.; Bannikova, A.; Katopo, L.; Chaudhary, D.; Kasapis, S. Investigation
on the phase behaviour of gelatin/agarose mixture in an environment of reduced solvent quality. Food Chem. 2013, 136, 835-842.
178
134. Croguennoc, P.; Nicolai, T.; Durand, D.; Clark, A. Phase separation and association of globular
protein aggregates in the presence of polysaccharides: 2. Heated mixtures of native β-lactoglobulin
and κ-carrageenan. Langmuir 2001, 17, 4380-4385.
135. Cheatham, R. Protein : A Plant-based look at this Power Macronutrients. 2014,
136. Agriculture & Agri-Food Canada Value-added soy protein. [electronic resource]. Ottawa] : Agriculture and Agri-food Canada, c2009: 2009;
137. Poysa, V.; Woodrow, L.; Yu, K. Effect of soy protein subunit composition on tofu quality. Food Res. Int. 2006, 39, 309-317.
138. Kinsella, J.E. Functional properties of soy proteins. Journal of the American Oil Chemists’
Society 1979, 56, 242-258.
139. Day, L.; Augustin, M.A.; Batey, I.L.; Wrigley, C.W. Wheat-gluten uses and industry needs. Trends Food Sci. Technol. 2006, 17, 82-90.
140. Braaten, J.T.; Wood, P.J.; Scott, F.W.; Wolynetz, M.S.; Lowe, M.K.; Bradley-White, P.; Collins,
M.W. Oat beta-glucan reduces blood cholesterol concentration in hypercholesterolemic subjects. Eur.
J. Clin. Nutr. 1994, 48, 465-474.
141. J Wood, P.; Braaten, J.T.; Scott, F.W.; Riedel, K.D.; Wolynetz, M.S.; Collins, M.W. Effect of
dose and modification of viscous properties of oat gum on plasma glucose and insulin following an oral glucose load. Br. J. Nutr. 1994, 72, 731-743.
142. Inglett, G.; Stevenson, D.; Lee, S.; Hamaker, B. Converting oats to high-fibre products for use in functional foods. Techonology of functional cereal products 2008, 476-494.
143. Mohamed, A.; Biresaw, G.; Xu, J.; Hojilla-Evangelista, M.P.; Rayas-Duarte, P. Oats protein
isolate: thermal, rheological, surface and functional properties. Food Res. Int. 2009, 42, 107-114.
144. Ma, C.Y.; Khanzada, G.; Harwalkar, V.R. Thermal gelation of oat globulin. J. Agric. Food Chem. 1988, 36, 275-280.
145. Ma, C.; Harwalkar, V. Thermal Coagulation of Oat Globulin1. Cereal Chem. 1987, 64, 212-218.
146. Mannheim, A.; Cheryan, M. Enzyme-modified proteins from corn gluten meal: preparation and functional properties. Journal of the American Oil Chemists Society 1992, 69, 1163-1169.
147. Pouliot, Y. Membrane processes in dairy technology—From a simple idea to worldwide
panacea. Int. Dairy J. 2008, 18, 735-740.
148. Garcia, M.; Forbe, T.; Gonzalez, E. Potential applications of nanotechnology in the agro-food sector. Ciencia Tecnol. Alime. 2010, 30, 573-581.
149. Thassu, D.; Pathak, Y.; Deleers, M. Nanoparticulate Drug-Delivery Systems: An Overview. Drugs Pharm. Sci. 2007, 166, 1-32.

179
150. Moraru, C.I.; Panchapakesan, C.P.; Huang, Q.; Takhistov, P.; Liu, S.; Kokini, J.L. Nanotechnology: A New Frontier in Food Science. Food Technol. 2003, 57, 24-29.
151. Swanson, J.E. Encyclopedia of Food and Culture; Bioactive Food Components, In Solomon,
H.K., Ed.; Charles Scribner's Sons: New York, 2003; Vol.1 pp. 201-205.
152. Kuo, P. The Application of Nanotechnology to Functional Foods and Nutraceuticals to Enhance
Their Bioactivities, In Biotechnology in Functional Foods and Nutraceuticals, Debasis, B., Francis, L. and Dilip, K.G., Eds.; CRC Press: 2010; pp. 447-462.
153. Chen, L.Y.; Remondetto, G.E.; Subirade, M. Food protein-based materials as nutraceutical
delivery systems. Trends Food Sci. Technol. 2006, 17, 272-283.
154. Jones, O.G.; McClements, D.J. Functional Biopolymer Particles: Design, Fabrication, and Applications. Comp. Rev. Food Sci. F. 2010, 9, 374-397.
155. Peters, R.; Dam, G.t.; Bouwmeester, H.; Helsper, H.; Allmaier, G.; Kammer, F.v.; Ramsch, R.;
Solans, C.; Tomaniová, M.; Hajslova, J.; Weigel, S. Identification and characterization of organic
nanoparticles in food. TrAC 2011, 30, 100-112.
156. Pisal, D.S.; Kosloski, M.P.; Balu-Iyer, S.V. Delivery of therapeutic proteins. J. Pharm. Sci. 2010, 99, 2557-2575.
157. Mozafari, M.R. Nanoliposomes: preparation and analysis. Methods Mol. Biol. 2010, 605, 29-50.
158. Bunjes, H. Lipid nanoparticles for the delivery of poorly water-soluble drugs. J. Agric. Food Chem. 2010, 62, 1637-1645.
159. Souto, E.B.; Müller, R.H. Applications of Lipid Nanoparticles (SLN and NLC) in Food Industry. J. Food Technol. 2006, 4, 90-95.
160. Shidhaye, S.S.; Vaidya, R.; Sutar, S.; Patwardhan, A.; Kadam, V.J. Solid Lipid Nanoparticles
and Nanostructured Lipid Carriers -- Innovative Generations of Solid Lipid Carriers. Curr. Drug Del. 2008, 5, 324-331.
161. Shukat, R.; Relkin, P. Lipid nanoparticles as vitamin matrix carriers in liquid food systems: On
the role of high-pressure homogenisation, droplet size and adsorbed materials. Coll. Surf. B 2011,
86, 119-124.
162. Hentschel, A.; Gramdorf, S.; Muller, R.H.; Kurz, T. beta-Carotene-loaded nanostructured Lipid carriers. J. Food Sci. 2008, 73, N1-N6.
163. Muchow, M.; Schmitz, E.I.; Despatova, N.; Maincent, P.; Müller,R.H. Omega-3 fatty acids-
loaded lipid nanoparticles for patient-convenient oral bioavailability enhancement. Pharmazie 2009,
64, 499-504.
164. Bengoechea, C.; Peinado, I.; McClements, D.J. Formation of protein nanoparticles by controlled
heat treatment of lactoferrin: Factors affecting particle characteristics. Food Hydrocoll. 2011, 25, 1354-1360.
180
165. Ron, N.; Zimet, P.; Bargarum, J.; Livney, Y.D. Beta-lactoglobulin–polysaccharide complexes as
nanovehicles for hydrophobic nutraceuticals in non-fat foods and clear beverages. Int. Dairy J. 2010,
20, 686-693.
166. Augustin, M.A.; Hemar, Y. Nano- and micro-structured assemblies for encapsulation of food ingredients. Chem. Soc. Rev. 2009, 38, 902-912.
167. Sanguansri, P.; Augustin, M.A. Nanoscale materials development – a food industry perspective. Trends Food Sci. Technol. 2006, 17, 547-556.
168. Graveland-Bikker, J.F.; Schaap, I.A.T.; Schmidt, C.F.; De Kruif, C.G. Structural and mechanical
study of a self-assembling protein nanotube. Nano Letters 2006, 6, 616-621.
169. Livney, Y.D. Milk proteins as vehicles for bioactives. Curr. Opin. Colloid In. 2010, 15, 73-83.
170. Donsi, F.; Senatore, B.; Huang, Q.R.; Ferrari, G. Development of Novel Pea Protein-Based Nanoemulsions for Delivery of Nutraceuticals. J. Agric. Food Chem. 2010, 58, 10653-10660.
171. Podaralla, S.; Perumal, O. Preparation of zein nanoparticles by pH controlled nanoprecipitation. J. Biomed. Nanotechnol. 2010, 6, 312-317.
172. Liu, Z.; Jiao, Y.; Wang, Y.; Zhou, C.; Zhang, Z. Polysaccharides-based nanoparticles as drug
delivery systems. Adv. Drug Deliv. Rev. 2008, 60, 1650-1662.
173. Augustin, M.A.; Sanguansri, P. Chapter 5 Nanostructured Materials in the Food Industry, In
Advances in Food and Nutrition Research, Steve L. Taylor, Ed.; Academic Press: 2009; Vol.Volume 58 pp. 183-213.
174. Jones, O.G.; Decker, E.A.; McClements, D.J. Comparison of protein–polysaccharide
nanoparticle fabrication methods: Impact of biopolymer complexation before or after particle
formation. J. Colloid Interface Sci. 2010, 344, 21-29.
175. Matalanis, A.; Jones, O.G.; McClements, D.J. Structured biopolymer-based delivery systems for
encapsulation, protection, and release of lipophilic compounds. Food Hydrocoll. In Press, Corrected Proof,
176. Muthukumarappan, K.; Marella, C. Membrane Processing, In Mathematical Modeling of Food
Processing, Farid, M.M., Ed.; CRC Press: 2010; pp. 735-758.
177. Goncharuk, V.V.; Kavitskaya, A.A.; Skil’skaya, M.D. Nanofiltration in Drinking Water Supply. J. Water Chem. Techno+ 2011, 33, 37-54.
178. Darnoko, D.; Cheryan, M. Carotenoids from Red Palm Methyl Esters by Nanofiltration. J. Am. Oil Chem. Soc. 2006, 83, 365-370.
179. Giorno, L.; Drioli, E. Biocatalytic membrane reactors: applications and perspectives. Trends
Biotechnol. 2000, 18, 339-349.
181
180. Suárez, E.; Lobo, A.; Alvarez, S.; Riera, F.A.; Álvarez, R. Demineralization of whey and milk ultrafiltration permeate by means of nanofiltration. Desalination 2009, 241, 272-280.
181. Vandanjon, L.; Johannsson, R.; Derouiniot, M.; Bourseau, P.; Jaouen, P. Concentration and
purification of blue whiting peptide hydrolysates by membrane processes. J. Food Eng. 2007, 83, 581-589.
182. Benedetti, S.; Prudêncio, E.S.; Mandarino, J.M.G.; Rezzadori, K.; Petrus, J.C.C. Concentration
of soybean isoflavones by nanofiltration and the effects of thermal treatments on the concentrate.
Food Res. Int. In Press, Corrected Proof,
183. Negrão Murakami, A.N.; de Mello Castanho Amboni,Renata Dias; Prudêncio, E.S.; Amante,
E.R.; de Moraes Zanotta, L.; Maraschin, M.; Cunha Petrus, J.C.; Teófilo, R.F. Concentration of
phenolic compounds in aqueous mate (Ilex paraguariensis A. St. Hil) extract through nanofiltration.
LWT - Food Science and Technology 2011, 44, 2211-2216.
184. Walha, K.; Ben Amar, R.; Massé, A.; Bourseau, P.; Cardinal, M.; Cornet, J.; Prost, C.; Jaouen,
P. Aromas potentiality of tuna cooking juice concentrated by nanofiltration. LWT - Food Science and Technology 2011, 44, 153-157.
185. Couto, D.S.; Dornier, M.; Pallet, D.; Reynes, M.; Dijoux, D.; Freitas, S.P.; Cabral, L.M.C.
Evaluation of nanofiltration membranes for the retention of anthocyanins of açai (Euterpe oleracea Mart.) juice. Desalination & Water Treatment 2011, 27, 108-113.
186. Kuhn, R.C.; Maugeri Filho, F.; Silva, V.; Palacio, L.; Hernández, A.; Prádanos, P. Mass transfer
and transport during purification of fructooligosaccharides by nanofiltration. J. Membr. Sci. 2010,
365, 356-365.
187. Takacs, L.; Korany, K.; Vatai, G. Process Modelling in the Production of Low Alcohol Content
Wines by Direct Concentration and Diafiltration using Nanofiltration Membranes. Acta Aliment. 2010, 39, 397-412.
188. Sabaté, J.; Labanda, J.; Llorens, J. Nanofiltration of biogenic amines in acidic conditions: Influence of operation variables and modeling. J. Membr. Sci. 2008, 310, 594-601.
189. Pan, K.; Song, Q.; Wang, L.; Cao, B. A study of demineralization of whey by nanofiltration
membrane. Desalination 2011, 267, 217-221.
190. Coral, L.A.; de, O.P.; Bassetti, F.d.J.; Lapolli, F.R. Nanofiltration membranes applied to the removal of saxitoxin and congeners. Desalination & Water Treatment 2011, 27, 8-17.
191. Tylkowski, B.; Tsibranska, I.; Kochanov, R.; Peev, G.; Giamberini, M. Concentration of
biologically active compounds extracted from Sideritis ssp. L. by nanofiltration. Food Bioprod.
Process. 2010, In Press, Corrected Proof,
192. Sereewatthanawut, I.; Baptista, I.I.R.; Boam, A.T.; Hodgson, A.; Livingston, A.G. Nanofiltration process for the nutritional enrichment and refining of rice bran oil. J. Food Eng. 2011, 102, 16-24.
182
193. Botelho-Cunha, V.A.; Mateus, M.; Petrus, J.C.C.; de Pinho, M.N. Tailoring the enzymatic
synthesis and nanofiltration fractionation of galacto-oligosaccharides. Biochem. Eng. J. 2010, 50, 29-
36.
194. Feng, Y.M.; Chang, X.L.; Wang, W.H.; Ma, R.Y. Separation of galacto-oligosaccharides mixture by nanofiltration. JTICE 2009, 40, 326-332.
195. Barile, D.; Tao, N.; Lebrilla, C.B.; Coisson, J.; Arlorio, M.; German, J.B. Permeate from cheese whey ultrafiltration is a source of milk oligosaccharides. Int. Dairy J. 2009, 19, 524-530.
196. Martinez-Ferez, A.; Guadix, A.; Zapata-Montoya, J.E.; Guadix, E.M. Influence of
transmembrane pressure on the separation of caprine milk oligosaccharides from protein by cross-flow ultrafiltration. Int J. Dairy Technol. 2008, 61, 333-339.
197. Vegas, R.; Moure, A.; Domínguez, H.; Parajó, J.C.; Alvarez, J.R.; Luque, S. Evaluation of ultra-
and nanofiltration for refining soluble products from rice husk xylan. Bioresour. Technol. 2008, 99,
5341-5351.
198. Wang, L.; Shao, C.; Wang, H. Nanofiltration continuous process control: recovery of
oligosaccharides from streamed soybean waste water. Membrane Science and Technology -Lanzhou- 2009, 29, 79-82.
199. Gullón, B.; Gullón, P.; Sanz, Y.; Alonso, J.L.; Parajó, J.C. Prebiotic potential of a refined
product containing pectic oligosaccharides. Food Sci. Technol. LWT 2011, 44, 1687-1696.
200. Gullón, P.; González-Muñoz, M.J.; Domínguez, H.; Parajó, J.C. Membrane processing of liquors from Eucalyptus globulus autohydrolysis. J. Food Eng. 2008, 87, 257-265.
201. Zhang, Z.; Yang, R.; Zhang, S.; Zhao, H.; Hua, X. Purification of lactulose syrup by using nanofiltration in a diafiltration mode. J. Food Eng. 2011, 105, 112-118.
202. García-Martín, N.; Perez-Magariño, S.; Ortega-Heras, M.; González-Huerta, C.; Mihnea, M.;
González-Sanjosé, M.L.; Palacio, L.; Prádanos, P.; Hernández, A. Sugar reduction in musts with
nanofiltration membranes to obtain low alcohol-content wines. Sep. Purif. Technol. 2010, 76, 158-170.
203. Gosling, A.; Stevens, G.W.; Barber, A.R.; Kentish, S.E.; Gras, S.L. Recent advances refining galactooligosaccharide production from lactose. Food Chem. 2010, 121, 307-318.
204. Goulas, A.K.; Grandison, A.S.; Rastall, R.A. Fractionation of oligosaccharides by nanofiltration.
J. Sci. Food Agric. 2003, 83, 675-680.
205. Catarino, I.; Minhalma, M.; Beal, L.L.; Mateus, M.; de Pinho, M.N. Assessment of saccharide fractionation by ultrafiltration and nanofiltration. J. Membr. Sci. 2008, 312, 34-40.
206. Hartmann, R.; Meisel, H. Food-derived peptides with biological activity: from research to food applications. Curr. Opin. Biotechnol. 2007, 18, 163-169.

183
207. Saxena, A.; Tripathi, B.P.; Kumar, M.; Shahi, V.K. Membrane-based techniques for the separation and purification of proteins: An overview. Adv. Colloid Interface Sci. 2009, 145, 1-22.
208. Bourseau, P.; Vandanjon, L.; Jaouen, P.; Chaplain-Derouiniot, M.; Massé, A.; Guérard, F.;
Chabeaud, A.; Fouchereau-Péron, M.; Le Gal, Y.; Ravallec-Plé, R.; Bergé, J.-.; Picot, L.; Piot, J.-.;
Batista, I.; Thorkelsson, G.; Delannoy, C.; Jakobsen, G.; Johansson, I. Fractionation of fish protein
hydrolysates by ultrafiltration and nanofiltration: impact on peptidic populations. Desalination 2009,
244, 303-320.
209. Vandanjon, L.; Grignon, M.; Courois, E.; Bourseau, P.; Jaouen, P. Fractionating white fish fillet hydrolysates by ultrafiltration and nanofiltration. J. Food Eng. 2009, 95, 36-44.
210. Picot, L.; Ravallec, R.; Fouchereau-Péron, M.; Vandanjon, L.; Jaouen, P.; Chaplain-Derouiniot,
M.; Guérard, F.; Chabeaud, A.; Legal, Y.; Alvarez, O.M.; Bergé, J.; Piot, J.; Batista, I.; Pires, C.;
Thorkelsson, G.; Delannoy, C.; Jakobsen, G.; Johansson, I.; Bourseau, P. Impact of ultrafiltration and
nanofiltration of an industrial fish protein hydrolysate on its bioactive properties. J. Sci. Food Agric. 2010, 90, 1819-1826.
211. Ting, B.P.C.P.; Gauthier, S.F.; Pouliot, Y. Fractionation of β-lactoglobulin tryptic peptides using
spiral wound nanofiltration membranes. Sep. Sci. Technol. 2007, 42, 2419-2433.
212. Lapointe, J.; Gauthier, S.F.; Pouliot, Y.; Bouchard, C. Effect of hydrodynamic conditions on
fractionation of β-lactoglobulin tryptic peptides using nanofiltration membranes. J. Membr. Sci. 2003,
212, 55-67.
213. Roufik, S.; Gauthier, S.F.; Turgeon, S.L. Physicochemical characterization and in vitro digestibility of< i> β-lactoglobulin/< i> β-Lg f142-148 complexes. Int. Dairy J. 2007, 17, 471-480.
214. Butylina, S.; Luque, S.; Nyström, M. Fractionation of whey-derived peptides using a
combination of ultrafiltration and nanofiltration. J. Membr. Sci. 2006, 280, 418-426.
215. Hsieh, C.; Huang, Y.; Lai, C.; Ho, W.; Ko, W. Develop a Novel Method for Removing Fusel Alcohols from Rice Spirits Using Nanofiltration<br />. J. Food Sci. 2010, 75, N-25-N29.
216. Vanneste, J.; Sotto, A.; Courtin, C.M.; Van Craeyveld, V.; Bernaerts, K.; Van Impe, J.; Vandeur,
J.; Taes, S.; Van der Bruggen, B. Application of tailor-made membranes in a multi-stage process for
the purification of sweeteners from Stevia rebaudiana. J. Food Eng. 2011, 103, 285-293.
217. Luo, J.; Ding, L.; Chen, X.; Wan, Y. Desalination of soy sauce by nanofiltration. Sep. Purif. Technol. 2009, 66, 429-437.
218. Statistics Canada Production of principal field crops, November 2012 (final). 2012, 2013,
219. Ma -Y, C.; Wood F., D. Functional properties of oat proteins modified by acylation, trypsin hydrolysis or linoleate treatment. J. Am. Oil Chem. Soc. 1986, 63, 447-447.
220. Ma -Y., C. Functional properties of Acylated Oat Protein. J. Food Sci. 1984, 49, 1128-1131.
184
221. Ma -Y., C. Functional properties of oat concentrate treated with linoleate or Trypsin. Can. Inst. Food Sci. Technol. J. 1985, 18, 79-84.
222. Ma -Y., C.; Rout K., M.; Phillips L., D. Study of thermal aggregation and gelation of oat
globulin by Raman spectroscopy. Spectroscopy 2003, 17, 417-428.
223. Wu, Y.V.; Sexson, K.R.; Cluskey, J.E.; Inglett, G.E. Protein isolate from high protein oats: preparation, composition and properties. J. Food Sci. 1977,
224. Pons, M.; Fiszman, S.M. Instrumental texture profile analysis with particular reference to gelled systems. Journal of texture studies (USA) 1996,
225. Marambe, P.; Shand, P.; Wanasundara, J. An In-vitro Investigation of Selected Biological
Activities of Hydrolysed Flaxseed ( Linum usitatissimum L.) Proteins. Journal of the American Oil Chemists' Society (JAOCS) 2008, 85, 1155-1164.
226. Sukan, G.; Andrews, A.T. Application of the plastein reaction to caseins and to skim-milk powder. I. Protein hydrolysis and plastein formation. J. Dairy Res. 1982,
227. Brinegar, A.C.; Peterson, D.M. Separation and characterization of oat globulin polypeptides.
Arch. Biochem. Biophys. 1982, 219, 71-79.
228. Svendsen, I.; Breddam, K. Isolation and amino acid sequence of a glutamic acid specific endopeptidase from Bacillus licheniformis. European Journal of Biochemistry 1992, 204, 165-171.
229. Chen, J.; Tian, J.; Zheng, F.; Li, X.; Zhao, Y.; Gao, X.; Zhang, X. Effects of protein hydrolysis on pasting properties of wheat flour. Stärke Starch 2012,
230. Yin, S.; Tang, C.; Cao, J.; Hu, E.; Wen, Q.; Yang, X. Effects of limited enzymatic hydrolysis
with trypsin on the functional properties of hemp (Cannabis sativa L.) protein isolate. Food Chem.
2008, 106, 1004-1013.
231. Plietz, P.; Zirwer, D.; Schlesier, B.; Gast, K.; Damaschun, G. Shape, symmetry, hydration and
secondary structure of the legumin from Vicia faba in solution. Biochimica et Biophysica Acta (BBA) - Protein Structure and Molecular Enzymology 1984, 784, 140-146.
232. Gómez-Guillén, M.; Turnay, J.; Fernández-Dıaz, M.; Ulmo, N.; Lizarbe, M.; Montero, P.
Structural and physical properties of gelatin extracted from different marine species: a comparative study. Food Hydrocoll. 2002, 16, 25-34.
233. Sun, X.D.; Arntfield, S.D. Dynamic oscillatory rheological measurement and thermal properties of pea protein extracted by salt method: Effect of pH and NaCl. J. Food Eng. 2011, 105, 577-582.
234. Handa, A.; Hayashi, K.; Shidara, H.; Kuroda, N. Correlation of the protein structure and gelling
properties in dried egg white products. J. Agric. Food Chem. 2001, 49, 3957-3964.
235. Yuan, S.; Chang, S.K.C. Texture Profile of Tofu as Affected by Instron Parameters and Sample
Preparation, and Correlations of Instron Hardness and Springiness with Sensory Scores. J. Food Sci. 2007, 72, S136-S145.

185
236. Bryant, C.; McClements, D. Optimizing Preparation Conditions for Heat‐ denatured Whey Protein Solutions to be Used as Cold‐ gelling Ingredients. J. Food Sci. 2000, 65, 259-263.
237. Mulvihill, D.; Rector, D.; Kinsella, J. Mercaptoethanol, N‐ Ethylmaleimide, Propylene Glycol
and Urea Effects on Rheological Properties of Thermally Induced β‐ Lactoglobulin Gels at Alkaline pH. J. Food Sci. 1991, 56, 1338-1341.
238. Ma -Y., C. Functional properties of oat concentrate treated with linoleate or Trypsin. Can. Inst. Food Sci. Technol. J. 1985, 18, 79-84.
239. Kuipers, B.J.; Gruppen, H. Identification of strong aggregating regions in soy glycinin upon
enzymatic hydrolysis. J. Agric. Food Chem. 2008, 56, 3818-3827.
240. Lamsal, B.; Jung, S.; Johnson, L. Rheological properties of soy protein hydrolysates obtained from limited enzymatic hydrolysis. LWT-Food Science and Technology 2007, 40, 1215-1223.
241. Hammershøj, M.; LARSEN, L.B.; IPSEN, R.H.; QVIST, K.B. Effect of hen egg production and protein composition on textural properties of egg albumen gels. J. Texture Stud. 2001, 32, 105-129.
242. Banerjee, P.; Keener, K.; Lukito, V. Influence of carbon dioxide on the activity of chicken egg
white lysozyme. Poult. Sci. 2011, 90, 889-895.
243. Molina, E.; Defaye, A.B.; Ledward, D.A. Soy protein pressure-induced gels. Food Hydrocoll. 2002, 16, 625-632.
244. Mao, R.; Tang, J.; Swanson, B. Water holding capacity and microstructure of gellan gels. Carbohydr. Polym. 2001, 46, 365-371.
245. Chantrapornchai, W.; McClements, D.J. Influence of NaCl on optical properties, large-strain
rheology and water holding capacity of heat-induced whey protein isolate gels. Food Hydrocoll.
2002, 16, 467-476.
246. Wu, W.; Hua, Y.; Lin, Q.; Xiao, H. Effects of oxidative modification on thermal aggregation and gel properties of soy protein by peroxyl radicals. Int. J. Food Sci. Tech. 2011, 46, 1891-1897.
247. Yamul, D.K.; Lupano, C.E. Properties of gels from whey protein concentrate and honey at different pHs. Food Res. Int. 2003, 36, 25-33.
248. Food and Agricultural Organization (FAO) FAOSTAT. 2012, 2014,
249. Nieto-Nieto, T.V.; Wang, Y.X.; Ozimek, L.; Chen, L. Effects of partial hydrolysis on structure
and gelling properties of oat globular proteins. Food Res. Int. 2014, 55, 418-425.
250. Le, X.T.; Turgeon, S.L. Rheological and structural study of electrostatic cross-linked xanthan gum hydrogels induced by β-lactoglobulin. Soft Matter 2013, 9, 3063-3073.
251. Chen, H.H.; Xu, S.Y.; Wang, Z. Interaction between flaxseed gum and meat protein. J. Food Eng. 2007, 80, 1051-1059.
186
252. Tobin, J.T.; Fitzsimons, S.M.; Chaurin, V.; Kelly, A.L.; Fenelon, M.A. Thermodynamic
incompatibility between denatured whey protein and konjac glucomannan. Food Hydrocoll. 2012, 27,
201-207.
253. Tomczynska-Mleko, M.; Wesolowska-Trojanowska, M.; Grzegory, P.; Mleko, S.; Ozimek, L.
Reversibility of whey protein concentrate/locust bean gum gels. Milchwissenschaft-Milk Science International 2012, 67, 311-314.
254. Tseng, Y.; Xiong, Y.L.; Yang, F. Influence of inulin/oligofructose on the acid‐ induced cold
aggregation and gelation of preheated soy proteins. J. Sci. Food Agric. 2009, 89, 2650-2658.
255. Roberfroid, M.B. Inulin-type fructans: functional food ingredients. J. Nutr. 2007, 137, 2493S-2502S.
256. Blecker, C.; Chevalier, J.; Van Herck, J.; Fougnies, C.; Deroanne, C.; Paquot, M. Inulin: Its
physicochemical properties and technological functionality. Recent research developments in
agricultural & food chemistry 2001, 5, 125-131.
257. Bot, A.; Erle, U.; Vreeker, R.; Agterof, W.G. Influence of crystallisation conditions on the large deformation rheology of inulin gels. Food Hydrocoll. 2004, 18, 547-556.
258. Arango, O.; Trujillo, A.; Castillo, M. Influence of fat replacement by inulin on rheological
properties, kinetics of rennet milk coagulation, and syneresis of milk gels. J. Dairy Sci. 2013, 96,
1984-1996.
259. Guggisberg, D.; Cuthbert-Steven, J.; Piccinali, P.; Bütikofer, U.; Eberhard, P. Rheological,
microstructural and sensory characterization of low-fat and whole milk set yoghurt as influenced by inulin addition. Int. Dairy J. 2009, 19, 107-115.
260. Giri, A.; Kanawjia, S.K.; Khetra, Y. Textural and Melting Properties of Processed Cheese
Spread as Affected by Incorporation of Different Inulin Levels. Food and Bioprocess Technology
2014, 7, 1533-1540.
261. Van der Meeren, P.; Dewettinck, K.; Saveyn, H. Particle Size Analysis, In Handbook of Food
Analysis: Methods and instruments in applied food analysis<br /><br />, Nollet, L., Ed.; Marcel Dekker AG: 2004; Vol.138 pp. 1805-1807.
262. Ikeda, S.; Morris, V.J. Fine-stranded and particulate aggregates of heat-denatured whey proteins
visualized by atomic force microscopy. Biomacromolecules 2002, 3, 382-389.
263. Glibowski, P.; Bukowska, A. The effect of pH, temeperature and heating time on inulin chemical stability. Acta Scientiarum Polonorum. Technologia Alimentaria 2011, 10, 189-196.
264. Pires Vilela, J.A.; Cavallieri, ÂL.F.; Lopes da Cunha, R. The influence of gelation rate on the
physical properties/structure of salt-induced gels of soy protein isolate–gellan gum. Food Hydrocoll.
2011, 25, 1710-1718.
265. Perrechil, F.A.; Braga, A.L.M.; Cunha, R.L. Acid gelation of native and heat‐ denatured soy proteins and locust bean gum. Int. J. Food Sci. Tech. 2013, 48, 620-627.
187
266. Lupano, C.E.; González, S. Gelation of whey protein concentrate-cassava starch in acidic conditions. J. Agric. Food Chem. 1999, 47, 918-923.
267. Foegeding, E.A. Rheology and sensory texture of biopolymer gels. Current Opinion in Colloid
& Interface Science 2007, 12, 242-250.
268. Djabourov, M. Architecture of gelatin gels. Contemporary Physics 1988, 29, 273-297.
269. Weigandt, K.; Pozzo, D. Protein Gel Rheology, In Proteins in Solutions and at Interphases:
Methods and Applications in Biotechnology and Material Science, Ruso, J.M. and Piñeiro, A., Eds.; John Wiley & Sons, Inc.: 2013; pp. 437-448.
270. Owen, S.R.; Tung, M.A.; Paulson, A.T. Thermorheological studies of food polymer dispersions.
J. Food Eng. 1992, 16, 39-53.
271. Lefebvre, J.; Popineau, Y.; Deshayes, G.; Lavenant, L. Temperature-induced changes in the
dynamic rheological behavior and size distribution of polymeric proteins for glutens from wheat near-isogenic lines differing in HMW glutenin subunit composition. Cereal Chem. 2000, 77, 193-201.
272. Kim, Y.; Faqih, M.; Wang, S. Factors affecting gel formation of inulin. Carbohydr. Polym.
2001, 46, 135-145.
273. Ross-Murphy, S. Rheological methods. Biophysical methods in food research 1984, 138-199.
274. Tunick, M.H. Small-strain dynamic rheology of food protein networks. J. Agric. Food Chem. 2010, 59, 1481-1486.
275. Rao, M.A. Rheology of Fluid and Semisolid Foods: Principles and Applications: Principles and Applications. Springer: 2010;
276. Zhao, Y.; Mine, Y.; Ma, C. Study of thermal aggregation of oat globulin by laser light scattering. J. Agric. Food Chem. 2004, 52, 3089-3096.
277. Ma, C.; Rout, M.K.; Mock, W. Study of oat globulin conformation by Fourier transform infrared
spectroscopy. J. Agric. Food Chem. 2001, 49, 3328-3334.
278. Remondetto, G.E.; Subirade, M. Molecular mechanisms of Fe2 ‐ induced β‐ lactoglobulin cold gelation. Biopolymers 2003, 69, 461-469.
279. Schaller-Povolny, L.; Smith, D. Interaction of milk proteins with inulin. Milchwissenschaft 2002, 57, 494-497.
280. Glibowski, P. Rheological properties and structure of inulin–whey protein gels. Int. Dairy J.
2009, 19, 443-449.
281. Barclay, T.; Ginic-Markovic, M.; Cooper, P.; Petrovsky, N. Inulin a versatile polysaccharide
with multiple pharmaceutical and food chemical uses. Journal of Excipients & Food Chemicals 2010,
1, 27-50.

188
282. De Jong, S.; Klok, H.J.; Van de Velde, F. The mechanism behind microstructure formation in mixed whey protein–polysaccharide cold-set gels. Food Hydrocoll. 2009, 23, 755-764.
283. Çakır, E.; Daubert, C.R.; Drake, M.A.; Vinyard, C.J.; Essick, G.; Foegeding, E.A. The effect of
microstructure on the sensory perception and textural characteristics of whey protein/κ-carrageenan mixed gels. Food Hydrocoll. 2012, 26, 33-43.
284. Weinbreck, F.; Nieuwenhuijse, H.; Robijn, G.W.; de Kruif, C.G. Complex formation of whey proteins: exocellular polysaccharide EPS B40. Langmuir 2003, 19, 9404-9410.
285. Baeza, R.I.; Carp, D.J.; Pérez, O.E.; Pilosof, A.M.R. Regular Article: κ -Carrageenan—Protein
Interactions: Effect of Proteins on Polysaccharide Gelling and Textural Properties. LWT - Food Science and Technology 2002, 35, 741-747.
286. Liu, S.; Elmer, C.; Low, N.H.; Nickerson, M.T. Effect of pH on the functional behaviour of pea protein isolate–gum Arabic complexes. Food Res. Int. 2010, 43, 489-495.
287. Uruakpa, F.; Arntfield, S. Surface hydrophobicity of commercial canola proteins mixed with κ-
carrageenan or guar gum. Food Chem. 2006, 95, 255-263.
288. Silva, D.M.; Nunes, C.; Pereira, I.; Moreira, A.S.P.; Domingues, M.R.M.; Coimbra, M.A.;
Gama, F.M. Structural analysis of dextrins and characterization of dextrin-based biomedical hydrogels. Carbohydr. Polym. 2014, 114, 458-466.
289. Secundo, F.; Guerrieri, N. ATR-FT/IR study on the interactions between gliadins and dextrin
and their effects on protein secondary structure. J. Agric. Food Chem. 2005, 53, 1757-1764.
290. Necas, J.; Bartosikova, L. Carrageenan: a review. Vet. Med. 2013, 58, 187-205.
291. Shahidi, F.; Arachchi, J.K.V.; Jeon, Y. Food applications of chitin and chitosans. Trends Food
Sci. Technol. 1999, 10, 37-51.
292. Alizadeh-Pasdar, N.; Li-Chan, E.C. Comparison of protein surface hydrophobicity measured at various pH values using three different fluorescent probes. J. Agric. Food Chem. 2000, 48, 328-334.
293. Guan, X.; Yao, H.; Chen, Z.; Shan, L.; Zhang, M. Some functional properties of oat bran protein concentrate modified by trypsin. Food Chem. 2007, 101, 163-170.
294. Nieto-Nieto, T.V.; Wang, Y.X.; Ozimek, L.; Chen, L. Inulin at low concentration significantly
improves the gelling properties of oat protein - a molecular mechanism study. Food Hydrocolloids revised,
295. Tseng, Y.-.; Xiong, Y.L.; Boatright, W.L. Effects of Inulin/Oligofructose on the Thermal Stability and Acid-Induced Gelation of Soy Proteins. J. Food Sci. 2008, 73, E44-E50.
296. Laneuville, S.I.; Turgeon, S.L. Microstructure and stability of skim milk acid gels containing an
anionic bacterial exopolysaccharide and commercial polysaccharides. Int. Dairy J. 2014, 37, 5-15.

189
297. Schokker, E.P.; Singh, H.; Pinder, D.N.; Creamer, L.K. Heat-induced aggregation of β-
lactoglobulin AB at pH 2.5 as influenced by ionic strength and protein concentration. Int. Dairy J.
2000, 10, 233-240.
298. Stone, A.K.; Nickerson, M.T. Formation and functionality of whey protein isolate–(kappa-, iota-, and lambda-type) carrageenan electrostatic complexes. Food Hydrocoll. 2012, 27, 271-277.
299. Sun, X.D.; Arntfield, S.D. Molecular forces involved in heat-induced pea protein gelation:
Effects of various reagents on the rheological properties of salt-extracted pea protein gels. Food
Hydrocoll. 2012, 28, 325-332.
300. Galazka, V.; Smith, D.; Ledward, D.; Dickinson, E. Interactions of ovalbumin with sulphated
polysaccharides: effects of pH, ionic strength, heat and high pressure treatment. Food Hydrocoll. 1999, 13, 81-88.
301. Jones, O.G.; McClements, D.J. Recent progress in biopolymer nanoparticle and microparticle
formation by heat-treating electrostatic protein–polysaccharide complexes. Adv. Colloid Interface Sci. 2011, 167, 49-62.
302. Nicolai, T.; Durand, D. Controlled food protein aggregation for new functionality. Current Opinion in Colloid & Interface Science 2013, 18, 249-256.
303. Mleko, S.; Pikus, S.; Li-Chan, E. Interactions of kappa-carrageenan with whey proteins in gels
formed at different pH. Food research international (Ottawa, Ont. ) Food research international 1997, 30, 427-433.
304. Tang, C.; Ma, C. Effect of high pressure treatment on aggregation and structural properties of soy protein isolate. LWT - Food Science and Technology 2009, 42, 606-611.
305. Verbeken, D.; Neirinck, N.; Van Der Meeren, P.; Dewettinck, K. Influence of κ-carrageenan on the thermal gelation of salt-soluble meat proteins. Meat Sci. 2005, 70, 161-166.
306. Tolstoguzov, V. Some thermodynamic considerations in food formulation. Food Hydrocoll.
2003, 17, 1-23.