the effect of bull bars on head impact kinematics in pedestrian...
TRANSCRIPT

The effect of bull bars on head impact
kinematics in pedestrian crashes
RWG Anderson, S Doecke, AL van den Berg,DJ Searson, G Ponte
CASR REPORT SERIES
CASR059
April 2009

Report documentation
REPORT NO. DATE PAGES ISBN ISSN
CASR059 April 2009 22 978 1 920947 60 6 1449-2237
TITLE
The effect of bull bars on head impact kinematics in pedestrian crashes
AUTHORS
RWG Anderson, S Doecke, AL van den Berg, DJ Searson, G Ponte
PERFORMING ORGANISATION
Centre for Automotive Safety Research
The University of Adelaide
South Australia 5005
AUSTRALIA
SPONSORED BY
Motor Accident Commission
GPO Box 1045
Adelaide SA 5001
AUSTRALIA
AVAILABLE FROM
Centre for Automotive Safety Research
http://casr.adelaide.edu.au/publications/researchreports
ABSTRACT
This study sought to assess the effect of bull bars on the head kinematics and head impact severity of an adult
pedestrian in a collision. Multibody models were created to represent a range of sport-utility vehicles and common
bull bar geometries and materials. The contact-impact behaviours of the pedestrian-vehicle interactions were
determined from a series of impact tests with the vehicles and the bull bars being modelled. A generalised Hunt-
Crossley damping model was fitted to the test data. The interaction models were implemented in MADYMO
models of a vehicle pedestrian collision using the geometry of the vehicles and bull bars and a fiftieth percentile
male human model. Head kinematics were extracted and the head impact severity estimated. The speed of the
head impact with the bonnet was increased by between 7 and 55 percent in simulations where a bull bar was fitted
to the vehicle. The increase in head impact velocity was not related to the bull bar material type. The 55 percent
increase in head impact speed produced a 249 percent increase in HIC value, using a head-bonnet interaction
model based on Australasian NCAP head impact test results. The location of the head impact was affected by the
bull bar but the effect was not consistent. The simulation results show that the addition of a bull bar to the front of
a vehicle increases the speed of the head impact with the bonnet. This speed increase appears to be less a product
of the material the bull bar is made from, but more a product of the geometry of the bull bar. This suggests that bull
bar geometries could be altered to improve pedestrian collision kinematics possibly even lessening the severity of
the head impact with the bonnet. Combined with a soft material, such as polymer, this may lead to a safer bull bar
designs for pedestrians.
KEYWORDS
Pedestrian crashes, Simulation, Bull bars, Injury risk
© The University of Adelaide 2009
The views expressed in this report are those of the authors and do not necessarily represent those of the
University of Adelaide or the funding organisations.

CASR Road Safety Research Report | The effect of bull bars on head impact kinematics in pedestrian crashes iii
Summary
Vehicle frontal protection systems for motor vehicles (less prosaically referred to as bull bars
or kangaroo bars) are a common addition to motor vehicles in Australia. A recent survey in
Adelaide, South Australia, found that, at the sites typical of pedestrian crashes, bull bar
equipped vehicles constitute around nine percent of the traffic; around half of all bull bars
observed were fitted to high ground clearance SUV type vehicles (Anderson et al., 2008b).
Hence, one might estimate that bull bars are involved in around 1 in 10 pedestrian crashes
in South Australia.
The aim of this study was to assess the effect of bull bars on the kinematics of an adult
pedestrian in a collision, to examine effects secondary to the impact between the
pedestrian and the bull bar, particularly the effect on head impact kinematics. A further aim
was to examine differential effects according to bull bar geometry and bull bar material
(steel, alloy or plastic).
The contact-impact behaviour associated with the interaction between the a pedestrian and
each bull bar and vehicle was identified from data collected for a separate study (Anderson
et al., 2006) on the relative performance of bull bars and the fronts of vehicles in pedestrian
subsystem tests. This contact-impact behaviour was then implemented into a MADYMO
model of an adult pedestrian struck by a vehicle alone, and also with different types of bull
bar.
The head impact velocity was consistently higher in simulations that included a bull bar,
varying between 7 percent and 55 percent higher than the simulations with the vehicle
alone. The average increase in the head impact velocity was 23 percent. There was no
consistency in the increase in head impact velocity with regard to bull bar material.
The trajectory of the head was altered by the addition of a bull bar to the vehicle, but the
effect on the trajectory varied from bull bar to bull bar. In some cases the head strike was
closer to the leading edge but in others it was farther away.
A generic contact-impact model of the head-bonnet contact was used in all simulations. The
addition of a bull bar to the front of the vehicles increased the HIC value produced by the
head-bonnet contact in all simulations, in one case more than tripling the HIC value. It
should be noted however, the generic stiffness definition means that the differences in the
HIC values generated should be used to indicate trends in impact severity arising from the
changes in head impact speed, rather than as applicable to the vehicles themselves.
Further work is needed to determine the specific geometric properties that contribute to an
increase in head impact speed and their relative importance when compared to the bull
bar’s stiffness properties.

iv CASR Road Safety Research Report | The effect of bull bars on head impact kinematics in pedestrian crashes
Contents
1 Introduction .............................................................................................................................1
2 Methods...................................................................................................................................2
2.1 Contact-impact test data ..............................................................................................2
2.2 Vehicles and bull bars tested .......................................................................................2
2.3 Contact-impact modelling (stiffness, damping and hystereticcharacteristics).............................................................................................................3
2.4 Multibody modelling .....................................................................................................5
2.5 MADYMO human body modelling ................................................................................5
2.6 MADYMO model runs and outputs...............................................................................6
3 Results .....................................................................................................................................7
3.1 Stiffness, damping and hysteretic characteristics of bull bars andvehicle leading edges...................................................................................................7
3.2 Effect on head impact velocity .....................................................................................8
3.3 Effect on head impact location.....................................................................................9
3.4 Effect on head impact severity ................................................................................... 10
4 Discussion ............................................................................................................................. 12
5 Conclusion ............................................................................................................................. 13
Acknowledgements....................................................................................................................... 14
References .................................................................................................................................... 15
Appendix A - Polar plots of speed and angle of the head CoG..................................................... 16
Appendix B - Velocity-time plots of the head CoG........................................................................ 17
Appendix C - Trajectories of the head CoG relative to vehicle..................................................... 18
CASR Road Safety Research Report | The effect of bull bars on head impact kinematics in pedestrian crashes 1
1 Introduction
Vehicle frontal protection systems for motor vehicles (less prosaically referred to as bull bars
or kangaroo bars) are a common addition to motor vehicles in Australia. A recent survey in
Adelaide, South Australia, found that, at the sites typical of pedestrian crashes, bull bar
equipped vehicles constitute around nine percent of the traffic; around half of all bull bars
observed were fitted to high ground clearance SUV type vehicles (Anderson et al., 2008b).
Hence, one might estimate that bull bars are involved in around 1 in 10 pedestrian crashes
in South Australia. Kloeden, White and McLean examined South Australian Coroner’s
records of pedestrian fatalities that occurred between 1991 and 1997, and found that bull
bars were fitted to 8.8% of crash involved vehicles (Kloeden et al., 2000).
Impact tests have shown that the severity of the contact between the pedestrian and the
bull bar is generally greater than it would be with the vehicle itself, but this is dependant on
the material used to construct the bull bar: plastic bull bars are sometimes less aggressive
than the vehicles to which they attach while steel bull bars can produce extremely high
impact loads (Lawrence et al., 2000; Anderson et al. 2006). But bull bars might have other
effects in pedestrian crashes too. They alter the front geometry of the vehicle and may
therefore alter the kinematics of the struck pedestrian, either onto the upper surface of the
vehicle, or onto the road.
The aim of this study was to assess the effect of bull bars on the kinematics of an adult
pedestrian in a collision, to examine effects secondary to the impact between the
pedestrian and the bull bar, particularly the effect on head impact kinematics. A further aim
was to examine differential effects according to bull bar geometry and bull bar material
(steel, alloy or plastic).

2 CASR Road Safety Research Report | The effect of bull bars on head impact kinematics in pedestrian crashes
2 Methods
The methodology used in this study comprised two parts:
• The identification of the contact-impact behaviour associated with the interaction
between the a pedestrian and each bull bar and vehicle, and
• The implementation of these into a MADYMO model of an adult pedestrian struck
by a vehicle alone, and also with different types of bull bar.
The resulting models were analysed to examine variations in the kinematics of the
pedestrian.
2.1 Contact-impact test data
The contact-impact models used in the models were generated from data collected for a
separate study on the relative performance of bull bars and the fronts of vehicles in
pedestrian subsystem tests. Details of that study are contained in a report by Anderson et
al. (2006). The aim of that study was to report the performance of current bull bars and the
vehicles to which they are fitted in tests designed to assess the risk that they pose to
pedestrians. Tests were conducted at 30 km/h. They consisted of a child headform impact
test on the top rail of the bull bar, and two upper legform impact tests: one on the top rail of
the bull bar and one on the bumper of the bull bar. Equivalent tests were conducted on the
vehicles themselves so that the relative performance of the bull bars could be assessed.
As the present study concerns the effect of the bull bar on the collision with an adult
pedestrian, the results of the upper legform tests were used to estimate the contact-impact
behaviour of each bull bar in an impact with a pedestrian. The data recorded in those tests
were analysed to produce stiffness, damping and hysteretic characteristics that could be
implemented in the multibody dynamics software code MADYMO (TASS, The Netherlands).
The tests are shown schematically in Figure 2.1.
Figure�2.1Upper legform test to the top rail (left) and bumper (right) used to determine the contact-impact
behaviour of the bull bars and vehicles for the simulation
2.2 Vehicles and bull bars tested
Five types of high ground clearance vehicles were tested for this study. The bull bars tested
were made from steel, alloy/aluminium or rotationally moulded polyethylene. The vehicles
and bull bars tested are listed in Table 2.1. The aim was to test a range of bull bars that
could be fitted to each of the five vehicles, so that some of the effects of bull bar material

CASR Road Safety Research Report | The effect of bull bars on head impact kinematics in pedestrian crashes 3
and geometry on the impact behaviour could be measured. At the time of testing,
polyethylene bull bars were unavailable for two of the five vehicles.
Table 2.1Vehicles and bull bars tested
Vehicle Steel bull bar Aluminium / alloy bull bar Polymer bull bar
Toyota Landcruiser Aftermarket bumperreplacement
OES bumperreplacement
Not available at thetime of testing
Nissan Patrol OES bumper replacement Aftermarket alloy nudge-bar
Aftermarket bumperreplacement
Ford Courier Aftermarket bumperreplacement
OES bumperreplacement
Aftermarket bumperreplacement
Holden Rodeo Aftermarket bumperreplacement (note 1)
OES bumperreplacement
Aftermarket bumperreplacement
Toyota Hilux OES bumper replacement After market chassismounted bar (note 2)
Not available at thetime of testing
Notes:
1. The Holden Rodeo aftermarket steel bull bar was almost identical to the Toyota Landcruiser aftermarketsteel bull bar. Tests were performed on the Landcruiser bull bar and the results were used for both bullbars.
2. The Toyota Hilux aftermarket alloy bull bar was almost identical to the Nissan Patrol aftermarket alloy bullbar, except for the addition of wing sections. Tests were performed on the Patrol bull bar and the resultswere used for both bull bars.
Impact locations varied from bull bar to bull bar, but in general, stiffer locations were
selected, such as top rail locations adjacent to a bull bar stanchion, but with deference to
the practicalities of testing: very stiff structures likely to saturate the instrumentation were
avoided, as were parts of the bar liable to cause a glancing blow. A full description of impact
locations can be found in the report on that study, Anderson et al. (2006).
Force data were acquired at 50 kHz per channel and conditioned according to CFC600 (SAE
J211/1 - Instrumentation for Impact Test - Part 1 - Electronic Instrumentation). Legform
velocity was measured just prior to contact with a dual-laser speed trap. All tests were
recorded using high-speed digital video (1000 fps).
2.3 Contact-impact modelling (stiffness, damping and hystereticcharacteristics)
The validity of the kinematics of the pedestrian model depends in part on the correct
characterisation of interaction of the pedestrian and the vehicle in the simulation. This
interaction is governed by the geometry of the vehicle/bull bar, and by the contact
characteristics of the interaction. Of importance in the characterisation of the contact is the
energy dissipated by each interaction, and the forces generated by each interaction.
In this study, contacts were modelled in a form consistent with Hunt-Crossley damping
(Hunt and Crossley, 1975), as described in Anderson et al. (2008a). In this model of impact,
damping is added in a more realistic way than is produced with a linear viscoelastic model of
impact (Gilardi and Sharf, 2002; Muthukumar and DesRoches, 2006; Polukoshko, 2007). A
characteristic of Hunt-Crossley damping is that the normal contact force is considered as a
sum of elastic and damping forces, where the damping force is zero at the beginning and
end of the impact and also at maximum penetration.
The Hunt-Crossley model of contact-impact is characterised by the following formulation:
F = Kδn + bδ p δ q
(1)
where F is the normal contact force,
€
δ is the contact penetration, K is the Hertzian elastic
component of the contact force and b, p and q are constants. It is usual to set p = n and

4 CASR Road Safety Research Report | The effect of bull bars on head impact kinematics in pedestrian crashes
q�=�1. Lankarani and Nikravesh (1990) showed that, in the case of Hertzian impact between
two spheres, Equation 1 can be written:
F = Kδ n 1+ c δ q (2)
where c is a damping parameter.
Equations 1 and 2 make no allowance for energy dissipation due to plastic deformation.
Lankarani and Nikravesh (1990) and others (as detailed by Goldsmith, 1960) proposed that
the unloading behaviour of a Hertzian impact that includes permanent deformation could be
described by
F = Fmδ − δ p
δm − δ p
n
(3)
where δ p is the permanent deformation, δm is the maximum deformation, and Fm is the
impact force at maximum deformation. As the impact velocity is zero at maximum
penetration, an expression for the force at maximum penetration is Fm = Kδm . In this case,
Equation 3 may be rewritten as
F = Kδm
δm − δ p
δ − δ p( )
n
Which is a specific form of the Hertzian contact law. Damping can now be added in the
unloading phase of such impacts in an analogous way as presented in Equation 3, i.e.:
F = Kδm
δm − δ p
δ − δ p( )
n
1+ c δ q (4)
A further generalisation of the damped loading and unloading phases of impact suggested
by Equations 2 and 4 is given by
F =FElastic− load 1+ c δ ,
δ ≥ 0
FElastic−unload 1+ c δ ,δ ≤ 0
(5)
where FElastic−* are numerically defined loading curves determined from an experimental
test.
In the multibody simulation software package MADYMO, damping forces are calculated
according to the following formula (adapted from TNO, 2007):
FDamping = c δ + fDamping δ( )
fAmplification FElastic( )
Where fDamping and fAmplification are functions of the penetration velocity and the elastic
force, respectively.
The total normal force is:

CASR Road Safety Research Report | The effect of bull bars on head impact kinematics in pedestrian crashes 5
FNormal = FElastic + c δ + fDamping δ( )
fAmplification FElastic( ) (6)
By defining fAmplification FElastic( ) = FElastic and fDamping δ( ) = 0 the total force can be written
as
FNormal = FElastic 1+ c δ (7)
where FElastic is numerical force-deformation characteristic defined separately in the loading
and unloading phases of the contact. Equation 7 is consistent with Equation 5, allowing the
implementation of a contact-impact model based on Hunt-Crossly damping with permanent
indentation.
Such a modelling approach was validated by Anderson et al. (2008a), and subsequently has
been successfully used to characterise test data describing the contact between impactors
and vehicles structures (unpublished results).
In this study, impact test data with bull bars and the vehicles were modelled according to
Equation 5. After obtaining an estimate of the normal force-deformation loop from the
experiment, values of the damping parameter were trialled (c* ). The corresponding trial
elastic loading and unloading functions (F*Elastic ) were determined by plotting
FElastic* = FNormal / 1+ c
* δ , adjusting the trial value of until all apparent damping was
accounted for; this was apparent when the characteristic of F*Elastic was such that the peak
elastic force occurred at maximum penetration. (For more detail, see Anderson et al.,
2008a). The resulting elastic unloading force was used in conjunction with Hysteresis Model
3A.
An advantage of modelling the contact-impact behaviour in this way is that rate effects are
properly accounted for, which is important when the simulated contact conditions (effective
mass and speed) vary from that in the test used to determine the contact behaviour.
2.4 Multibody modelling
All vehicles tested had been obtained for testing by the Australasian New Car Assessment
Program. Vehicle dimensions were obtained for the purposes of the ANCAP tests using a
prism-less digital theodolite. For the present purpose, scaled photographs of the vehicles
were also used to provide further data on the bumper geometry. Bull bar geometry was
measured directly from exemplar bull bars. The position of each bull bar relative to the
vehicle to which it attached was scaled from photos taken at the time of testing.
Consistently, the centre of the bull bar top rail was around 100 mm in front of the front-most
point of the leading edge of the vehicle, and this position was used in all MADYMO models
(Figure 2.2). The geometry of each bull bar was defined in MADYMO using a combination of
cylinders and planes. For the round bar sections cylinders of the 2nd degree were used and
for the plate sections either a cylinder of degree 10 or a plane were used, depending on the
orientation, and the nature of the modelled interaction between the pedestrian and the bull
bar.
2.5 MADYMO human body modelling
The model that was used for the simulation part of this study was developed specifically to
simulate pedestrians in car-pedestrian collisions. The model has been presented previously
(Garrett, 1996; Garrett, 1998), and used for accident simulation purposes (Anderson et al.,
2002; Anderson et al., 2005; Anderson et al., 2007). The model consists of 17 rigid
6 CASR Road Safety Research Report | The effect of bull bars on head impact kinematics in pedestrian crashes
segments linked by kinematic joints that are largely based on the model proposed by
Ishikawa et al. (1993) although some joints have been added while others have been
modified.
The model represented a 50th percentile male (for weight and weight) with segment
lengths, masses and moments of inertia generated from the GEBOD anthropometric
database (Baughman, 1983).
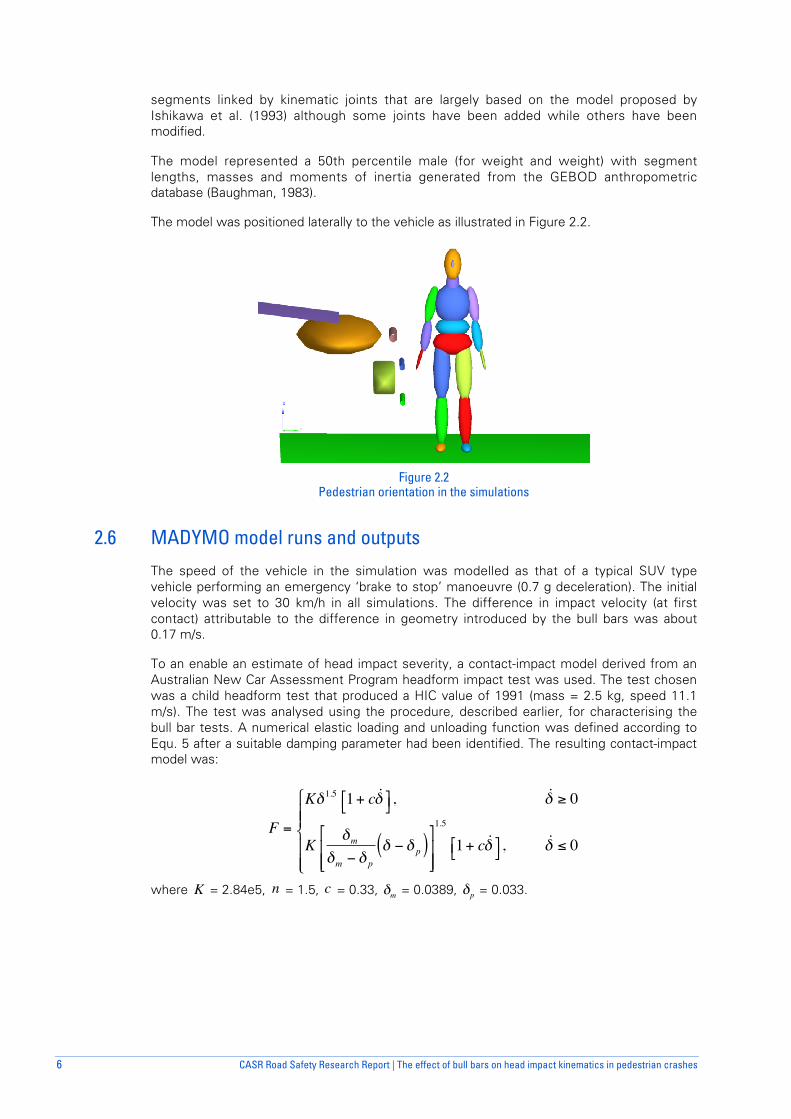
The model was positioned laterally to the vehicle as illustrated in Figure 2.2.
Figure 2.2Pedestrian orientation in the simulations
2.6 MADYMO model runs and outputs
The speed of the vehicle in the simulation was modelled as that of a typical SUV type
vehicle performing an emergency ‘brake to stop’ manoeuvre (0.7 g deceleration). The initial
velocity was set to 30 km/h in all simulations. The difference in impact velocity (at first
contact) attributable to the difference in geometry introduced by the bull bars was about
0.17 m/s.
To an enable an estimate of head impact severity, a contact-impact model derived from an
Australian New Car Assessment Program headform impact test was used. The test chosen
was a child headform test that produced a HIC value of 1991 (mass = 2.5 kg, speed 11.1
m/s). The test was analysed using the procedure, described earlier, for characterising the
bull bar tests. A numerical elastic loading and unloading function was defined according to
Equ. 5 after a suitable damping parameter had been identified. The resulting contact-impact
model was:
F =
Kδ 1.5 1+ c δ ,δ ≥ 0
Kδm
δm − δ p
δ − δ p( )
1.5
1+ c δ ,δ ≤ 0
where
€
K = 2.84e5,
€
n = 1.5,
€
c = 0.33,
€
δm = 0.0389,
€
δp = 0.033.
CASR Road Safety Research Report | The effect of bull bars on head impact kinematics in pedestrian crashes 7
3 Results
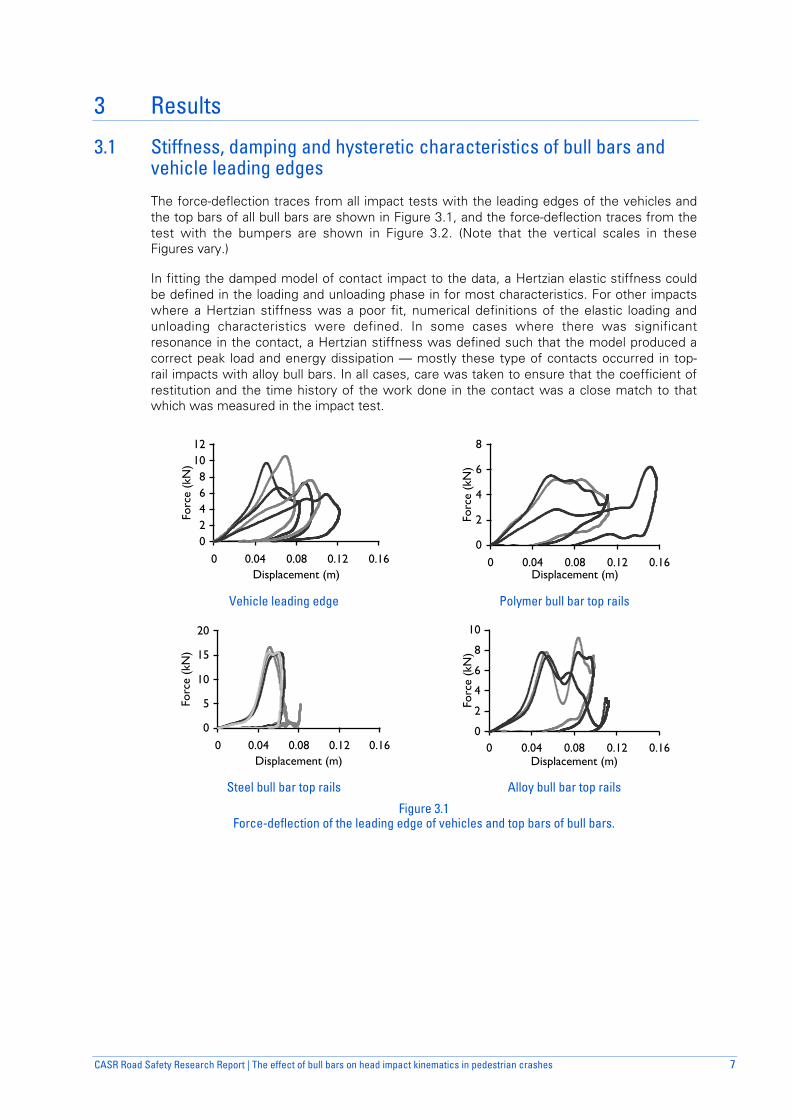
3.1 Stiffness, damping and hysteretic characteristics of bull bars andvehicle leading edges
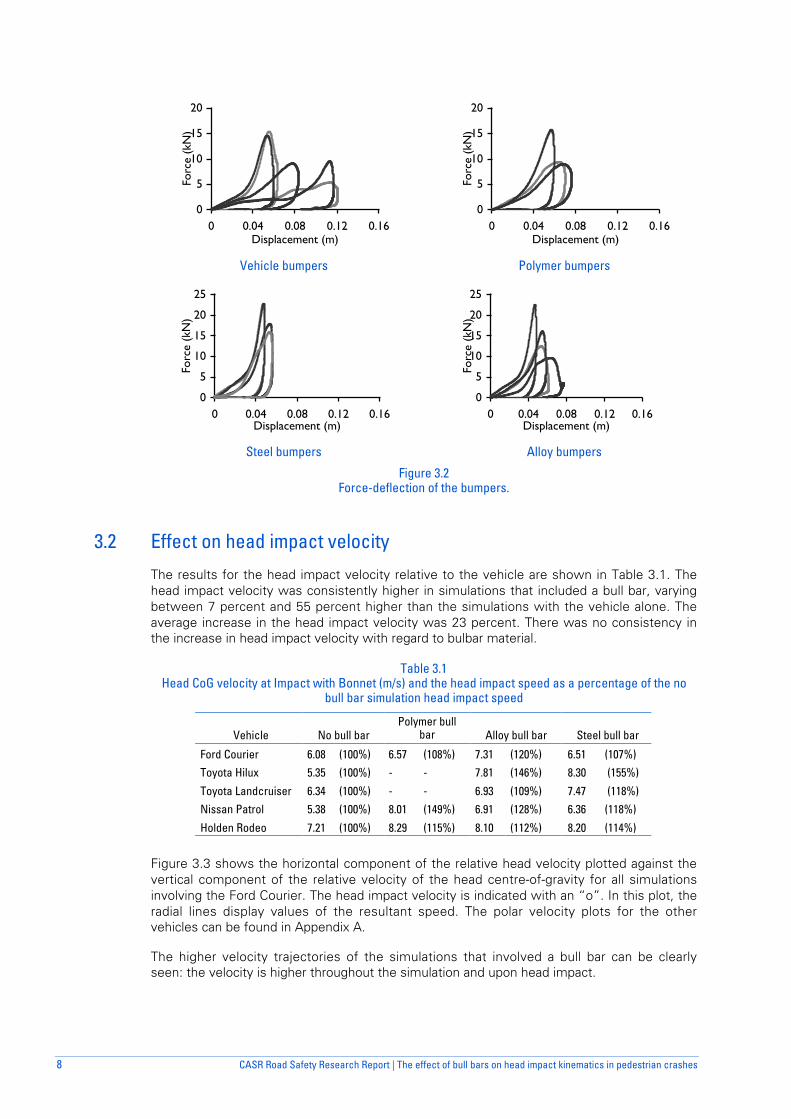
The force-deflection traces from all impact tests with the leading edges of the vehicles and
the top bars of all bull bars are shown in Figure 3.1, and the force-deflection traces from the
test with the bumpers are shown in Figure 3.2. (Note that the vertical scales in these
Figures vary.)
In fitting the damped model of contact impact to the data, a Hertzian elastic stiffness could
be defined in the loading and unloading phase in for most characteristics. For other impacts
where a Hertzian stiffness was a poor fit, numerical definitions of the elastic loading and
unloading characteristics were defined. In some cases where there was significant
resonance in the contact, a Hertzian stiffness was defined such that the model produced a
correct peak load and energy dissipation — mostly these type of contacts occurred in top-
rail impacts with alloy bull bars. In all cases, care was taken to ensure that the coefficient of
restitution and the time history of the work done in the contact was a close match to that
which was measured in the impact test.
02468
1012
0 0.04 0.08 0.12 0.16Displacement (m)
Forc
e (k
N)
0
2
4
6
8
0 0.04 0.08 0.12 0.16Displacement (m)
Forc
e (k
N)
Vehicle leading edge Polymer bull bar top rails
0
5
10
15
20
0 0.04 0.08 0.12 0.16Displacement (m)
Forc
e (k
N)
0
2
4
6
8
10
0 0.04 0.08 0.12 0.16Displacement (m)
Forc
e (k
N)
Steel bull bar top rails Alloy bull bar top rails
Figure 3.1Force-deflection of the leading edge of vehicles and top bars of bull bars.
8 CASR Road Safety Research Report | The effect of bull bars on head impact kinematics in pedestrian crashes
0
5
10
15
20
0 0.04 0.08 0.12 0.16Displacement (m)
Forc
e (k
N)
0
5
10
15
20
0 0.04 0.08 0.12 0.16Displacement (m)
Forc
e (k
N)
Vehicle bumpers Polymer bumpers
0
5
10
15
20
25
0 0.04 0.08 0.12 0.16Displacement (m)
Forc
e (k
N)
0
5
10
15
20
25
0 0.04 0.08 0.12 0.16Displacement (m)
Forc
e (k
N)
Steel bumpers Alloy bumpers
Figure 3.2Force-deflection of the bumpers.
3.2 Effect on head impact velocity
The results for the head impact velocity relative to the vehicle are shown in Table 3.1. The
head impact velocity was consistently higher in simulations that included a bull bar, varying
between 7 percent and 55 percent higher than the simulations with the vehicle alone. The
average increase in the head impact velocity was 23 percent. There was no consistency in
the increase in head impact velocity with regard to bulbar material.
Table 3.1Head CoG velocity at Impact with Bonnet (m/s) and the head impact speed as a percentage of the no
bull bar simulation head impact speed
�Vehicle No bull bar
Polymer bullbar Alloy bull bar Steel bull bar
Ford Courier 6.08 (100%) 6.57 (108%) 7.31 (120%) 6.51 (107%)
Toyota Hilux 5.35 (100%) - - 7.81 (146%) 8.30 (155%)
Toyota Landcruiser 6.34 (100%) - - 6.93 (109%) 7.47 (118%)
Nissan Patrol 5.38 (100%) 8.01 (149%) 6.91 (128%) 6.36 (118%)
Holden Rodeo 7.21 (100%) 8.29 (115%) 8.10 (112%) 8.20 (114%)
Figure 3.3 shows the horizontal component of the relative head velocity plotted against the
vertical component of the relative velocity of the head centre-of-gravity for all simulations
involving the Ford Courier. The head impact velocity is indicated with an “o”. In this plot, the
radial lines display values of the resultant speed. The polar velocity plots for the other
vehicles can be found in Appendix A.
The higher velocity trajectories of the simulations that involved a bull bar can be clearly
seen: the velocity is higher throughout the simulation and upon head impact.

CASR Road Safety Research Report | The effect of bull bars on head impact kinematics in pedestrian crashes 9
Figure 3.3Polar plot showing the speed and angle of the head CoG until the point of impact in simulations
involving the Ford Courier
Figure 3.4 shows the same velocity data as Figure 3.3, but plotted against time. (The plots
of head speed over time for the simulation of the other vehicles can be found in Appendix
B.) As one would expect, the speed of head in the non-bull bar simulation rises and peaks
later than the simulations without bull bars. The head also strikes the bonnet later than
when a bull bar is not present. This appears to be one reason for the lower head impact
velocity.
Figure 3.4Velocity-time plot of the head CoG for simulations involving the Ford Courier
3.3 Effect on head impact location
Figure 3.4 shows the trajectory of the head centre-of-gravity relative to the vehicle up until
impact with the bonnet for all simulations involving the Ford Courier. (The head trajectory
plots for the other vehicles can be found in Appendix C.) The trajectory transformation was
calculated such that the origin of the vehicle frame was at ground level directly under the
front-most point on the bumper. Here the effect of the presence of a bull bar was less than
the variation between bull bar types.
10 CASR Road Safety Research Report | The effect of bull bars on head impact kinematics in pedestrian crashes
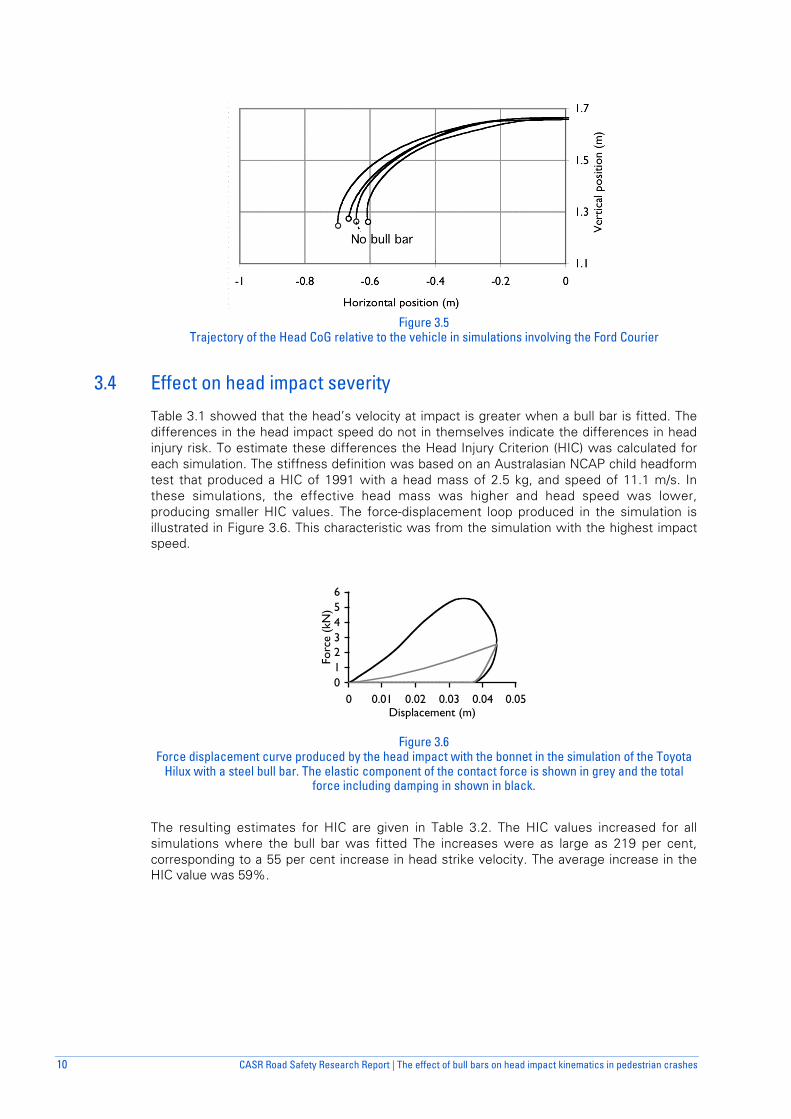
Figure 3.5Trajectory of the Head CoG relative to the vehicle in simulations involving the Ford Courier
3.4 Effect on head impact severity
Table 3.1 showed that the head’s velocity at impact is greater when a bull bar is fitted. The
differences in the head impact speed do not in themselves indicate the differences in head
injury risk. To estimate these differences the Head Injury Criterion (HIC) was calculated for
each simulation. The stiffness definition was based on an Australasian NCAP child headform
test that produced a HIC of 1991 with a head mass of 2.5 kg, and speed of 11.1 m/s. In
these simulations, the effective head mass was higher and head speed was lower,
producing smaller HIC values. The force-displacement loop produced in the simulation is
illustrated in Figure 3.6. This characteristic was from the simulation with the highest impact
speed.
0123456
0 0.01 0.02 0.03 0.04 0.05Displacement (m)
Forc
e (k
N)
Figure 3.6Force displacement curve produced by the head impact with the bonnet in the simulation of the Toyota
Hilux with a steel bull bar. The elastic component of the contact force is shown in grey and the totalforce including damping in shown in black.
The resulting estimates for HIC are given in Table 3.2. The HIC values increased for all
simulations where the bull bar was fitted The increases were as large as 219 per cent,
corresponding to a 55 per cent increase in head strike velocity. The average increase in the
HIC value was 59%.

CASR Road Safety Research Report | The effect of bull bars on head impact kinematics in pedestrian crashes 11
Table 3.2HIC results for head-bonnet impact
�Vehicle No Bull Bar Polymer bull bar Alloy bull bar Steel bull bar
Ford Courier 360 400 420 440
Toyota Hilux 250 - 573 798
ToyotaLandcruiser 385 - 484 575
Nissan Patrol 307 628 556 446
Holden Rodeo 471 543 593 596

12 CASR Road Safety Research Report | The effect of bull bars on head impact kinematics in pedestrian crashes
4 Discussion
The kinematics of the pedestrian model were altered by the addition of a bull bar to the front
of the vehicle. The presence of the bull bars in the simulations increased the head speed of
the pedestrian model at impact when compared to the vehicle with no bull bar fitted. The
magnitude of this increase varied from bull bar to bull bar and does not appear to be solely
related to the material the bull bar is manufactured from. This suggests that it is also related
to the individual combinations of vehicle and bull bar geometry rather than the material used
in the bull bar’s construction.
The trajectory of the head was altered by the addition of a bull bar to the vehicle, but the
effect on the trajectory varied from bull bar to bull bar. In some cases the head strike was
closer to the leading edge but in others it was farther away.
A generic contact-impact model of the head-bonnet contact was used in all simulations. This
contact-impact model was defined using Hunt-Crossly damping applied to a Hertzian contact
stiffness that had been fitted to head impact data recorded in a test with one of the
vehicles. The addition of a bull bar to the front of the vehicles increased the HIC value
produced by the head-bonnet contact in all simulations, in one case more than tripling the
HIC value. It should be noted however, the generic stiffness definition means that the
differences in the HIC values generated should be used to indicate trends in impact severity
arising from the changes in head impact speed, rather than as being applicable to the
vehicles themselves.
The limitations of the methodology used to produce the results reported here lie both in the
testing and modelling. The EEVC WG17 upper legform was used for the testing. It was
assumed that this legform represents the stiffness and damping properties of the lower
extremities in an impact with a vehicle. This is only an assumption and may be a source of
error. An improvement in the contact-impact modelling may be to subtract the contact
properties of the upper legform and too incorporate the contact properties of the human
lower extremity into the characteristic instead.
The high speed video of the top bar impact showed that, in some tests, the bull bar pivots
about the lower stanchion support during the loading phase. This behaviour has been
modelled in MADYMO within the contact definition – therefore, in the simulations, the
geometry may be more fixed than is realistic. The effects of potential errors in the effective
geometry of the bull bar were checked in several simulations by moving the location of the
top bar by 50 mm vertically, up and down. These trials had negligible effect on the results,
and so it appears that the approximation inherent in our modelling approach has little effect.

CASR Road Safety Research Report | The effect of bull bars on head impact kinematics in pedestrian crashes 13
5 Conclusion
The results of this study show that the addition of a bull bar to the front of a vehicle
increases the speed of the head impact with the bonnet. This speed increase appears to be
less a product of the material the bull bar is made from but a product of the geometry of the
bull bar. The result is that, in an impact with a bonnet of typical properties, the impact
severity can be markedly increased. Further work is needed to determine the specific
geometric properties that contribute to an increase in head impact speed and their relative
importance when compared to the bull bar’s stiffness properties.

14 CASR Road Safety Research Report | The effect of bull bars on head impact kinematics in pedestrian crashes
Acknowledgements
This study was funded by the South Australian Motor Accident Commission through a
Project Grant to the Centre for Automotive Safety Research.
The Centre for Automotive Safety Research receives core funding from both the South
Australian Department for Transport, Energy and Infrastructure and the South Australian
Motor Accident Commission.

CASR Road Safety Research Report | The effect of bull bars on head impact kinematics in pedestrian crashes 15
References
Anderson R, McLean AJ, Streeter L, Ponte G, Sommariva M, Lindsay T, Wundersitz L (2002) Severity and type ofpedestrian injuries related to vehicle impact locations and results of sub-system impact reconstruction, Proc.
2002 International IRCOBI Conference on the Biomechanics of Impact, pp 289-299.
Anderson, R.W.G., Long, A.D., Serre, T. (2008) Continuous contact-impact modelling for multi-body simulations of
pedestrian-vehicle contact interactions based on experimental data. J. of Nonlinear Dynamics (under review).
Anderson, R. W. G., McLean, A. J. and Dokko, Y. (2005) Determining accurate contact definitions in multi-bodysimulations for DOE-type reconstruction of head impacts in pedestrian accidents, Proc. 19th International
Conference on the Enhanced Safety of Vehicles, Paper 05-0175.
Anderson, R.W.G., Ponte, G., Doecke, S. (2008) A survey of bull bar prevalence at pedestrian crash sites in
Adelaide, South Australia. Centre for Automotive Safety Research, Adelaide, South Australia.
Anderson RWG, McLean AJ, Ponte G, Streeter L (2007) Pedestrian reconstruction using multibody MADYMO
simulation and the Polar-II dummy: a comparison of head kinematics, Proc. 20th International TechnicalConference on the Enhanced Safety of Vehicles, Paper 07-0273-0
Anderson R. W. G., van den Berg A. L., Ponte G., Streeter L. D., McLean A. J. (2006) Performance of bull bars in
pedestrian impact tests. Centre for Automotive Safety Research, Adelaide, South Australia.
Baughman, L. (1983) Development of an Interactive Program to Produce Body Description Data, Report no.
AFAMRL-TR-83-058, US Air Force Aerospace Medical Research Laboratory. Biomechanics of Impact, pp.159-174.
Garrett, M. (1996) Head impact modelling using computer accident simulation based on cadaver records. Proc. 24thInternational workshop on human subjects for biomechanical research, pp. 81-92.
Garrett, M. (1998) Head impact modelling using MADYMO simulations of documented pedestrian accidents. Proc.
Conference on Pedestrian Safety, pp. 158-168.
Gilardi G., Sharf, I. (2002) Literature survey of contact dynamics modelling. Mechanism and Machine Theory, Vol.
37(10), pp. 1213—1239.
Goldsmith, W.: Impact: The Theory and Physical Behaviour of Colliding Solids. Edward Arnold, London (1960).
Hunt, K.H., Crossley, F.R. (1975) Coefficient of restitution interpreted as damping in vibroimpact. J. Appl. Mech, Vol
42(E), pp. 440—445,.
Ishikawa H., Kajzer J., Schroeder G. (1993), Computer simulation of impact response of the human body in car-
pedestrian accidents, Proc. 37th Stapp Car Crash Conference, pp 235 - 248
Kloeden, C. K., White K., and McLean, A. J. (2000) Characteristics of Fatal and Severe Pedestrian Accidents in
South Australia, for Transport SA, Adelaide, South Australia.
Lankarani, H.M., Nikravesh, P.E. (1990) A contact force model with hysteresis damping for impact analysis of multi-body systems. J. Mech. Des., Vol. 112: pp. 369—376.
Lawrence G., Rodmell C., Osborne A. (2000) Assessment and test procedures for bull bars, TRL report 460,Transport Research Laboratories, Crowthorne, Berkshire, United Kingdom.
Muthukumar, S. and DesRoches, R. (2006) A Hertz contact model with non-linear damping for pounding simulation,Earthquake Engng Struct. Dyn., Vol. 35, pp. 81 – 828.
Polukoshko, S., Viba, J., Kononova, O., and Sokolova S. (2007) Rigid body impact models partially considering
deformation, Proc. Estonian Academy of Science and Engineering, Vol. 13, 2, pp. 140-155.

16 CASR Road Safety Research Report | The effect of bull bars on head impact kinematics in pedestrian crashes
Appendix A - Polar plots of speed and angle of the head CoG
Patrol Rodeo
Hilux Landcruiser
Figure A1: Polar plots showing the speed and angle of the head CoG until the point of impact

CASR Road Safety Research Report | The effect of bull bars on head impact kinematics in pedestrian crashes 17
Appendix B - Velocity-time plots of the head CoG
Patrol
Rodeo
Hilux
Landcruiser
Figure B1: Velocity-time plots of the head CoG

18 CASR Road Safety Research Report | The effect of bull bars on head impact kinematics in pedestrian crashes
Appendix C - Trajectories of the head CoG relative to vehicle
Patrol
Rodeo
Hilux
Landcruiser
Figure C1: Trajectories of the Head CoG relative to the vehicle