best practice review of drink driving enforcement in south...
TRANSCRIPT

Best practice review of drink drivingenforcement in South Australia
LN Wundersitz, JE Woolley
CASR REPORT SERIES
CASR036
August 2008

Report documentation
REPORT NO. DATE PAGES ISBN ISSN
CASR036 August 2008 47 978 1 920947 36 1 1449-2237
TITLE
Best practice review of drink driving enforcement in South Australia
AUTHORS
LN Wundersitz, JE Woolley
PERFORMING ORGANISATION
Centre for Automotive Safety ResearchThe University of AdelaideSouth Australia 5005AUSTRALIA
SPONSORED BY
Department for Transport, Energy and InfrastructurePost Office Box 1Walkerville SA 5081AUSTRALIA
AVAILABLE FROM
Centre for Automotive Safety Researchhttp://casr.adelaide.edu.au/publications/researchreports
ABSTRACT
The Drug and Alcohol Task Force of the Road Safety Advisory Council has initiated this project to maximise theeffects of drink driving enforcement in South Australia. This report describes the outcome of a review based on aninternational literature review, analysis of police data, comparisons with interstate data and discussions withpersonnel at varying levels within the hierarchy of the SA Police. Ways in which drink driving enforcement may beenhanced in South Australia are discussed.
KEYWORDS
Drink Drive, Enforcement, Random Breath Testing, Mobile RBT
© The University of Adelaide 2008The views expressed in this report are those of the authors and do not necessarily represent those of theUniversity of Adelaide or the sponsoring organisation.
CASR Road Safety Research Report | Best practice review of drink driving enforcement in South Australia iii
SummaryDrink driving continues to be a major causal factor in fatal and injury crashes. The Alcoholand Drugs Taskforce was asked by the Regulation and Enforcement Subcommittee torecommend a project with the greatest potential to reduce the number of drink drivecrashes in South Australia. The Taskforce concluded that the most effective project wouldbe to explore the means by which drink-drive enforcement might be improved. Theoutcomes from the project are to be used to assist the SA Police in maximising theeffectiveness of police enforcement in reducing drink driving in South Australia.
The current project consists of a review of drink driving enforcement in South Australia, asof June 2007, conducted with the following stages:
• A review of national and international literature on optimal drink driving enforcementpractices
• The creation of a snapshot of current South Australian practices taking into accountcurrent legislation, supporting mass media and police data
• A comparison of the South Australian situation with that of other jurisdictions
• Interviews with SA Police operating within differing levels of the organisationalhierarchy
A literature review has revealed three recent Australian reports on drink drivingenforcement. These highlight a number of issues relevant to the South Australian context.
There was a need to conduct static Random Breath Testing (RBT) operations in the earlypart of the evening (i.e. 6 to 10pm) so that potential drink drivers see drink drivingenforcement on their way to drinking venues. This may deter drink driving by influencingsubsequent alcohol consumption or the decision to drive. To detect actual drink drivers, RBTis also needed later in the evening (after midnight) at times when the highest drink driverates occur. The precise proportion of each enforcement method needed to minimise drinkdriving behaviour is unknown.
A mixed model of enforcement, covert enforcement in conjunction with overt enforcement,is needed to increase the perceived link between visible enforcement activities anddetection. There is also a strong need to balance targeted and random activities, anddetection and deterrence. In practice, mobile RBT should be used in conjunction with staticRBT whenever possible. Mobile RBT should not become the sole means of detection at theexpense of general deterrence.
In rural areas, static RBT based primarily on deterrence is unlikely to have a great effect onrural drivers. Therefore, detection of drink drivers would be the most useful strategy in suchcommunities and is best achieved through unpredictable, smaller, covert mobile operations.Covert mobile operations are valuable in that they provide a solution to the limited policepersonnel available in rural regions and the ‘grapevine effect’ known to undermine the valueof a highly visible static RBT station. However, covert operations should complement overttesting methods and all enforcement strategies should consider local factors.
When RBT targets are set, they should include time-based factors (i.e. hours of drink driveenforcement) and ideally use crash data to measure outcomes.
Other literature has found that RBT operations are effective in reducing overall numbers ofcrashes and in New Zealand benefit cost ratios in the order of 26:1 have been calculated.While there is some evidence to suggest that mass media can produce results in isolation,many studies point to the fact that an enhanced effect can be achieved when mass media iscoordinated to support drink driving enforcement activity.

iv CASR Road Safety Research Report | Best practice review of drink driving enforcement in South Australia
A legislative review indicated that South Australia was on a par with the provisions of drinkdriving legislation in other states. The most significant change in legislation in recent yearswas the introduction of mobile RBT and the lifting of prescribed period restrictions in mid-2005. This has meant that SAPOL can now engage in enforcement activities in line withinterstate practices.
A snapshot of drink drive enforcement in South Australia was obtained through the reviewof SAPOL data and interviews with SAPOL personnel. This has indicated reasonable activityby Local Service Areas (LSAs), operating autonomously, to meet targets set by a corporatecommand. The arguments for this structure are that LSAs have ownership of drink drivingenforcement (i.e. it becomes their problem) and they also become more accountable interms of reaching performance targets. These targets consist of the number of overall testsperformed and the proportion of detections.
The reliance on the autonomy of LSAs has many positive and negative aspects, however, inthe context of this report, most are seen as positive. An issue that cannot be meaningfullyaddressed is if the LSAs are properly resourced to conduct adequate levels of drink drivingenforcement without distraction. A comparison with other states suggests that SouthAustralia is lagging behind the best performing states in terms of the number of overall testsand detections performed. The lack of mobile RBT in recent years may be a significantcontributor to this situation. Data from late 2005 and 2006 will be needed to see if thissituation has changed. This would likely have much improved detection rates but only amodest increase in the number of overall tests. A further review of the equipmentpossessed by police forces in other states would also assist in the interpretation of thecircumstances.
The maintenance of the Northern and Southern Traffic Enforcement Sections is seen asbeneficial and maintains a necessary higher profile focus on traffic enforcement. Howevertheir individual impact is difficult to assess and the extent to which they can bolster LSARBT activity over the whole state given current resources must be limited. The assignmentof dedicated traffic police to the LSAs is also viewed as a positive influence provided thatthere are adequate resources to permit these personnel to remain focused on trafficenforcement duties.
The Traffic Support Branch provides timely information to LSAs when requested, howeverthe task of recording and retrieving data does not appear to be streamlined. The difficulty ofentering sometimes duplicate data into the various computer systems was highlighted onmore than one occasion as being problematic.
Currently, the number of breath tests in South Australia is recorded by LSAs who eithercount discarded mouthpieces or use a counting device. There appears to be confusion as towhether electronic data from breath testers can be downloaded. Many jurisdictions inAustralia either have, or are moving towards the data logging of preliminary breath tests.There would be significant benefits if data were to be recorded from alco-testers in the fieldand downloaded. SAPOL could increase its intelligence in relation to how much drink driveenforcement was being conducted and the times at which this was occurring. Suchinformation would be invaluable to the planning of future enforcement activities. However,this would require some administration and cultural issues to be overcome.
There has been very little mass media content focused on drink driving enforcement in thepast few years. Current feedback amongst a small sample of 16 to 30 year olds suggeststhat the perception of being caught if engaging in drink driving behaviour is small. Morerobust testing is needed to develop a coordinated mass media campaign that complimentspolice enforcement. If mass media campaigns are to be used, the coordination ofenforcement activity with mass media publicity should be given high priority.

CASR Road Safety Research Report | Best practice review of drink driving enforcement in South Australia v
Conclusions
The introduction of mobile RBT operations outside of prescribed periods in 2005 has clearlyenhanced the ability of the police to perform drink drive enforcement and bring SouthAustralia in line with national practices.
Corporate policies are in place to try to ensure that LSAs are held accountable for their drinkdriving enforcement performance. The mix of enforcement approaches is left to thediscretion of the LSA commanders, however, the high number of tests required lends itselfmore towards testing for quantity rather than quality. This is not inconsistent with thegeneral deterrence principle of RBT, however, a degree of specific deterrence also needs tobe delivered with detections. It is understood that proportion of detections by mobile andstatic RBT is also a performance measure and, if adhered to, should deliver some elementof quality into the testing.
The following items should be considered to further enhance drink driving enforcement inSouth Australia:
• The combination of static RBT with mobile RBT is viewed as particularly effectiveand should be conducted whenever resources allow
• Mobile RBT is considered the most effective form of drink driving enforcement inrural areas
• Ensure that mobile RBT does not become the sole means of enforcement at theexpense of general deterrence (unlikely given current testing targets)
• National and international evidence suggests that static and mobile RBT, asconducted in Australia, continues to be the most effective method for drink drivingenforcement
• The literature suggests that time based allocations for drink driving enforcementshould also be specified; ideally alcohol related crash data should also be used butinterpretation can be difficult, particularly in terms of individual interventions
• To alter motorists behaviour for the rest of the evening and avoiding drink drivingepisodes altogether, RBT should continue to operate earlier in the evening (e.g. 6pmto 10pm) and preferably near drinking establishments
• RBT operations are also required later in the evening (e.g. midnight to 2am) whenmost drink driving occurs for general and specific deterrence
• There is scope to improve data collection and reporting systems
• It is essential that mass media campaigns are coordinated with enforcementactivities
• On a per capita basis, there is scope for South Australia to increase its testing anddetections to be more in line with national practices
It should be noted that these conclusions are made based on data available to 2004 whenmobile RBT had been introduced for prescribed periods only. Further analysis of datafollowing the lifting of restrictions on mobile RBT operations from late 2005 and 2006 wouldbe necessary to ensure that the current situation was properly interpreted. This would likelyresult in much improved detection rates but only a modest increase in the number of overalltests.
What is not considered by this review are the resources available to SAPOL when comparedto the Police organisations in other states due to the difficulty in obtaining this type ofinformation.

vi CASR Road Safety Research Report | Best practice review of drink driving enforcement in South Australia
Contents
1 Introduction............................................................................................................................. 1
2 Literature review: What is considered best practice? ........................................................... 2
2.1 Police enforcement ...................................................................................................... 2
2.2 Publicity ........................................................................................................................ 8
2.3 International research evidence.................................................................................. 8
3 Current snapshot of South Australian practices .................................................................. 11
3.1 Current legislation ...................................................................................................... 11
3.2 Data ............................................................................................................................ 13
3.3 Police drink driving enforcement practices in South Australia (based oninterviews with SAPOL).............................................................................................. 18
3.4 Drink driving publicity in South Australia................................................................... 24
4 Discussion............................................................................................................................. 27
5 Conclusions........................................................................................................................... 30
Acknowledgements ...................................................................................................................... 32
References .................................................................................................................................... 33
Appendix A - Legislation comparison ........................................................................................... 35
Appendix B - Penalty comparison ................................................................................................ 40

CASR Road Safety Research Report | Best practice review of drink driving enforcement in South Australia 1
1 IntroductionDrink driving continues to be a major causal factor in fatal and injury crashes. The Alcoholand Drugs Taskforce was asked by the Regulation and Enforcement Subcommittee torecommend a project with the greatest potential to reduce the number of drink drivecrashes in South Australia. The Taskforce concluded that the most effective project wouldbe to explore the means by which drink-drive enforcement might be improved. Theoutcomes from the project are to be used to assist the SA Police in maximising theeffectiveness of police enforcement in reducing drink driving in South Australia.
The current project consists of a review of drink driving enforcement in South Australia, asof June 2007, conducted with the following stages:
• A review of national and international literature on optimal drink driving enforcementpractices
• The creation of a snapshot of current South Australian practices taking into accountcurrent legislation, supporting mass media and police data
• A comparison of the South Australian situation with that of other jurisdictions
• Interviews with SA Police operating within differing levels of the organisationalhierarchy
It should be noted that it would be unrealistic to expect that this report can suggest whatlevel and combination of drink drive enforcement is optimal. To do so implies that datarelating to enforcement that has exceeded the point of maximum return is available. To ourknowledge such data does not exist, nor are such levels of enforcement likely to be adoptedby practicing police forces in our context. The report does, however, report on what isconsidered “best practice” given reasonable enforcement resources from a national andinternational perspective.

2 CASR Road Safety Research Report | Best practice review of drink driving enforcement in South Australia
2 Literature review: What is considered best practice?The majority of research concerned with identifying best practice principles for randombreath testing and drink driving enforcement has been conducted in Australia.
The present review strongly features three recent Australian reports that examined bestpractice approaches to drink driving enforcement based primarily on literature reviews. Themost recently published report relied heavily on Victorian data examined in previous studiesby the Monash University Accident Research Centre (MUARC), in addition to aninternational literature review (Delaney et al., 2006). The other two reports interviewedpolice and road safety experts from most states and territories within Australia and NewZealand (Harrison et al., 2003; Hendrie, 2003). Rather than repeating a discussion of theliterature and interviews covered in these reports, salient findings from the reports and newliterature are examined.
2.1 Police enforcement
2.1.1 Random breath testing
Random Breath Testing (RBT) is a form of drink driving enforcement that was firstintroduced into Australia, in the state of Victoria, in 1976. Other states introduced RBT in the1980s with South Australia first implementing RBT in 1981 in what was termed a ‘very lowkey’ manner (Homel, 1990).
Currently in South Australia, and in most states of Australia, RBT operations may be either‘stationary’, or ‘mobile’. Traditional stationary or static RBT involves setting up checkpointson the side of the road. Motorists passing these points are randomly selected to be pulledover to the side of the road where they must submit to a preliminary breath test. If a driverrecords a BAC over the legal limit, they are required to submit to a breath test on evidentiaryequipment. Mobile RBT, a method used only in recent years, allows police in any mobilepolice vehicle (i.e. car or motorcycle) to stop vehicles at random and breath test the driver.An important aspect of RBT, regardless of method, is that any driver may be pulled over andbreath tested without any suspicion that the driver is impaired by alcohol.
The theoretical basis for RBT lies in Deterrence Theory (Homel, 1988; Ross, 1982).According to this theory, the aim of RBT is to deter potential drink drivers rather than detectdrink drivers. Deterrence is based primarily on the risk of detection and the swiftness andseverity of punishment. Wagenaar and Maldonado-Molina (2007) maintain that theswiftness or celerity of punishment is more important than the severity of penalties.Specific deterrence occurs when a drink driver is apprehended and punished, andconsequently is deterred from future drink driving. General deterrence results from theperception that there is a high risk of detection and punishment for drink driving. Homel(1990) identified a number of factors that assist in maximising the perceived risk ofdetection: RBT must be highly visible, maintain a high level of testing, be unpredictable withrespect to location, must give the impression of being ubiquitous, be difficult to evade onceseen, and must be well publicised.
Australian studies evaluating the effectiveness of RBT, in terms of crash reductions, havevaried significantly in their findings. Estimates range from a 35 per cent decrease in fatalcrashes (Henstridge et al., 1997) to no significant differences in fatal crashes (Henstridge etal., 1995). Hendrie (2003) conducted a comprehensive review of studies examining theeffectiveness of RBT in Australia and concluded that RBT was not always effective inreducing crash and injury outcomes although there was widespread community support.The inconsistent findings were attributed to methodological difficulties encountered in theevaluations, leading to the conclusion that “no evaluations using effective research designhave been conducted” (p.18). The two main problems were a lack of data on alcoholcrashes and separating the effects of RBT from other road safety programs.

CASR Road Safety Research Report | Best practice review of drink driving enforcement in South Australia 3
Hendrie (2003) also emphasised that RBT programs vary significantly in how they aredelivered, managed, and in the intensity of operations across jurisdictions. Indeed, RBT isnot a uniform intervention, so it is not surprising that there are contrasting findings regardingits effectiveness. The challenge is then to find which operations and strategies are mosteffective in reducing drink driving behaviour. Hendrie (2003) also remarked that “mostevaluations of random breath testing have assessed the effect of the overall program, ratherthan comparing alternative strategies or different components of enforcement and publiceducation programs” (p.24).
In order to maximise the effectiveness of RBT operations, the following sections reviewAustralian and international literature to determine which aspects of random breath testingformulate best practice.
2.1.2 Operations
Time of day, day of week
Homel (1990) suggests that to increase the perceived probability of detection (generaldeterrence), random breath testing should be conducted on days and at times when it ismore likely to be seen by potential drink drivers. Alternatively, to detect drink drivers,random breath testing needs to be at times when most drink driving occurs. Homel (1990)maintains that experimentation is required to determine the balance of testing at times andplaces of high traffic volume when the incidence of drinking and driving is low, and whenthe incidence of drink driving rates is high but the traffic volume is low.
Night-time surveys of drink driving provide information about times when the incidence ofdrink driving is greatest. Observations from the most recent late night surveys inmetropolitan Adelaide indicated that drink driving rates were highest on Wednesday andThursday nights, and after midnight (Kloeden & McLean, 1997). Roadside breath testingsurveys conducted more recently in Perth during 1999 (Friday to Sunday, 10pm-3am) foundthat drink driving rates were highest after midnight and on Friday nights (Ryan, 2000). Timeseries analysis of Tasmanian RBT data indicated that tests conducted before midnight weremore important as a general deterrent than late night or daytime testing. However, lownumbers of crashes and tests after midnight precluded definitive conclusions (Henstridge etal., 1997).
Harrison (2001) suggests that potential drink drivers need to know about the risk ofdetection before going to the place of drinking. For this reason, he recommends placingenforcement activity closer to where the decision to drink drive is made. According to hisresearch, drink driving decisions are made at two locations or points in time: driving to thealcohol outlet, rather than using other transport options, and the level of consumption ofalcohol after driving to the alcohol outlet. The decision to drive is influenced by word-of-mouth while the amount of alcohol consumed is influenced by personal awareness ofenforcement activities (i.e. direct contact with RBT). However, enforcement appears to haveno effect on the decision to drive once large amounts of alcohol have been consumed.Therefore, enforcement activities are more likely to be influential earlier on in the decisionmaking process. Consequently, enforcement should be on roads where it is highly visibleand aim to increase the perceived risk of detection before drinking occurs (early evening) sothat potential drink drivers will recall enforcement activities when making the decision abouthow much alcohol to drink.
To summarise, the use of RBT earlier in the evening (8-10pm) could have some directinfluence on decisions by drivers whether to risk drink driving or not upon arriving at drinkingestablishments. The combination of early evening and late night RBT operations couldmaximise the effect of RBT, however, the proportion of each approach that would maximisedeterrence is unknown.

4 CASR Road Safety Research Report | Best practice review of drink driving enforcement in South Australia
Method of RBT operations and spatial deployment
A consistent issue in determining best practice RBT enforcement is finding the appropriatebalance between overt or highly visible stationary RBT seeking to maximise exposure toRBT and low profile covert operations such as mobile RBT. The former has an effect ofgeneral deterrence while the latter essentially focuses on detection or specific deterrence.Homel’s Deterrence Model supports highly visible RBT, as this is important in increasing theperceived risk of detection.
However, decision-making models have recently challenged the Deterrence Model, in termsof the effects of RBT enforcement practices. Decision making models suggest a greateremphasis should be placed on specific deterrence or detection because exposure toapprehension and punishment may reduce the likelihood that drink driving behaviour isconsidered appropriate at the time when making the decision whether to drive afterconsuming alcohol (Harrison, 2001). Thus, highly visible RBT should be accompanied bycovert mobile operations.
From a practical viewpoint, mobile operations are useful in discouraging drivers from usingback streets to avoid static RBT (Harrison et al., 2003). However, few studies haveevaluated the effectiveness of mobile RBT methods and in most studies, RBT data havebeen confounded with those of stationary RBT (Harrison et al., 2003). Data from SouthAustralia indicates that mobile RBT is associated with much higher detection rates thanstatic RBT; 29 versus 5.7 drivers detected with an illegal BAC per thousand tested,respectively (Baldock et al., 2007). Trends in mobile RBT detection rates in South Australiaand other Australian states are discussed in Sections 3.2.1 and 3.2.2.
Nevertheless, while mobile RBT might be more effective in detecting drink drivers, it isimportant that mobile operations do not become the sole method of enforcement at theexpense of general deterrence, but compliment visible RBT (Harrison et al., 2003; Homel,1990).
Deterrence theory advocates that highly visible RBT should also be accompanied byselective targeted RBT operations to maximise detection of persistent drink drivers.Targeted testing refers to RBT located on roads in close proximity to known problemlicensed venues. Harrison et. al. (2003) maintain that the location of targeted covertoperations should be intelligence led such that target venues are determined by alcoholsales, local knowledge, and data collected from offenders about their drinking location.However, caution must be exercised so that the latter method does not reflect policepractices. It should be noted that enforcement strategies are unlikely to have a significanteffect on high-risk or recidivist drink drivers (Williams et al., 2007).
Harrison et al. (2003) suggest that strategies need to be formulated so that patrons do notview the venue as “high-risk”. Persistent enforcement surrounding a specific venue couldresult in drink drivers avoiding the location, rather than reducing drink driving behaviour. Ingeneral, repetitive enforcement operations, particularly in rural areas, should involve a highdegree of randomness about frequency and operation times to result in reduced drinkdriving, rather than avoidance behaviour.
In summary, a mixed model of covert enforcement in conjunction with overt enforcement,is needed to increase the perceived link between visible enforcement activities anddetection. There is also a strong need to balance targeted and random activities, anddetection and deterrence. However, there are no suggestions in the literature prescribingwhat balance these activities should be conducted at.
Rural enforcement issues
Random breath testing methods used in urban areas are not as successful in rural areas andthis has prompted considerable research into rural drink driving enforcement. Indeed, thereare a number of factors that differentiate drink driving in rural regions from that in urban

CASR Road Safety Research Report | Best practice review of drink driving enforcement in South Australia 5
areas: long travel distances to drinking venues, a lack of public transport, limited policeresources, close knit communities with strong informal communication networks, and localpolice are well known in the community (Ferguson et al., 1999).
Of these problems, the existence of the strong informal communication network is of mostconcern. Rural residents quickly hear about the location of RBT operations, which enablesdrink drivers to avoid stationary RBT sites if they have good knowledge about back roads.Such avoidance behaviour was confirmed by a survey of rural bar patrons (Harrison &Fitzharris, 1999). Approximately half of those surveyed said they would use alternativeroutes to get home if aware of an RBT site. Thus, many rural drivers aware of enforcementappear not to adjust their perceived level of detection nor change their drink drivingbehaviour.
Experiments with a number of drink driving enforcement methods in rural Victoriasuggested that mobile RBT surrounding booze buses (i.e., stationary RBT) increaseddetection rates (Healy & Wylie, 1998). Moreover, although a formal evaluation was notundertaken, broad trends in alcohol-related crashes were encouraging, suggesting thatcovert operations should be used to compliment overt testing in rural areas.
Harrison (2001) investigated three drink driving enforcement strategies in rural communitiesin Victoria and South Australia: overt, covert and a combination of both. Consistent withprevious research, covert operations resulted in higher detection rates. Of interest, surveyresults from this study showed that the general community became more aware ofenforcement during overt operations while bar patrons were more aware of enforcementduring covert operations. However, survey results also demonstrated a lack of correlationbetween perceived risk of detection and experience of encountering RBT enforcementamong rural drivers. Harrison suggested that the nature of rural enforcement might beresponsible for this observation; following blitzes, there are long periods without any drinkdriving enforcement.
While covert operations appear to be promising in rural areas, high visibility overtenforcement still has an important role in increasing community awareness. Harrison et al.(2003) recommends that highly visible enforcement in rural towns with high social cohesion(regardless of the town population size) can improve its effectiveness by changingenforcement locations at irregular intervals to reduce the effect of local ‘word-of-mouth’ andheighten the perception of the level of enforcement activities.
There is an argument that detection-based enforcement in rural towns may be bestconducted using non-local police. This would minimise the pressure for local police to beless stringent and provide additional policing resources. However, this strategy may becostly and remove police resources from other areas where they are needed. This issue isdiscussed further in later sections.
On a general note, it is important that RBT enforcement methods adapt to thecharacteristics of the region where it is being implemented, rather than assuming a ‘bestpractice’ model fits every situation (Harrison et al., 2003; Hendrie, 2003). Enforcementstrategies should match the particular environmental, social and cultural factors unique tothe local area.
Overall, it appears that static RBT based primarily on deterrence is unlikely to have a greateffect on rural drivers. Therefore, detection of drink drivers would be the most usefulstrategy in such communities and is best achieved through unpredictable, smaller, covertmobile operations. Covert mobile operations are valuable in that they provide a solution tothe limited police personnel available in rural regions and the ‘grapevine effect’ known toundermine the value of a highly visible static RBT station. However, covert operationsshould compliment overt testing methods and all enforcement strategies should considerlocal factors.
6 CASR Road Safety Research Report | Best practice review of drink driving enforcement in South Australia
2.1.3 Strategic management
Setting RBT targets
Target levels of RBT testing in jurisdictions are usually test-based, time-based, detection-based, crash-based or a combination of these. Numerical test-based targets, set either as atotal number or as a proportion of licensed drivers, put pressure on police to conduct highlyvisible deterrence based campaigns that occur when traffic volumes are greatest but notnecessarily at high alcohol times. For example, in Queensland a high level of breath testingwas recommended with a quota of tests to licensed drivers of 1:1. A review of policeoperational policies and practices revealed that police felt reaching quotas placed too muchemphasis on quantity rather than quality of testing, leading to RBT operations conducted atlow alcohol/high traffic volume times (Hart et al., 2003).
A positive effect of test-based targets is that they will result in high levels of campaignawareness and general deterrence. However, awareness of enforcement does notnecessarily lead to an increased perceived risk of detection (i.e. drink driving may occurwhen there is little high visibility enforcement) (Harrison et al., 2003). On the other hand,detection oriented targets would result in higher perceived risk of detection but at theexpense of general deterrence. In addition, the long-term goal of reducing the detection ratewould be inconsistent with the short-term goal of increasing detections.
Harrison et al. (2003) recommends that setting a target number of person hours of drinkdriving enforcement for each jurisdiction provides the most flexibility for local areamanagement and allows strategies that are more balanced. Crash reduction targets (i.e.alcohol-related crashes) also provide a clear outcome based assessment of policeperformance although many other factors may influence these figures (e.g. enforcementoperations in other suburbs). Crash-based outcomes may be better for assessing localenforcement operations in rural areas where geographic isolation means there is lessinfluence from activities in other areas. However, crash based outcomes can be difficult tointerpret especially in the context of individual interventions. A combination of time-basedtargets for enforcement activities and the use of alcohol related crash outcomes appear tobe desirable.
Structure of police organisation and operations
There is on-going debate concerning whether centralised or decentralised approaches topolicing provide the best model for drink driving enforcement. The main advantage ofregionalisation is that it provides better flexibility for enforcement activities and operationsare able to respond better to local issues. One of the disadvantages is that regionalisedoperations are not under as much scrutiny as if there were close central control.
With respect to the management of enforcement operations, information and strategiesdeveloped by a central traffic support unit are important for statewide drink drivingenforcement programs. Guidance given directly to local police by a central intelligence ledsource and local knowledge are both important for addressing specific local drink drivingproblems. Harrison et al. (2003) suggested setting up a direct traffic contact person in eachjurisdiction so that regular meetings can be held between local and central traffic supportpolice to exchange information and encourage stronger links.
We are not aware of any studies that have formally evaluated the effectiveness of thedecentralisation of police operations. However, some studies conducted interviews withpolice and identified some operational and motivational issues concerned withregionalisation. For example, Harrison et al. (2003) noted that police expressed concernabout a lack of experience and skills in breath testing operations and management withregionalisation. They also articulated concern about a lack of focus on traffic issues if thelocal commanding officer did not see it as a priority. Harrison et al. (2003) suggested that

CASR Road Safety Research Report | Best practice review of drink driving enforcement in South Australia 7
processes such as setting enforcement targets or auditing at the local level would improveaccountability and ensure drink driving is a priority.
Interviews with police have also suggested that some police felt crime reduction shouldhave a greater priority for policing than traffic enforcement (Harrison et al., 2003; Hart et al.,2003). Harrison et al. (2003) suggested that police could be motivated to promote drinkdriving enforcement by emphasising the link between drink driving and other criminalactivity (e.g. the visible presence of police RBT activities might deter criminal activity).Harrison et al. (2003) also recommended that the value of deterrence, not just detection, bepromoted among police to facilitate a greater appreciation of the importance of highly visibleRBT operations.
Part of the decentralisation process typically involves traffic duties (i.e., RBT activities)transferred to police conducting general duties rather than dedicated traffic police. Indeed,interviews with general duties police have revealed that some felt RBT should not be theirresponsibility, but that of specialised traffic police (Harrison et al., 2003). There are fewstudies evaluating the effects of structural reorganisation among police. However,Mathijseen (1995) reported a significant drop in RBT testing levels in the Netherlandsfollowing a reorganisation of Dutch police when traffic law enforcement was integrated intogeneral police duties.
Some jurisdictions in Australia (e.g. Victoria) have successfully utilised a centrally locatedtraffic alcohol unit to take on the responsibility for achieving specific drink drivingenforcement targets and to assist jurisdictions in conducting RBT (Harrison et al., 2003). Acentral dedicated unit has the flexibility to move into targeted areas, particularly in ruralareas, to conduct additional enforcement operations. Such a unit can provide extraresources for regions and overcome community involvement issues faced by local police. Inaddition, officers in these units develop a high level of expertise in drink drivingenforcement, which can result in greater productivity and commitment to the cause(Hendrie, 2003).
Intelligence led enforcement
In order to improve the quality and outcomes of drink driving enforcement activities,comprehensive intelligence led enforcement is essential. Traffic intelligence systems shouldmake use of information relating to crashes, traffic volumes, alcohol sales and previousenforcement activities when planning new RBT operations. The issue is how to bestassimilate and use this information to influence the timing, location and style ofenforcement activities.
Hendrie (2003) suggests using geographic information systems to map and identifylocations where a large number of alcohol crashes occur or locate sites where highproportions of drivers test over the legal BAC limit. Although location and time specifictargeting is popular politically and focuses on crash outcomes, Harrison et al. (2003) warnthat enforcement activities based entirely on crash and offence data (i.e. black-spotapproach) can become predictable in terms of location or time of day. Consequently,enforcement campaigns need to retain an element of randomness or unexpectedness tohave a strong impact on driver behaviour.
Information from alcohol sales can be useful for targeted enforcement in identifying licensedvenues with high alcohol sales. In addition, information from travel surveys could be used todetermine what routes drivers take to and from drinking locations.
Harrison et al. (2003) noted that many jurisdictions in Australia either have, or are movingtowards the data logging of preliminary breath tests. This data can be used to formulateenforcement strategies, particularly for determining high alcohol locations, days, and times.However, Harrison et al. observed that not all these jurisdictions made significant use of thisinformation.

8 CASR Road Safety Research Report | Best practice review of drink driving enforcement in South Australia
2.2 PublicityHomel (1990) specified that publicity accompanying RBT activities should not simply beeducational but have a deterrent value. Effective drink driving enforcement strategies shouldfocus on the perceived and actual risk of detection, automatically apply certainconsequences to detection, and be part of potential offender’s awareness prior to drinking(Harrison, 2003).
Harrison (2001) suggested that publicity focusing on the early decisions in the chain ofdecision making relating to drink driving (i.e. how people get to drinking venues) may bemore beneficial than targeting decisions later on (i.e. how to get home).
Elvik and Amundsen (2000) considered media campaigns to be an ineffective drink drivingcountermeasure in Sweden, except in some cases when combined with other measuressuch as enforcement and legislation changes. Elliot (1993) reported that enforcementaccompanied by mass media publicity increased the effectiveness of campaigns. Elliot(1993) also found that there were some cases where television campaigns were effectivewithout enforcement. Delhomme (1999) reported that alcohol-related media campaignsreduced crashes by 6.9 per cent during a campaign, and the effects were greater inconjunction with enforcement and/or new legislation.
Tay (2005) reanalysed drink driving enforcement and publicity campaigns in Victoria andfound that the effectiveness of advertising and enforcement campaigns appeared not to bedependent on each another. This finding suggests that it may be possible for publicitycampaigns to work without being accompanied by enforcement.
Most literature suggests that mass media combined and coordinated with enforcementactivities can be effective in reducing crashes. Although there is some evidence that massmedia can be effective in isolation to enforcement, the largest effects are observed when itis coordinated with enforcement activities. The communication content and style also playsa role in translating a campaign into behavioural outcomes. For example, there is little pointfocussing on the threat of being detected if police are not visible on the roads.
2.3 International research evidenceThe majority of studies evaluating best practice strategies for random breath testingactivities have been conducted in Australia. However, various forms of random breathtesting are undertaken in New Zealand (Compulsory Breath Testing - CBT) and an increasingnumber of countries in Europe. In the United States, ‘selective breath testing’ (SBT) ofdrivers is conducted at sobriety checkpoints. Selective testing differs from the RBTapproach where all stopped drivers are tested. Drivers stopped at the SBT checkpoint canonly be breath tested if police have reason to suspect they have been drinking.Consequently, this review of best practice drink driving enforcement in the internationalliterature does not cover studies evaluating selective breath testing.
2.3.1 Europe
There is general consensus in the literature that random breath testing, rather than testing“on-suspicion” is the most effective countermeasure against drink driving. Several recentstudies from Europe have reinforced the value of police enforcement and random breathtesting. For example, Makinen and Zaidel (2003) found that police enforcement is the mostcost effective road safety measure. They estimated that drink driving enforcement resultedin fatal and injury crash reductions of 9 per cent and 7 per cent, respectively. Moreover, theirreview of enforcement practices revealed that European countries with a long history ofdrink driving enforcement including low legal limits, a relatively high objective risk ofdetection, and supporting mass media had the lowest drink driving rates.
CASR Road Safety Research Report | Best practice review of drink driving enforcement in South Australia 9
A meta-analysis of 39 studies evaluating the effects of drink driving enforcement (eitheralone or in conjunction with other measures) showed that significant reductions in all crashseverity types could be accomplished (Elvik, 2001). Delaney et. al. (2006) states that themagnitude of these reductions appear to be smaller than those found for drink drivingenforcement programs in Australia. They suggest that the lower magnitude of effectsreported in Elvik’s study were attributable to the inclusion of enforcement practices thatwere not conducted randomly and the restricted testing of only those suspected ofexceeding the BAC limit. In contrast to Delaney et al. (2006), Hendrie (2003) reported thatnot all Australian studies have found RBT to be effective.
With respect to the different components of police enforcement of drink driving, ICFconsulting (Consulting, 2003) rated random breath testing as the most effectivecountermeasure, followed by the severity and certainty of sanctions, testing intensity, andthen the legal blood alcohol level. Note that Wagenaar and Maldonado-Molina (2007) arguethat the swiftness or celerity of punishment after drink driving detection is more effectivethan the severity of penalties. Their findings were based on research that examined licencesuspension policies and fatal crash data in 46 US states.
The ICF report (2003) gave 14 European Union member states a weighted numerical scorefor drink driving enforcement based on the existence of random breath testing activities,severity and certainty of sanctions, testing intensity, and the legal blood alcohol level. Thesescores were compared to the percentage of drivers involved in fatal crashes. There were nocorrelations between fatal crash involvement and enforcement practices and sanctions. Thefailure to find any relationships appeared to be at least partly due to the unreliable alcohol-related crash data. Koornstra and colleagues (2002) also found problems with incomplete orinconsistent crash data among several European countries (i.e., Sweden, Netherlands,United Kingdom). For this reason, few studies have attempted to estimate the reduction incrashes for drink driving enforcement. Based on their best estimate, Koornstra et al. (2002)reported that that drink driving crashes could be reduced by approximately 10 per cent in theUK and the Netherlands.
From the analyses mentioned above, the benefits of drink driving enforcement gained bythe 14 European Union member states were calculated under two scenarios: if enforcementwas implemented as was conducted in the best performing member state, and ahypothetical ‘perfect state’ enforcement program that met the requirement of an ECWorking paper (Consulting, 2003). Sweden was considered the best performing memberstate in terms of drink driving countermeasures; they had a 0.020 mg/L BAC limit, a randombreath testing program, a testing intensity of 22 per cent of licensed drivers per year, andvery severe sanctions if detected drink driving. Based on previous research, it wascalculated that a benefit-cost ratio of 8.1 could be attained if all member states adopted thesame enforcement practices as Sweden. Furthermore, if the testing was increased to anintensity of 40 per cent of licensed drivers (i.e., perfect state’ scenario), a benefit-cost ratioof 4.7 could be achieved (note that the 40 per cent testing rate is similar to the lowesttesting levels of Australian States). These estimates also accounted for costs associatedwith publicising the drink driving countermeasures. However, the level of publicity costswas not specified.
A review prepared by experts from across the European Union examined successfulstrategies and cost-effective enforcement methods for a number of driver behavioursincluding drink driving (ETSC, 1999). A number of sensible ‘elements of successfulstrategies’ for drink drive enforcement were derived, based on knowledge of currentenforcement practices and studies reported in the literature. However, these studies did notevaluate the individual components of drink driving enforcement separately and generallyappear to follow deterrence theory. The ‘elements of successful strategies’ included:
• Increased perceived probability of detection through programs that involve: highlevels of testing achieved primarily with RBT (a recommended testing level of atleast one in ten drivers every year, or one in three if possible), unpredictable

10 CASR Road Safety Research Report | Best practice review of drink driving enforcement in South Australia
enforcement in terms of time and location, widespread deployment, enforcementthat is difficult to avoid, and highly visible police operations.
• Targeted enforcement (i.e. around licensed premises) to maximise detection ofpersistent drink drive offenders.
• Enforcement accompanied by publicity to inform and increase public awareness ofenforcement activities (i.e., increase perceived risk of detection). Publicity can alsoassist in reducing the public acceptance of drink driving.
• Enforcement that is monitored carefully and altered if necessary. Continual contactbetween police, researchers and policymakers is important.
Overall, evidence from European literature supports intensive breath testing routines (andsevere sanctions) to maximise the effect of drink driving enforcement and to reduce alcohol-related crashes.
New Zealand
Miller, Blewden and Zhang (2004) calculated benefit-cost ratios of three differentapproaches to Compulsory Breath Testing (CBT), the New Zealand equivalent of RBT. Theapproaches included: 1) intensive, moderate profile CBT, 2) CBT with an enhanced mediacampaign, and 3) ‘aggressively’ visible booze buses and enhanced community campaign.Although all forms showed greater benefits than costs, the CBT approach encompassingaggressive, highly visible booze buses and a community campaign (the most comprehensivepackage) was the most cost effective, in terms of reducing late night serious and fatalcrashes (estimated 54% reduction in these crashes nationally). In terms of cost benefitanalysis, it was found that the comprehensive package of enforcement was most costbeneficial with a return on investment of 26.1. CBT alone and CBT operating with a mediacampaign were also cost beneficial but to a lesser extent (14.4 and 18.8, respectively).

CASR Road Safety Research Report | Best practice review of drink driving enforcement in South Australia 11
3 Current snapshot of South Australian practicesWhile the previous sections have reviewed the current Australian and international literatureto determine what is considered best practice in terms of drink driving enforcement, thissection examines the current drink driving enforcement practices in South Australia. Thissection begins by reviewing South Australian legislation related to drink driving. Followingthis, the level of RBT testing and detections is explored and comparisons are made withother Australian jurisdictions. Based on interviews with police, drink driving enforcementactivities are described and issues surrounding these activities are discussed. Finally, recentdrink driving publicity campaigns are examined in terms of activities and the level ofadvertising.
3.1 Current legislationMajor events in relation to South Australian legislation and drink driving enforcement aresummarised in Table 3.1. RBT was introduced in South Australia in June 1981.
In June 2003, South Australian Parliament passed a Bill legislating the use of mobile testingduring ‘prescribed periods’ and in September 2003, actual mobile RBT testing commenced.The ‘prescribed periods’ included long weekends, school holidays and four other periodsduring the year that did not exceed 48 hours. The additional 48-hour periods weredetermined by the Minister for Police and had to be advertised to the public at least twodays prior to the commencement of each period. The intention of this amendment was towiden the powers of police to require drivers to submit to a breath test during holidayperiods when there was increased traffic and a potential increase in the risk of crashes.South Australia was the only Australian jurisdiction to restrict mobile testing to ‘prescribedperiods’.
Legislation passed through State Parliament in June 2005 enabling mobile random breathtesting to be conducted on a full-time basis rather than only during prescribed periods.
Table 3.1Timeline of major events influencing drink driving enforcement
Year Selected Drink Driving Legislation1981 RBT introduced in South Australia1985 Blood alcohol content level for holders of learner and probationary
licences set at zero1991 Legal limit for blood alcohol content of all full licence holders changed
from 0.08 to 0.051997 Levels of RBT testing increased significantly (doubled) in South
Australia2001 Alcohol ignition interlock program introduced in South Australia (July)2003 Mobile random breath testing was introduced on a limited basis
(prescribed periods only) in South Australia (September)2005 Unrestricted mobile RBT commenced in South Australia (June)2005 Immediate loss of licence for blood alcohol content of 0.08 and over
(December)

12 CASR Road Safety Research Report | Best practice review of drink driving enforcement in South Australia
A comparison was made with legislation that existed in association with drink drivingenforcement in other states. The following is a summary of the main findings of the review.A more detailed table documenting where legislation in other states and territories differsfrom South Australian legislation is included in Appendix A. The various Legislative Acts thatwere examined included:
South Australia Road Traffic Act 1961
Northern Territory Traffic Act 1996
Queensland Transport Operations (Road Use Management) Act 1995
Australian Capital Territory Road Transport (Alcohol and Drugs) Act 1977
Western Australia Road Traffic Act 1974
Tasmania Road Safety (Alcohol and Drugs) Act 1970
New South Wales Road Transport (Safety and Traffic Management) Act 1999
Victoria Road Safety Act 1986
Most States and Territories had similar offence categories defined by Blood AlcoholConcentration (BAC). Nationally, 0.05 is the prescribed percentage of alcohol at whichoffences commence.
The categories for drink driving offences in South Australia, Northern Territory, AustralianCapital Territory and New South Wales are as follows:
• Category 1 0.05 – 0.08
• Category 2 0.08 – 0.15
• Category 3 > 0.15
Queensland has two categories: A general limit (0.05) and a high limit (0.15) as doesWestern Australia (0.05 and 0.08).
Other variations of note included:
• No consumption of liquor is allowed by a driver or passengers while a car is inmotion (Tasmania).
• It is an offence for drivers who are unlicensed, on a learners permit or under 18years of age to have a blood alcohol level of 0.02% (Western Australia); all otherstates are zero.
• A compulsory blood test is required if a person over 15 years of age is involved in amotor vehicle accident and attends hospital for treatment (and includes those whoare deceased) Victoria, Australian Capital Territory, New South Wales, NorthernTerritory and South Australia (14 years of age). Queensland, Western Australia andTasmania did not have this provision.
• Police officers can take charge and remove (Australian Capital Territory and NewSouth Wales) or impound (Tasmania) a vehicle. In South Australia, the police officercan direct the driver to leave or not enter a vehicle and can impound the keys.
• Immediate licence disqualification or suspension is available in all but WesternAustralia and Tasmania.
Fine, disqualification and imprisonment varied amongst the jurisdictions but with theexception of Western Australia and Victoria were loosely based on the same category and

CASR Road Safety Research Report | Best practice review of drink driving enforcement in South Australia 13
first, second or subsequent offence provisions (see Appendix B). Western Australia andVictoria were markedly different in this regard and incremented punishment correspondingto 0.01 increases in the prescribed concentration of alcohol from 0.05. Western Australia isthe only state that has provision for permanent licence disqualification under certaincircumstances.
Legislation regarding driving with a prescribed concentration of drugs was integrated intothe same legislation for South Australia, Victoria, New South Wales and Tasmania. Victoriaand SA are currently active in the mass drug testing of motorists and both require that abreath test for alcohol is first performed on the motorist prior to the drug test.
South Australia and Victoria are the only States that have very detailed requirements for theconduct of driver testing stations (i.e. Random Breath Testing). Most other jurisdictionshave provision for a police officer to ask a driver to stop a vehicle and perform a breath test.This is only possible in the Northern Territory and the Australian Capital Territory if there arereasonable grounds for suspicion that the driver had been drinking. In practice, this meantthat mobile RBT was available in most other jurisdictions. The introduction in June 2005 ofnew legislation in South Australia permitting mobile RBT at all times means that SAPOL cannow engage in similar drink driving enforcement practices to those used in otherjurisdictions.
Overall, South Australia compares favourably with the provisions of drink driving relatedlegislation in the other jurisdictions.
3.2 DataThe data in this section was obtained from Traffic Intelligence, SAPOL as part of the regularAnnual Performance Indicators of Enforced Behaviours report produced by CASR (refer toBaldock et. al., 2007). At the time of writing, only complete data to the end of 2004 wereavailable.
3.2.1 South Australia
Levels of RBT testing
The following data represent a combination of both static and mobile testing to give acomplete picture of the operation of RBT in South Australia. Table 3.2 summarises thechanges in the number of random breath tests conducted from 2000 to 2004 formetropolitan and rural areas. Rural testing refers to testing conducted outside the Adelaidemetropolitan area and includes regional cities such as Mount Gambier and Port Augusta.
The total number of tests (653,333) performed in 2004 exceeded the target of 600,000. Thislevel of testing was seven per cent higher than the level in 2003 but marginally lower thanthe record number of tests conducted in 2002. The increase in testing in 2004 was similar inmetropolitan and rural regions. This increase is most likely due to mobile RBT operating forprescribed periods in the full 12 months of 2004, whilst, in 2003, mobile RBT only operatedfrom September. As an indication, 13,191 (2.2%) and 46,030 (7.0%) of the tests areattributed to mobile RBT in 2003 and 2004 respectively.

14 CASR Road Safety Research Report | Best practice review of drink driving enforcement in South Australia
Table 3.2Number of random breath tests in South Australia, 2000-2004
Year Metro Rural Total % differencefrom previous
year2000 326,168 208,405 534,573 -4.92001 290,853 250,282 541,115 1.22002 387,867 294,664 682,531 26.12003 334,338 274,331 608,649 -10.82004 364,856 288,477 653,333 7.3
Table 3.3 shows the day of week data for 2004 split into its static and mobile RBTcomponents. The greatest percentage of tests was conducted on Fridays and weekendswith fewer tests conducted on Tuesdays and Wednesdays. The day of week of testing bythe two methods was similar except that mobile RBT was over-represented on Saturdays.This could have been the result of ‘prescribed periods’ for mobile RBT being more likely toinclude weekends.
Table 3.3Random breath tests performed by day of week in 2004 (expressed as a percentage of total tests each
year) for static and mobile RBT
Testing type Mon Tue Wed Thu Fri Sat SunStatic 12.7 7.6 7.6 14.9 21.3 17.8 18.1Mobile 11.9 6.1 5.8 9.6 20.2 26.7 19.6Total 12.6 7.5 7.5 14.6 21.2 18.4 18.2
Table 3.4 shows the time of day data for 2004, separately for static and mobile RBT. Testingwas conducted most commonly between 2pm and midnight. Mobile RBT was over-represented during the hours from midnight to 4am, while a considerable amount of staticRBT was performed during daylight hours.
Table 3.4Random breath tests performed by time of day in 2004 (expressed as a percentage of total tests in the
year) for static and mobile RBT
Type 12-2 AM 2-4 AM 4-6 AM 6 AM-2 PM 2-4 PM 4-6 PM 6-8 PM 8-10 PM 10-12 PMStatic 3.7 2.2 2.0 20.7 12.3 12.3 12.3 21.8 12.8Mobile 10.4 3.4 1.5 18.4 8.1 8.8 14.7 19.9 14.6Total 4.2 2.3 1.9 20.6 12.0 12.0 12.5 21.7 12.9
Drink driving detections
The number of drink driving detections for the years 2000 to 2004 is presented in Table 3.5.The number of drink driving detections has risen each year since 2000, with 6,058detections in 2004 being the highest number recorded during this period. Note that thisrefers to drink driving detections by all methods, including detections subsequent to crashinvolvement and traffic offences. The number of drink drivers detected using RBT was3,503, with 2,364 of these detected in the metropolitan region and 1,139 detected in ruralregions.

CASR Road Safety Research Report | Best practice review of drink driving enforcement in South Australia 15
Table 3.5Drink driving detections in South Australia 2000-2004
Year Drink DrivingDetections
Per cent change fromprevious year
2000 4,037 N/A2001 4,787 18.62002 5,074 6.02003 5,802 14.32004 6,058 4.4
RBT detection rates
The detection rates in the following section refer to detection by RBT only. There is nosingle sufficient measure of the effectiveness of RBT operations but RBT detection ratesprovide some estimate of RBT effectiveness. A lower detection rate may indicate greatereffectiveness of RBT and other drink driving countermeasures, although it is very importantto note that detection rates are also affected by operational factors such as the locations,times, and types of RBT used.
The RBT detection rates for the metropolitan and rural areas for the years 2000 to 2004 areshown in Table 3.6 in terms of the number of drivers found to be over the legal limit perthousand tested. In this case, drivers are only included if they recorded an illegal BAC usingevidentiary testing. The RBT detection rate in 2004 was the highest since 2000 for bothmetropolitan and rural areas, and the overall detection rate. One of the reasons for thisincreased detection rate could have been the greater use of mobile RBT in 2004, which wasexpected to be a better means of detecting drink drivers, particularly those trying to avoidstatic RBT stations. Indeed, in 2004 the detection rate for mobile methods was greater thanthat for static testing (29 versus 5.7 drivers detected per thousand tested with an illegalBAC per thousand tested, respectively).
Table 3.6RBT detection rates, 2000-2004 (number of drivers detected with an
Illegal BAC per thousand tested)
Year Metro Rural Total2000 3.2 2.1 2.82001 5.4 1.8 3.72002 4.0 1.9 3.12003 5.8 2.9 4.52004 6.5 3.9 5.4
Detection rates by day of week for static and mobile RBT are provided in Table 3.7. Notethat detections here are for drivers testing positive on the screening test rather than on theevidentiary test. The detection rates on screening tests are higher than on the evidentiarytests. In general, detection rates were higher later in the week for both types of testing,consistent with data from previous years.
Table 3.7RBT detection rates (screening tests only) in 2004 (number of drivers detected per 1,000 tested) for
static and mobile testing, by day of week and location
Testing Mon Tue Wed Thu Fri Sat SunStatic 2.4 4.0 5.4 6.2 6.3 6.3 7.1Mobile 19.4 22.3 28.4 35.9 27.6 33.2 29.5Total 3.5 5.0 6.6 7.6 7.7 9.1 8.8

16 CASR Road Safety Research Report | Best practice review of drink driving enforcement in South Australia
Detection rates by time of day for mobile and static RBT were calculated and are shown inTable 3.8. Note that these detection rates are also for drivers detected with illegal BACs inthe initial screening test. Similar to previous years, the highest detection rates in 2004 werebetween 10pm and 6am for both methods. Mobile RBT detection rates were substantiallyhigher than detection rates resulting from static RBT.
Table 3.8RBT detection rates (screening test only) by time of day in 2004 (number of drivers detected with an
Illegal BAC per thousand tested) by location and RBT method
Method 12-2 AM 2-4 AM 4-6 AM 6 AM-2 PM 2-4 PM 4-6 PM 6-8 PM 8-10 PM 10-12 PMStatic 11.88 27.82 12.52 1.98 2.35 2.85 4.40 5.39 12.76Mobile 57.87 92.86 87.90 9.30 13.67 17.26 26.02 23.31 38.51Total 19.96 34.78 16.65 2.61 2.89 3.59 6.19 6.55 14.82
3.2.2 Interstate comparisons
Levels of RBT testing
A comparison of South Australian data was compared with six other Australian jurisdictionsas shown in Table 3.9. Total numbers (where possible) are expressed in terms of therelative contributions of mobile and static testing methods. South Australia had the lowestproportion of all mobile RBT that was conducted, most likely due to the requirement thatsuch testing could only be conducted during ‘prescribed periods’ during 2004.
Table 3.9Number of random breath tests conducted in seven Australian jurisdictions in 2004, by testing method
Jurisdiction Static Mobile Total % MobileSouth Australia 607,303 46,030 653,333 7.0New South Wales 2,406,442a 658,610 3,065,052 21.5Northern Territory UK UK 5,476 UKQueensland 1,964,291 b 814,908 2,779,199 29.3Tasmania 99,883 365,526 465,409 78.5Victoria 2,393,830c 1,264,364 3,658,194 34.6Western Australia UK UK 850,562d UK
a Total includes 200,507 tests conducted from RBT ‘bus units’b Total includes 250,179 tests conducted using RBT ‘booze bus units’c Total includes 1,463,047 tests conducted from RBT ‘booze buses’d Total includes 349,833 tests conducted from RBT ‘booze bus units’NB: UK = unknown
A more appropriate measure of RBT testing levels in different jurisdictions can be gained byadjusting RBT numbers for the number of drivers in each jurisdiction. However, due todifficulties associated with differences in licensing conditions across jurisdictions, it wasdecided that a simpler measure would be breath tests per head of population. As shown inTable 3.10, South Australia’s level of RBT was comparable with that in Western Australiaand New South Wales but considerably less than that in Tasmania, Victoria and Queensland.

CASR Road Safety Research Report | Best practice review of drink driving enforcement in South Australia 17
Table 3.10Number of random breath tests conducted in seven Australian jurisdictions in 2004, as a percentage of
population
Jurisdiction Total Pop 2004* % of PopSouth Australia 653,333 1,532,727 42.6New South Wales 3,065,052 6,720,791 45.6Northern Territory 5,476 199,384 2.7Queensland 2,779,199 3,888,077 71.5Tasmania 465,409 482,236 96.5Victoria 3,658,194 4,962,970 73.7Western Australia 850,562 1,978,079 43.0* Source: June, 2004 data from Australian Bureau of Statistics (2005) Population byAge and Sex: Australian States and Territories. Catalogue No 3201.0
RBT detections
Data concerned with drink driving detections by all methods were also obtained from anumber of other Australian jurisdictions as shown in Table 3.11. When population is takeninto account, Tasmania had the highest detection rate and South Australia and New SouthWales the lowest.
Table 3.11Drink driving detections, by all methods, in 2004 in six Australian jurisdictions
Jurisdiction Drink Driving Detections % of Population
South Australia 6,058 0.40New South Wales 26,265 0.39Queensland 27,738 0.71Tasmania 3,979 0.83Victoria 27,546* 0.56Western Australia 11,968* 0.61
* Does not include detections following a crash, RBT detections only
Note that the best indicator of levels of drink driving in the community, and thus of theeffectiveness of RBT as a deterrent, is a roadside survey independent of enforcementactivity. Unfortunately, no such surveys have been conducted in South Australia since 1997.
3.2.3 Summary of drink driving enforcement in South Australia
At the time of writing, only complete drink driving enforcement data to the end of 2004were available. Overall, in 2004 the total number of detections in South Australia was thehighest for all years since the year 2000. However, South Australia had one of the lowestrates of testing per head of population (43%), the lowest proportion of tests conductedusing mobile methods (7%), and the second lowest drink driving detection rate (0.40% ofthe population) of the six jurisdictions for which data were available. The extent to which theremoval of “prescribed periods” on mobile RBT in South Australia has addressed thissituation is unknown. To be on par with other jurisdictions in Australia, South Australiawould need to increase its level of testing and increase the proportion of tests conductedusing mobile RBT.
18 CASR Road Safety Research Report | Best practice review of drink driving enforcement in South Australia
3.3 Police drink driving enforcement practices in South Australia (basedon interviews with SAPOL)This section describes the current range of drink driving enforcement activities undertakenby police in South Australia (SAPOL), and any issues related to these activities that mightinfluence its effectiveness. This information was collected to understand the currentsituation with respect to drink driving enforcement policies, operations, resources andstrategies in South Australia. Information was gathered from interviews with six policerepresenting Corporate Operations, Operations Support at the Service Level and two LocalService Areas (LSAs) in rural and metropolitan areas. All comments reflect the situation asdiscussed during November 2006.
3.3.1 Structure of SAPOL
Harrison (2001) notes that police enforcement in most Australian states is stronglyregionalised. The coordination of RBT activities was decentralised in South Australia in theyear 2000. Drink drive enforcement is the responsibility of 14 LSAs in South Australia ofwhich six are located in the Adelaide metropolitan area and eight are in rural regions. Acommander in each LSA has the responsibility of ensuring drink driving enforcement targetsare met autonomously. Corporate support is provided by the Traffic Support Branch mainlyin the form of data collation and distribution.
Each LSA is part of either the Northern or Southern Operations Section. Within each ofthese, a section is dedicated to traffic enforcement: the Northern or Southern TrafficEnforcement Section (TES). These Sections operate at the Service Level and have their ownRBT targets, equipment, budgets and strategic planning. They can travel anywhere in thestate and consist of motorcycles, marked and unmarked vehicles. Each section also has avan that can be specifically set up for RBT operations. A request can be made by LSAs tothe appropriate TES to support local enforcement activity. Typically this incorporates majorevents such as harvest time in rural areas or local festivals.
One of the advantages of the current model of decentralisation is that LSAs must takeownership of their local drink driving enforcement and are accountable for reaching theirtargets. Further details regarding LSA accountability for achieving drink driving enforcementtargets are discussed in Section 3.3.2. In most cases, people within the LSA are betterplaced to know where and when to conduct drink driving enforcement activities in their ownarea of operation. Cooperation between LSAs is thought to be rare and largely influencedby geography and a need to satisfy LSA assigned targets with limited resources.
Throughout any given year, the LSAs (and each TES) must support a number of CorporateOperations. These operations include enforcement activities (including drink driving,speeding, restraint use, heavy vehicles, fatigue) scheduled for various periods during theyear. For example, drink driving might be the targeted behaviour during November. Theroad safety enforcement calendars are produced in conjunction with the Motor AccidentCommission and the Government of South Australia. Each LSA must then set a roster sothat these enforcement activities can be performed.
A Driver Drug Testing Group was centrally formed within the Traffic Support Branch to pilotthe implementation of roadside driver drug testing and commenced 1 July 2006. A trafficpolicing restructure was implemented in October 2006; this realigned and deployed policetraffic resources in accordance with identified operational needs, revised populationdemographics and to complement the SAPOL Road Safety Strategy 2006-2010. This newstructure has not been operating long enough for SAPOL to comment on its effectiveness.There is provision, however, for Traffic Support Branch personnel to volunteer for RBTovertime activities.
With respect to the regionalisation of enforcement activities, concerns were raised in theliterature (Harrison et al. 2003) that general duties police may not be trained adequately or

CASR Road Safety Research Report | Best practice review of drink driving enforcement in South Australia 19
understand the importance of drink driving enforcement. SAPOL did not believe this was aconcern as all new recruits to the police force from the Academy receive practical RBTtraining. This training covers all aspects of RBT operations from occupational health andsafety to equipment use. The Traffic Training and Promotion Section also conduct regularRBT training both at the Traffic Support Branch and by visiting the LSAs.
While many LSAs have to rely on general duties police to provide traffic enforcement, somehave specially assigned police dedicated to traffic enforcement (e.g. highway patrol in theSouth East). It was pointed out that there are some attractions to traffic policing as there isminimal supervision, travel is a major part of the job, there are opportunities to earn extramoney through overtime and the image of traffic police is improving. As SAPOL is such alarge organisation, motivation and belief in the efficacy of traffic enforcement varies,however anecdotally the culture and profile of traffic policing was thought to be improvingthroughout the organisation.
3.3.2 Enforcement operations
Current drink driving enforcement operations in South Australia are examined in terms oftarget and actual enforcement levels, equipment and resources available, location and timesof enforcement, types of enforcement used, and any issues that influence enforcementoperations.
Targets and enforcement levels
A corporate testing target of 600,000 breath tests per year in South Australia was adoptedfrom 1999 to 2005. In 2006, this testing target was increased to 612,000 tests. The targetnumber of tests was set to primarily accomplish a testing ratio of one out of every twolicensed drivers in South Australia per year. If this target is achieved, external FederalGovernment funding is obtained and made available to the LSAs for overtime payments forRBT activities (note that overtime refers to payments for work outside of a scheduled eight-hour shift). This funding provides LSAs with more resources to manage RBT activities andprovides some incentive for officers to undertake additional RBT activities.
In addition to testing levels, corporate targets are also set for detection rates. In 2006, abenchmark detection rate was set at 0.5% of drivers tested by static RBT and 3.2% ofdrivers tested by mobile RBT.
The overall target testing and detection levels for South Australia are divided into tailoredtargets for each LSA based on several variables (e.g., population, number of police etc.).Since 2006, the targets are left to the discretion of the Assistant Commissioners andreviewed quarterly.
Some states in Australia have specific testing targets for each individual police officer. Forexample, in Victoria, each officer is expected to complete 30 minutes of RBT every shift.There are no targets set on an individual level in South Australia, although individual LSA’smay have certain expectations. For example, highway patrols in the South East are expectedto perform one hour of drink driving enforcement every shift (approximately 1000 tests perweek). However, this often does not occur because officers are called out to other duties.
LSA accountability
There are several ways that the LSAs are held accountable for achieving targets:
• Regular reporting to their Assistant Commissioners
• Regular meetings within the hierarchy
• Monthly meetings between the Northern and Southern Operations Sections and theLSAs within their section
20 CASR Road Safety Research Report | Best practice review of drink driving enforcement in South Australia
• Annual LSA forum to review performance (attendees include AssistantCommissioners and two or three LSAs from similar area)
• A Northern and Southern Operations traffic forum is held annually for all trafficmanagers.
• The distribution of a progress report that reveals how the LSAs are tracking inrelation to their targets and other LSAs
Note that these meetings are not specific to drink driving enforcement and cover a numberof enforcement issues. Therefore, there is plenty of opportunity for interaction betweenLSAs.
An internal monthly RBT progress report is distributed to all LSAs indicating their progressfor the year to date including number of tests conducted, detection rates, and general RBTinformation. This report forms a transparent process that has lead to rivalry between LSAsto ‘outperform’ each other.
Equipment and resources
Most general patrol and traffic vehicles are equipped with a preliminary breath testingdevice (1026 available in South Australia in November 2006). Drivers who register a bloodalcohol level over the prescribed limit on the screening test are required to submit to afurther test on more accurate apparatus to determine an ‘evidentiary’ BAC level to be usedin prosecution. This must be completed within two hours of the last known time of driving.An issue raised was that a positive detection would mean that an officer would be tied upfor some considerable time (in the order of two hours) processing the motorist. Thereforewith smaller operations, multiple positive detections could force the operation to temporarilyshut down.
At static RBT sites in South Australia, evidentiary testing is either conducted in special vans(a smaller version of the traditional booze buses) or at a suitably equipped police station.Drivers testing over the legal limit with mobile RBT are usually driven to the nearest policestation or static RBT site. All evidentiary equipment is portable and can be used in (pluggedinto a cigarette lighter) or out of a vehicle. Those found to be over the prescribed limit in theevidentiary test are officially recorded as having exceeded the prescribed concentration ofalcohol (PCA). There were 99 evidentiary breath testing instruments available for use inSouth Australia in November 2006.
Preliminary breath testers are calibrated every six months and evidentiary equipment isserviced every six months and calibrated once per year.
The number of preliminary and evidentiary breath testing devices available to police inNovember 2006 by LSA in South Australia is shown in Table 3.12. Some LSA’s haveindicated that they need more evidentiary equipment.
In regional locations, cooperative policy models are used whereby police stations sharebreath testing resources. However, police commented that in more remote rural areas,distance and resources (i.e., number of staff) make co-operative operations between LSAsdifficult.

CASR Road Safety Research Report | Best practice review of drink driving enforcement in South Australia 21
Table 3.12Distribution of breath testing equipment by LSA, November 2006
LSA* Population a SquareKilometres a
Number ofAlco-testers
Number ofEvidentiary
TestersMetropolitan Adelaide 141,992 155 82 5 Elizabeth 217,051 1,767 77 5 Holden Hill 187,133 495 66 5 Port Adelaide 157,985 122 51 4 South Coast 143,514 6,592 60 6 Sturt 307,802 342 70 4Rural Barossa Yorke 67,208 15,699 55 12 Far North 27,771 669,967 63 10 Hills Murray 81,071 17,202 63 6 Mid West 26,178 25,267 51 4 North East 34,566 60,337 61 7 Riverland 38,784 32,109 47 8 South East 63,040 21,328 73 8 West Coast 30,155 133,942 45 5Other - - 162 10Total 1026 99* LSAs in the Northern Command Region shown in bold; others are in the Southern Command Regiona Data source: Calculated from ABS Regional Population Growth 2003-04 Australia and New Zealand,Cat No. 3218.0-25, March 2005. Estimated resident population by LGA as at 30/6/2004.
Locations and times
Decisions about the timing and location of enforcement activities in South Australia aremade at the local level. Individual LSAs use their own local intelligence and experience toselect static RBT sites because it is felt that they know where the high volume, highdetection and high alcohol-related crash locations are. Basic crash statistics and otherrelated information is available from central Traffic Intelligence on an internal system. LSA’scan also request detailed information including statistics and maps. LSA’s report that thiscorporate level support is useful and responses to such queries are usually very prompt (i.e.,same day of request).
South Australia was one of three Australian states commended by Harrison et al. (2003) forhaving the best-developed data systems for selecting enforcement times and locations,with access to the data available at the local level. Nevertheless, SAPOL stated they wouldwelcome any additional means to achieve the right balance in enforcement times andlocations to discourage and reduce drink driving levels.
Types of enforcement
The two main types of RBT enforcement conducted in South Australia are stationary orstatic RBT and mobile RBT. Stationary RBT is conducted in a fixed area that is static for itsentire duration. Passing traffic at stationary RBT sites are pulled over but legislation requiresthat vehicles are moved through in a timely manner (see The Road Traffic Act 1961 Section47DA). As mentioned previously, evidentiary equipment may be provided in general purposevans at static RBT sites.

22 CASR Road Safety Research Report | Best practice review of drink driving enforcement in South Australia
The other main type of drink driving enforcement is mobile RBT. Since June 2005, mobileRBT is no longer restricted to ‘prescribed periods’ in South Australia. Police can now stopany driver at any location at any time and request a breath test. Moreover, as there is nolegislation imposing time restraints once a driver is pulled over, police may conduct otherchecks on the driver (i.e., licence, registration) and vehicle. If a breath test is positive, thedriver is taken to the closest evidentiary equipment (i.e., police station or specialist van).
There is consensus among SAPOL that mobile RBT is the most effective means ofdetecting drink drivers. However, police expressed concern that competing policingpriorities (i.e. crime) in LSAs often take police personnel away from mobile RBT operations.The majority of RBT testing is conducted using the static method. Static testing is highlyvisible and used mainly for general deterrence, but is often used in combination with mobilepatrol cars. Police from rural LSA’s commented that fewer detections are achieved withstatic RBT, often because drivers are familiar with static sites or find out quickly where theyare located by word of mouth. For these reasons, police often need to move rural RBT sitesevery hour.
Large targeted enforcement operations in which specific problem areas are saturated for ashort period of time are also conducted intermittently in South Australia as part of the overallenforcement strategy. An example of this strategy is the cordoning of the Adelaide citycentre; RBT is conducted on all roads surrounding the city. Metropolitan and rural LSA’sreport a strategy of targeting licensed venues, particularly late night establishmentsfrequented by people aged 18 to 40 years. Police report a good rapport with suchestablishments and no mention was made of resistance to police enforcement activity.
The proportion of covert and overt, random and targeted (i.e. around hotels, city centre), andstationary and mobile RBT operations is at the discretion of the individual LSA. In practice, acombination of all four approaches is required in order to meet testing and detection targets.
Occupational health and safety issues
SAPOL occupational health and safety policies were developed to ensure measures areundertaken during RBT operations to make conditions safe for police. Such measuresinclude reducing speeds in high-speed zones, using traffic cones around testing areas andwearing highly visible safety vests. A risk analysis is also conducted before RBT operationsand police are briefed prior to the operation.
Occupational health and safety policies can also place constraints on enforcementoperations, particularly static testing. For example, adverse weather conditions such as rainor extreme heat (above a threshold temperature) are deemed unsafe for police to conductstatic testing. Note that there are no maximum temperature constraints on using theequipment. Sometimes mobile RBT enforcement is employed in lieu of static RBT toovercome these issues. For example, if it is raining and too dangerous to pull traffic into astatic site, mobile RBT is used.
Occupational health and safety issues also influence the total number of hours police canwork. Police may work for a maximum period of 12 hours. Indeed, some RBT operations runfrom 6pm to 6am, which translates into an eight-hour shift with an extra four hours ofovertime. Alternatively, two separate shifts could cover such an RBT operation.
3.3.3 Strategic management and support
Data management (intelligence led enforcement)
Each LSA in South Australia collects data on local RBT activities. With respect to the numberof breath tests, collection techniques vary between LSAs. Some LSAs use a countingdevice while others simply count the number of discarded mouthpieces. No auditing of theactual number of breath tests conducted is undertaken. Police commented that thesesystems rely on honesty and are subject to inaccuracies.

CASR Road Safety Research Report | Best practice review of drink driving enforcement in South Australia 23
There is conflicting evidence as to whether electronic data from the breath testers can bedownloaded. Nevertheless, downloading is not performed at the LSA or corporate level atpresent. There are several advantages of data-logging preliminary breath tests. Downloadeddata may be useful in planning future targeted enforcement activities and would allowtesting rates and times to be more accurately recorded.
Data from RBT operations is entered by each LSA onto the central ‘Traffic Online’mainframe and includes details of the following:
• Time activity commenced• Time activity concluded• Number of operators• Number of breath tests performed• Number of positive tests (between 0.05 and 0.08; between 0.08 and 0.15; greater
than 0.15)• Method of RBT employed (i.e., static or mobile)
If any concerning trends are noticed in the data (e.g. a large number of high readings), theLSA will be informed by the Traffic Support Branch. However, in most cases the LSA isalready aware of such issues.
Police have indicated that data entry systems are time consuming and difficult to work with.Officers must enter drink driving enforcement information into four systems: offenderreports, journal, traffic online and the justice information system. Consequently, muchinformation is duplicated and the data entry becomes time consuming and monotonous.Once in the system, some report that it is also difficult to extract the data.
Allocation of resources
Typical RBT operations in LSA’s involve two or three officers at a stationary site and twoofficers in patrol cars (i.e. mobile). Police commented that having more than eight officers atstationary RBT sites could be problematic because a greater number of drivers are testedand, consequently, vehicles get banked up. If resources are split (i.e. two teams of four)then two locations or two different directions of travel can be targeted. RBT operations canalso be limited by the number of alco-testers available.
Drink driving enforcement is generally conducted during evening shifts up to 2am and oftenbeyond, depending on resources. The Northern and Southern Traffic Enforcement Sectionsoften assist other LSAs in conducted in late night/early morning RBT activities and havebudgets set aside for overnight accommodation in country areas (stay often lasts 2-3 days).
Some police commented that most drink driving detections occur after midnight and theyexpressed interest in conducting more RBT at this time. However, they acknowledged thatat night there are fewer personnel rostered on duty because it is the most expensive timeto staff and police are often called away from RBT operations to attend other policingissues. The traffic policing restructure in October 2006 resulted in realignment of trafficresources. A centrally based driver testing resource was formed in July 2006. Policecommented that because there was only a single dedicated unit, it could only assist in oneLSA at a time.
SAPOL stated that South Australia is leading other Australian states in some areas of RBToperations. For example, it was known that in another jurisdiction, police usually completeRBT activities around 2am while in South Australia officers often work overtime so testingcan conclude up to 6am, into the daylight hours.
24 CASR Road Safety Research Report | Best practice review of drink driving enforcement in South Australia
Community and media support
There are two main corporate RBT operations planned each year: Santa Safe consisting oftwo RBT components in December and January, and Operation Consequences consisting offour RBT components in August, September, December and February. A total of 12planned enforcement activities exist annually but the others do not have RBT components.
Public launches are held before these two drink driving enforcement operations commencebut the exact details about the time and locations of RBT activities are not given. SAPOLdoes not do any other advertising or promotions for RBT activities apart from these publiclaunches.
Individual LSA’s reported that they feel drink driving enforcement activities receive goodcommunity and media support. They report a good rapport with the local media who areinterested in reporting road safety issues. Unpaid media, particularly local radio andnewspapers, are frequently used by some LSAs to keep road safety issues in peoplesminds and to back up enforcement activities. Other LSAs report they do not actively seekthe media but are happy to provide details about RBT activities when approached.
Police also work with the community to deter drink drivers, rather than detect. For example,a community program and driver action group operate in one LSA. These programsencourage drinkers not to get in a car and drive and involve police presence in licensedvenues and around their car parks.
3.4 Drink driving publicity in South AustraliaAccompanying mass media publicity campaigns and public education are thought toincrease the deterrent value of enforcement activities (Homel, 1990). An interview was heldwith the Coordinator, Marketing & Communications of the Department for Transport Energyand Infrastructure (DTEI) to ascertain the role of publicity and public education in SouthAustralia in relation to drink driving. It should be noted that since the interview, responsibilityfor the coordination and creation of State Government road safety mass media has beenpassed onto the Motor Accident Commission (MAC). It is thought however, that the basicunderlying principles and situations reported in the following sections will not changesignificantly in the short term.
Funding
Most of the funding for mass media is provided from the Motor Accident Commission(MAC) and the current budget is $2 million. This has remained fixed for several years. Thereis a three-year road safety strategy in South Australia dictating the proportion of total fundsto be spent on each road safety issue. The current strategy specifies that around $400,000must be spent on drink driving publicity. MAC contributes 78 per cent of funding of which22 per cent ($440,000) must be matched by DTEI.
DTEI splits the budget so that approximately 30 per cent is spent on production and 70 percent on media (placement). The other major cost is evaluation. Other budget lines can beused to supplement small scale activities (e.g. 0.05 cups for Football park).
Campaigns
In recent years, there has been minimal mass media focus on RBT enforcement inadvertising. A campaign was run in 2005 to support the introduction of mobile RBT. Thiscampaign was radio based accompanied by posters with the message that motorists couldnow be caught anytime, anywhere by any police vehicle. There were no televisionadvertisements aired in relation to this campaign.

CASR Road Safety Research Report | Best practice review of drink driving enforcement in South Australia 25
Ambient advertising has been undertaken with the following elements:
• Targeted venues and events – Clipsal motor race, WOMAD, soccer, cricket etc
• Cups, stickers for toilets etc
• Different ways of getting to the younger drinkers
The target demographic have been 16-30 year olds with the emphasis on getting themessage to this group before they develop bad behaviours.
Traditionally, a new campaign has been produced each year for a given road safety topic butthis is no longer the case. Campaigns are now constantly refined over the longer term withthe aim of being consistent and achieving good reach over time. Advertisements are alsosourced from interstate if their content is considered suitable and effective for SouthAustralia. At the time of writing, the 2006/07 program was to incorporate a general anti-drink drive message.
Campaign development:
Campaign development is performed using focus groups composed of the target audience.In relation to drink driving, these have revealed that for 16 to 30 year olds:
• People feel that others are being caught just above the 0.05 level
• At this level, such people feel alright and cannot tell that they are drunk
• At this level, such people are not intentionally drink driving, unlike at higher BAClevels
• and as such they are unlucky for being caught
At present, DTEI do not run threat appeal advertisements on the likelihood of being caughtbecause focus groups indicate:
• the perception of the chance of being pulled over and tested, especially late at nightis low
• there is a belief that police resources are limited
• participants do not associate the advertising with observed high levels ofenforcement
Campaign tracking
Currently, two companies are used for campaign tracking: one performs the pre-campaignand the other post-campaign tracking. It has been suggested that the use of one companywould be more appropriate for consistency. The pre- and post-campaign tracking typicallyconsists of approximately 600 people. Longitudinal tracking is performed monthly andmonitors recall and consistency over time. Self reported behaviours are also tracked anddrink driving detections are examined.
Coordination with police enforcement
Mass media is used to support statewide SAPOL campaigns. DTEI also offers support withpress releases and provides publicity materials for LSAs such as posters for targetedvenues.
SAPOL conduct their own press releases and generally obtain good coverage in the media.Anecdotally, this seems to have a positive effect on road safety initiatives; tracking hasshown that drink driving awareness hit a peak during a restraint use campaign. This

26 CASR Road Safety Research Report | Best practice review of drink driving enforcement in South Australia
supports the theory that specific road safety messages have an impact across several roadsafety areas.
There is much scope to improve operational coordination between mass media andenforcement activity and this has been lacking in the past. It is known, however, thatattempts are underway to resolve this issue.
Issues/concerns
Several issues and concerns were raised in relation to resources available for thedevelopment of mass media campaigns. Current funding does not allow for meaningfuldevelopment and tracking with only five focus groups with six to seven participants to beconducted annually. There is a desire to conduct more and larger focus groups to makefindings more robust. Longitudinal tracking sample sizes could also be increased. In orderto achieve current sample sizes, questions are often omitted to shorten the interviewprocess. There is also a desire to conduct more testing of concepts once an advertisementhas been produced. At present, only storyboards are tested.
CASR Road Safety Research Report | Best practice review of drink driving enforcement in South Australia 27
4 DiscussionAn overall snapshot of drink driving enforcement operations in South Australia has beenobtained. This indicates reasonable activity by LSAs operating autonomously to meettargets set by a corporate command. The arguments for this structure are that LSAs haveownership of drink driving enforcement (i.e. it becomes their problem) and they alsobecome more accountable in terms of reaching performance targets. These targets consistof the number of overall tests performed and the proportion of detections.
Previous research has voiced concern that regionalised operations are not under as muchscrutiny as if there were close central control. Evidence suggests that the performancetargets are effective in engaging LSAs to undertake drink driving enforcement. The qualityand composition of this enforcement is another issue for debate but there appears to be norigid guidelines for success in the literature. The high number of tests required is conduciveto so-called “dumb testing”. This involves the establishment of static RBT on high volumeroads to achieve the targets or make up backlogs. By nature, such activity is of high profileand highly visible and not inconsistent with recommended approaches. The specification ofdetection rates in addition to number of overall tests should be adhered to as it impliessome degree of quality in the testing.
Other researchers (Harrison et al, 2003) suggest that targets for enforcement activitiesshould be time-based (number of person hours) and should also use alcohol related crashoutcomes. While alcohol related crash outcomes should be monitored, they can be difficultto interpret especially in the context of individual interventions. The use of fatal injurycrashes as an indicator, for example, should be abandoned in favour of casualty crashes.
In terms of legislation, South Australia has provisions comparable to those of otherjurisdictions. The introduction of mobile RBT in the State has clearly been considered as aneffective method for drink driving enforcement. Since the latter half of 2005, SAPOLactivities can be compared with those of other States in this regard. In general, it appearsthat mobile RBT has also been used to overcome previous limitations, such as the inabilityto establish static RBT sites in heavy rain.
Structure and resources
It is not within the scope of this report to suggest an organisational structure for SAPOL oradvise the way in which the organisation should be run. However, this clearly has asignificant influence on the way in which drink driving enforcement is approached in theState. The organisational structure must also be viewed in context and it was not that longago that certain elements of traffic policing were to be disbanded permanently.
The reliance on the autonomy of LSAs has many positive and negative aspects, however, inthe context of this report, most are seen as positive. An issue that cannot be meaningfullyaddressed is if the LSAs are properly resourced to conduct adequate levels of drink drivingenforcement. A comparison with other states suggests that South Australia is laggingbehind the best performing states in terms of the number of overall tests and detectionsperformed. The lack of mobile RBT in recent years may be a significant contributor to thissituation. Data from late 2005 and 2006 will be needed to see if this situation has changed.This would likely have much improved detection rates but only a modest increase in thenumber of overall tests. A further review of the equipment possessed by police forces inother states would also assist in the interpretation of the circumstances.
The maintenance of the two TES is also seen as beneficial and maintains a necessary higherprofile focus on traffic enforcement. However their individual impact is difficult to assessand the extent to which they can bolster LSA activity over the whole state given currentresources must be limited.
28 CASR Road Safety Research Report | Best practice review of drink driving enforcement in South Australia
The assignment of dedicated traffic police to the LSAs is also seen as a positive influenceprovided that there are adequate resources to permit these people to remain focused ontraffic enforcement duties.
The current drink drive enforcement model relies heavily on the resources allocated to theindividual LSAs and Northern and Southern TES. What is not considered by this review arethe resources available to SAPOL when compared to the Police organisations in otherstates. While alco-testers appear to be well distributed, the number of personnel and hoursdedicated to drink drive enforcement activity has yet to be compared to practices interstate.The effectiveness of the current de-centralised structure relies heavily on the properresourcing of the LSAs to be able to focus on drink drive enforcement activities withoutdistraction. The same applies to the Northern and Southern Traffic Enforcement Sections(TES) who have to service the entire state and provide support to LSAs upon request.
Knowledge of RBT operations appears to be well served by training provided to freshgraduates at the Academy and also by the Traffic Support Branch on an ongoing basis. Thenumber of alco-testers appears to be sufficient but some LSA’s indicated they need moreevidentiary equipment, particularly in remote rural areas where it is difficult to test drivers onevidentiary equipment within the two hour timeframe.
Intelligence led enforcement / strategic data management
The Traffic Support Branch provides timely information to LSAs, however the task ofrecording and retrieving data appears to be anything but streamlined. The difficulty ofentering sometimes duplicate data into the various computer systems was highlighted onmore than one occasion.
Currently, the number of breath tests in South Australia is recorded by LSAs who eithercount discarded mouthpieces or use a counting device. There appears to be confusion as towhether electronic data from breath testers can be downloaded. Many jurisdictions inAustralia either have, or are moving towards the data logging of preliminary breath tests.There would be significant benefits if data were to be recorded from alco-testers in the fieldand downloaded. SAPOL could increase its intelligence in relation to how much drink driveenforcement was being conducted and the times at which this was occurring. Suchinformation would be invaluable to the planning of future enforcement activities. However,this would require some administration and cultural issues to be overcome.
When deploying RBT resources, it appears that best practice involves assimilatinginformation from traffic intelligence systems with local knowledge while being sensitive tolocal conditions. LSAs use their own intelligence and experience to select RBT times andlocations and have access to relevant data at the local level.
RBT operations
The literature indicated that the optimal strategy for RBT operations is using highly visiblemethods in the early part of the evening (i.e. 6 to 10pm) so that potential drink drivers seedrink driving enforcement on their way to drinking venues. This may deter drink driving byinfluencing subsequent alcohol consumption or the decision to drive. To detect actual drinkdrivers, RBT is also needed later in the evening (after midnight) at times when the highestdrink drive rates occur. The precise proportion of each enforcement method needed tomaintain an optimal balance is unknown.
South Australian drink driving enforcement activities in 2004 contained highly visible staticRBT prevalent during daylight hours and also from 8pm to 10pm. Mobile RBT (duringprescribed periods) was primarily conducted from 6pm until 2am but was over-representedfrom midnight to 4am. Mobile detection rates were highest from midnight until 6am.Detection rates for both methods were highest on weekends when drink driving is knownto be most prevalent.

CASR Road Safety Research Report | Best practice review of drink driving enforcement in South Australia 29
Homel’s Deterrence Model supports highly visible RBT, as this is important in increasing theperceived risk of detection. Decision making models suggest a greater emphasis should beplaced on detection because exposure to apprehension and punishment may reduce thelikelihood that drink driving behaviour is considered appropriate when making the decisionwhether to drive after consuming alcohol (Harrison, 2001). Thus, highly visible, static RBTshould be complimented by covert mobile operations.
In South Australia, the majority of RBT is conducted using the static method (93% in 2004).Static testing is highly visible and used mainly for general deterrence, but is often used incombination with mobile patrol cars to apprehend drivers using back streets to avoid RBTsites. For specific deterrence, it is important to apprehend a large proportion of drink drivers.Data in this report indicate that detection rates were highest in Australian states wherethere were higher levels of testing and a higher proportion of tests conducted using mobiletesting methods. Note that no evaluations of mobile RBT were available in the literature.
To be on par with other jurisdictions in Australia, South Australia could justifiably increase itslevel of RBT and increase the proportion of tests conducted using mobile RBT. Data from2005 and 2006 would need to be evaluated to know what increase would be reasonable.
Rural enforcement issues
Static RBT based primarily on deterrence is unlikely to have a great effect on rural drivers.Therefore, detection of drink drivers would be the most useful strategy in such communitiesand is best achieved through unpredictable, smaller, covert mobile operations. Covertmobile operations are valuable in that they provide a solution to the limited police personnelavailable in rural regions and the ‘grapevine effect’ known to undermine the value of a highlyvisible static RBT station. However, covert operations should complement overt testingmethods and all enforcement strategies should consider local factors.
Publicity / media campaigns
There has been very little mass media content focused on drink driving enforcement in thepast few years. Current feedback amongst a small sample of 16 to 30 year olds suggeststhat the perception of being caught if engaging in drink driving behaviour is small. Morerobust testing is needed to develop a coordinated mass media campaign that complimentspolice enforcement. The coordination of enforcement activity with mass media publicityshould be given a high priority.

30 CASR Road Safety Research Report | Best practice review of drink driving enforcement in South Australia
5 ConclusionsA snapshot of drink driving enforcement operations in South Australia was obtained viainterviews with personnel from varying levels of the SAPOL hierarchy. This indicatesreasonable activity by LSAs operating autonomously to meet targets set by a corporatecommand. The rationale of giving ownership of drink driving enforcement to the LSAsappears to be valid based on the interviews conducted. It is impossible to comment if allLSAs are taking their drink driving enforcement seriously however corporate policies are inplace to try to ensure that LSAs are held accountable for their performances.
The introduction of mobile RBT operations outside of prescribed periods in 2005 has clearlyenhanced the ability of the police to perform drink drive enforcement and bring SouthAustralia in line with national practices.
The mix of enforcement approaches is left to the discretion of the LSA commanders,however, the high number of tests required lends itself more towards testing for quantityrather than quality. This is not inconsistent with the general deterrence principle of RBT,however a degree of specific deterrence also needs to be delivered with detections. It isunderstood that proportion of detections by mobile and static RBT is also a performancemeasure and, if adhered to, should deliver some element of quality into the testing.
The review has found that the following items should be considered to further enhancedrink driving enforcement in South Australia:
• The combination of static RBT with mobile RBT is viewed as particularly effectiveand should be conducted whenever resources allow
• Mobile RBT is considered the most effective form of drink driving enforcement inrural areas
• Ensure that mobile RBT does not become the sole means of enforcement at theexpense of general deterrence (unlikely given current testing targets)
• National and international evidence suggests that static and mobile RBT, asconducted in Australia, continues to be the most effective method for drink drivingenforcement
• The literature suggests that time based allocations for drink driving enforcementshould also be specified; ideally alcohol related crash data should also be used butinterpretation can be difficult, particularly in terms of individual interventions
• To alter motorists behaviour for the rest of the evening and avoiding drink drivingepisodes altogether, RBT should continue to operate earlier in the evening (e.g. 6pmto 10pm) and preferably near drinking establishments
• RBT operations are also required later in the evening (eg midnight to 2am) whenmost drink driving occurs for general and specific deterrence
• There is scope to improve data collection and reporting systems
• It is essential that mass media campaigns are coordinated with enforcementactivities
• On a per capita basis, there is scope for South Australia to increase its testing anddetections to be more in line with national practices
It should be noted that these conclusions are made based on data available to 2004 whenmobile RBT had been introduced for prescribed periods only. Further analysis of datafollowing the lifting of restrictions on mobile RBT operations from late 2005 and 2006 wouldbe necessary to ensure that the current situation was properly interpreted. This would likely

CASR Road Safety Research Report | Best practice review of drink driving enforcement in South Australia 31
result in much improved detection rates but only a modest increase in the number of overalltests.
What is not considered by this review are the resources available to SAPOL when comparedto the Police organisations in other states due to the difficulty in obtaining this type ofinformation. While alco-testers appear to be well distributed, the number of personnel andhours dedicated to drink drive enforcement activity has yet to be compared to practicesinterstate. The effectiveness of the current de-centralised structure relies heavily on theproper resourcing of the LSAs to be able to focus on drink drive enforcement activitieswithout distraction. The same applies to the Northern and Southern Traffic EnforcementSections who have to service the entire state and provide support to LSAs upon request.

32 CASR Road Safety Research Report | Best practice review of drink driving enforcement in South Australia
AcknowledgementsThis study was funded by the South Australian Department for Transport, Energy andInfrastructure (DTEI) through a Project Grant to the Centre for Automotive Safety Research.The DTEI Project Manager was Michael White.
The Centre for Automotive Safety Research receives core funding from both DTEI and theSouth Australian Motor Accident Commission.
The authors would like to thank the cooperation of members of the South Australian PoliceForce who participated in interviews and discussions about the topic.
South Australian data for this report (Sections 3.2.1 and 3.2.2) were provided by DanielSilvestri of the Traffic Intelligence Section, Traffic Support Branch. Interstate data wererequested by Andrew Meier of CASR and were provided by: Bob Gyselman, Inspector ofPolice, Corporate Reporting Services, Hobart, Tasmania; Lisa-Marie Folkman, ResearchOfficer, Road Safety Strategic Development and Intelligence Unit, State Traffic SupportBranch, Queensland Police Service; Richard Mu, Manager Statistics Section, NorthernTerritory Police, Fire and Emergency; Peter Dimopoulos, Corporate Statistics, CorporateStrategy and Performance, Victoria; Ian Cairns, Inspector, Traffic Alcohol Section, OperationsUnit, Victoria; Merryn Voysey, Statistical Officer, Crime Statistics Unit, Western AustraliaPolice Service; and Chheng Seav, Intelligence Analyst, Traffic Research and IntelligenceUnit, Traffic Services Branch, New South Wales.
Special thanks to Jaime Royals at CASR for collating the drink driving legislation andpenalties information.
The views expressed in this report are those of the authors and do not necessarily representthose of the University of Adelaide or the sponsoring organisations.

CASR Road Safety Research Report | Best practice review of drink driving enforcement in South Australia 33
ReferencesBaldock MRJ, Woolley JE, Wundersitz LN, McLean AJ (2007). Annual performance indicators of enforced driver
behaviours in South Australia, 2004. Adelaide: Centre for Automotive Safety Research, University of Adelaide.
Delaney A, Diamantopoulo, K, Cameron M (2006). Strategic principles of drink-driving enforcement (No. 249).Clayton, Victoria: Monash University Accident Research Centre.
Delhomme P (1999). Evaluated road safety media campaigns: An overview of 265 evaluated campaigns and somemeta-analysis on accidents (No. 4, GADJET Project, European Commission). Arcueil, France: French NationalInstitute for Transport and Safety Research.
Elliot B (1993). Road safety mass media campaigns: A meta analysis (No. CR118). Canberra: Federal Office of RoadSafety.
Elvik R (2001). Cost-benefit analysis of police enforcement, working paper 1, ESCAPE project. Helsinki: TechnicalResearch Centre of Finland (VTT).
Elvik R, Amundsen AH (2000). Improving road safety in Sweden: An analysis of the potential for improving safety,the cost-effectiveness and cost-benefit ratios of road safety measures (No. 490/2000). Oslo, Norway:Institute of Transport Economics.
ETSC (1999). Police enforcement strategies to reduce traffic casualties in Europe. Brussels: European TransportSafety Council.
Ferguson M, Sheehan M, Davey J, Watson B (1999). Drink-driving rehabilitation: The present context (No. CR 184).Canberra: Australian Transport Safety Bureau.
Harrison W, Fitzharris M (1999). Drinking and driving in rural Victoria: A survey of rural hotel patrons (No. 154).Clayton: Monash University Accident Research Centre.
Harrison W, Newman S, Baldock MRJ, McLean AJ (2003). Drink driving enforcement: Issues in developing bestpractice. Sydney: Austroads.
Harrison WA (2001). Drink driving and enforcement: Theoretical issues and an investigation of the effects of threeenforcement programs in two rural communities (No. AP-R181). Sydney: Austroads.
Hart S, Watson B, Tay R (2003). Barriers and facilitators to the effective operation of RBT in Queensland. Paperpresented at the 2003 Road Safety Research, Policing and Education Conference, Sydney.
Healy D, Wylie B (1998). Evolving drink-driving enforcement strategies and public education in regional Victoria. InProceedings of the road safety research, policing, education conference, 16-17 November 1998, Wellington,New Zealand (Vol. 2, pp. 70-73).
Hendrie D (2003). Random breath testing: Its effectiveness and possible characteristics of a 'best practice'approach (No. RR125). Crawley, Western Australia: University of Western Australia Injury Research Centre.
Henstridge J, Boland J, Harfouch L (1995). Assessment of the effect of random breath testing in Western Australia1988-1994. Perth: Data Analysis Australia.
Henstridge J, Homel R, Mackay P (1997). The long-term effects of random breath testing in four Australian states:A time series analysis (No. CR 162). Canberra: Federal Office of Road Safety.
Homel R (1988). Policing and punishing the drinking driver: A study of general and specific deterrence. New York:Springer-Verlag.
Homel R (1990). Random breath testing and random stopping programs in Australia. In R. J. Wilson & R. E. Mann(Eds.), Drinking and driving: Advances in research and prevention (pp. 159-202). New York: Guilford Press.
ICF Consulting (2003). Costs-benefit analysis of road safety improvements. London, UK: Imperial College Centre forTransport Studies.
Kloeden CN, McLean AJ (1997). Night-time drink driving in Adelaide: 1987-1997 (No. 5/97). Adelaide: Office of RoadSafety.
Koornstra M, Lynam D, Nilsson G, Noordzij P, Petterson H-E, Wegman F, et al. (2002). Sunflower: A comparativestudy of the development of road safety in Sweden, United Kingdom, and the Netherlands. Leidschendam:SWOV.
Makinen T, Zaidel D (2003). Traffic enforcement in Europe; effects, measures, needs and future. Final report of theESCAPE consortium. Brussels: European Commission.
Mathijssen MPM (1995). Effect of Dutch police reorganisation on drink driving. In C. N. Kloeden & A. J. McLean(Eds.), Proceedings of the 13th international conference on alcohol, drugs and traffic safety. Adelaide.
Miller T, Blewden M, Zhang J (2004). Cost savings from a sustained compulsory breath testing and mediacampaign in New Zealand. Accident Analysis and Prevention, 36(5), 783-794.
Ross HL (1982). Deterring the drinking driver: Legal policy and social control. Lexington, Massachusetts.

34 CASR Road Safety Research Report | Best practice review of drink driving enforcement in South Australia
Ryan GA (2000). Roadside survey of drinking drivers in Perth, Western Australia (No. 94). Perth: Road AccidentPrevention Unit.
Tay R (2005). Drink driving enforcement and publicity campaigns: Are the policy recommendations sensitive tomodel specification? Accident Analysis and Prevention, 37, 259-266.
Wagenaar AC, Maldonado-Molina MM (2007). Effects of drivers' licence suspension policies on alcohol-relatedcrash involvement: Long-term follow-up in forty-six states. Alcoholism: Clinical and Experimental Research,31(8), 1-8.
Williams AF, McCartt AT, Ferguson SA (2007). Hardcore drinking drivers and other contributors to the alcohol-impaired driving problem: Need for a comprehensive approach. Traffic Injury Prevention, 8, 1-10.
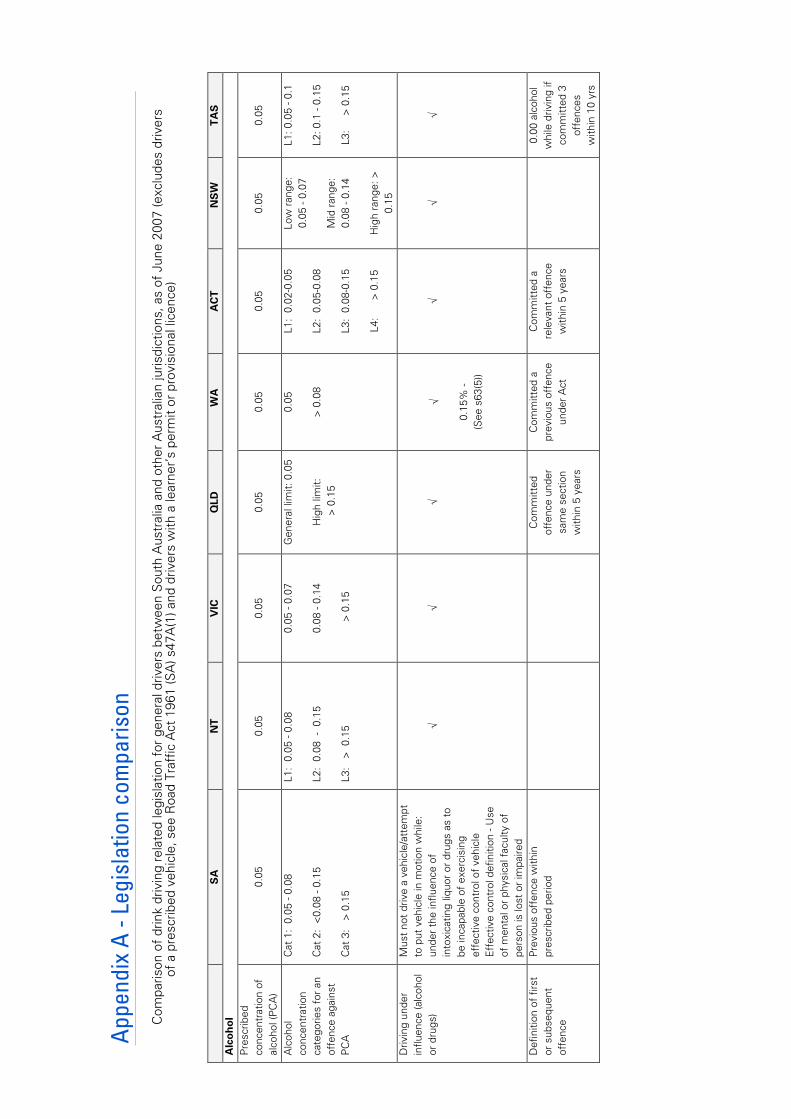
Appe
ndix
A -
Legi
slat
ion
com
paris
onC
ompa
rison
of
drin
k dr
ivin
g re
late
d le
gisl
atio
n fo
r ge
nera
l driv
ers
betw
een
Sou
th A
ustr
alia
and
oth
er A
ustr
alia
n ju
risdi
ctio
ns, a
s of
Jun
e 20
07 (e
xclu
des
driv
ers
of a
pre
scrib
ed v
ehic
le, s
ee R
oad
Traf
fic A
ct 1
961
(SA
) s47
A(1
) and
driv
ers
with
a le
arne
r’s
perm
it or
pro
visi
onal
lice
nce)
SA
NT
VIC
QLD
WA
AC
TN
SW
TAS
Alc
ohol
Pre
scrib
edco
ncen
trat
ion
ofal
coho
l (P
CA
)0.
050.
050.
050.
050.
050.
050.
050.
05
Alc
ohol
conc
entr
atio
nca
tego
ries
for
anof
fenc
e ag
ains
tP
CA
Cat
1:
0.05
- 0.
08
Cat
2:
<0.
08 -
0.15
Cat
3:
> 0
.15
L1:
0.05
- 0.
08
L2:
0.08
- 0
.15
L3:
> 0
.15
0.05
- 0.
07
0.08
- 0.
14
> 0
.15
Gen
eral
lim
it: 0
.05
Hig
h lim
it: >
0.1
5
0.05
> 0
.08
L1:
0.02
-0.0
5
L2:
0.05
-0.0
8
L3:
0.08
-0.1
5
L4:
>
0.1
5
Low
ran
ge:
0.05
- 0.
07
Mid
ran
ge:
0.08
- 0.
14
Hig
h ra
nge:
>0.
15
L1: 0
.05
- 0.1
L2: 0
.1 -
0.15
L3:
>
0.1
5
Driv
ing
unde
rin
fluen
ce (a
lcoh
olor
dru
gs)
Mus
t no
t dr
ive
a ve
hicl
e/at
tem
ptto
put
veh
icle
in m
otio
n w
hile
:un
der
the
influ
ence
of
into
xica
ting
liquo
r or
dru
gs a
s to
be in
capa
ble
of e
xerc
isin
gef
fect
ive
cont
rol o
f ve
hicl
eE
ffec
tive
cont
rol d
efin
ition
- U
seof
men
tal o
r ph
ysic
al f
acul
ty o
fpe
rson
is lo
st o
r im
paire
d
!!
!!
0.15
% -
(See
s63
(5))
!!
!
Def
initi
on o
f fir
stor
sub
sequ
ent
offe
nce
Pre
viou
s of
fenc
e w
ithin
pres
crib
ed p
erio
dC
omm
itted
offe
nce
unde
rsa
me
sect
ion
with
in 5
yea
rs
Com
mitt
ed a
prev
ious
off
ence
unde
r A
ct
Com
mitt
ed a
rele
vant
off
ence
with
in 5
yea
rs
0.00
alc
ohol
whi
le d
rivin
g if
com
mitt
ed 3
offe
nces
with
in 1
0 yr
s
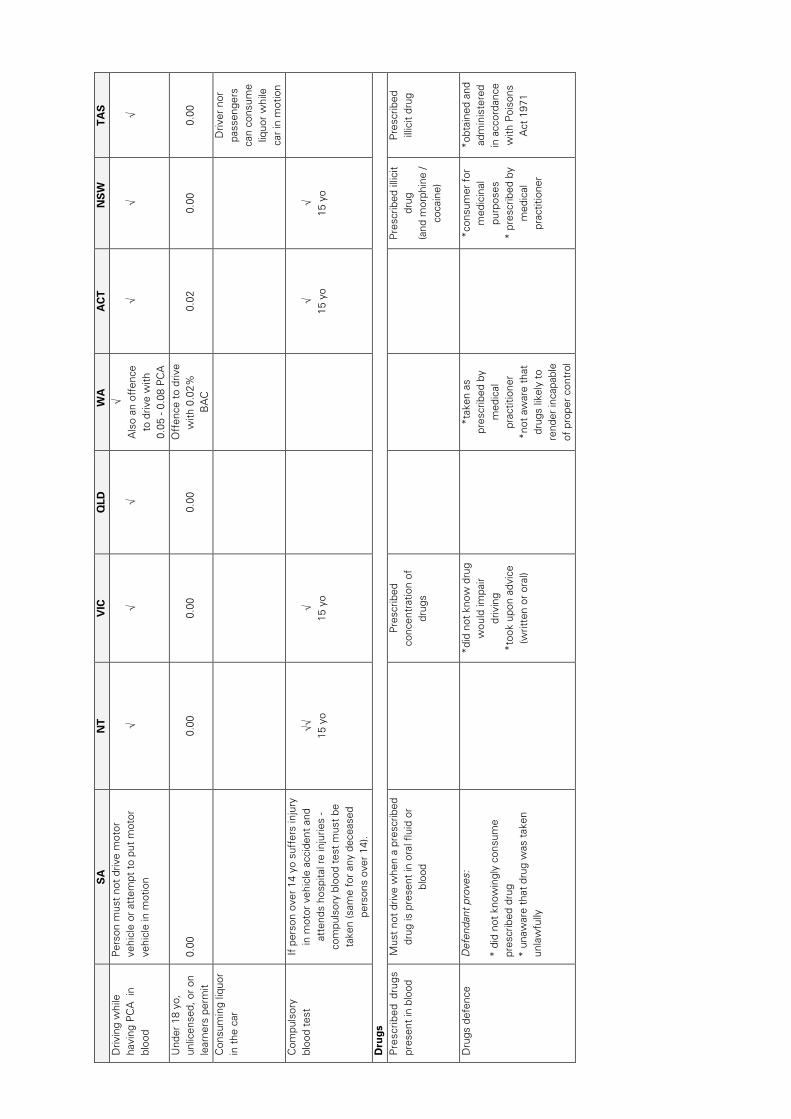
SA
NT
VIC
QLD
WA
AC
TN
SW
TAS
Driv
ing
whi
leha
ving
PC
A i
nbl
ood
Per
son
mus
t no
t dr
ive
mot
orve
hicl
e or
att
empt
to
put
mot
orve
hicl
e in
mot
ion
!!
!
!
Als
o an
off
ence
to d
rive
with
0.05
- 0.
08 P
CA
!!
!
Und
er 1
8 yo
,un
licen
sed,
or
onle
arne
rs p
erm
it0.
000.
000.
000.
00O
ffen
ce t
o dr
ive
with
0.0
2%B
AC
0.02
0.00
0.00
Con
sum
ing
liquo
rin
the
car
Driv
er n
orpa
ssen
gers
can
cons
ume
liquo
r w
hile
car
in m
otio
nC
ompu
lsor
ybl
ood
test
If p
erso
n ov
er 1
4 yo
suf
fers
inju
ryin
mot
or v
ehic
le a
ccid
ent
and
atte
nds
hosp
ital r
e in
jurie
s -
com
puls
ory
bloo
d te
st m
ust
beta
ken
(sam
e fo
r an
y de
ceas
edpe
rson
s ov
er 1
4).
!!
15 y
o!
15 y
o!
15 y
o!
15 y
o
Dru
gsP
resc
ribed
dru
gspr
esen
t in
blo
odM
ust
not
driv
e w
hen
a pr
escr
ibed
drug
is p
rese
nt in
ora
l flu
id o
rbl
ood
Pre
scrib
edco
ncen
trat
ion
ofdr
ugs
Pre
scrib
ed il
licit
drug
(and
mor
phin
e /
coca
ine)
Pre
scrib
edill
icit
drug
Dru
gs d
efen
ceD
efen
dant
pro
ves:
* di
d no
t kn
owin
gly
cons
ume
pres
crib
ed d
rug
* un
awar
e th
at d
rug
was
tak
enun
law
fully
*did
not
kno
w d
rug
wou
ld im
pair
driv
ing
*too
k up
on a
dvic
e(w
ritte
n or
ora
l)
*tak
en a
spr
escr
ibed
by
med
ical
prac
titio
ner
*not
aw
are
that
drug
s lik
ely
tore
nder
inca
pabl
eof
pro
per
cont
rol
*con
sum
er f
orm
edic
inal
purp
oses
* pr
escr
ibed
by
med
ical
prac
titio
ner
*obt
aine
d an
dad
min
iste
red
in a
ccor
danc
ew
ith P
oiso
nsA
ct 1
971
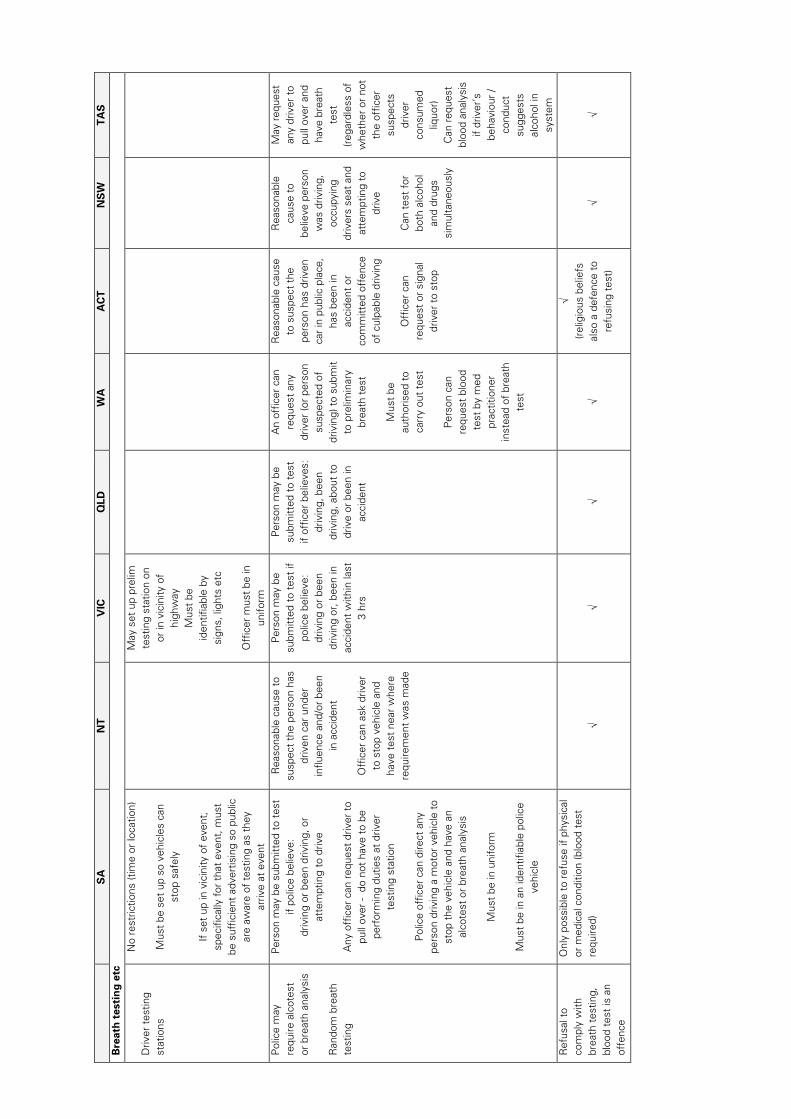
SA
NT
VIC
QLD
WA
AC
TN
SW
TAS
Bre
ath
test
ing
etc
Driv
er t
estin
gst
atio
ns
No
rest
rictio
ns (t
ime
or lo
catio
n)
Mus
t be
set
up
so v
ehic
les
can
stop
saf
ely
If s
et u
p in
vic
inity
of
even
t,sp
ecifi
cally
for
tha
t ev
ent,
mus
tbe
suf
ficie
nt a
dver
tisin
g so
pub
licar
e aw
are
of t
estin
g as
the
yar
rive
at e
vent
May
set
up
prel
imte
stin
g st
atio
n on
or in
vic
inity
of
high
way
Mus
t be
iden
tifia
ble
bysi
gns,
ligh
ts e
tc
Off
icer
mus
t be
inun
iform
Pol
ice
may
requ
ire a
lcot
est
or b
reat
h an
alys
is
Ran
dom
bre
ath
test
ing
Per
son
may
be
subm
itted
to
test
if po
lice
belie
ve:
driv
ing
or b
een
driv
ing,
or
atte
mpt
ing
to d
rive
Any
off
icer
can
req
uest
driv
er t
opu
ll ov
er -
do
not
have
to
bepe
rfor
min
g du
ties
at d
river
test
ing
stat
ion
Pol
ice
offic
er c
an d
irect
any
pers
on d
rivin
g a
mot
or v
ehic
le t
ost
op t
he v
ehic
le a
nd h
ave
anal
cote
st o
r br
eath
ana
lysi
s
Mus
t be
in u
nifo
rm
Mus
t be
in a
n id
entif
iabl
e po
lice
vehi
cle
Rea
sona
ble
caus
e to
susp
ect
the
pers
on h
asdr
iven
car
und
erin
fluen
ce a
nd/o
r be
enin
acc
iden
t
Off
icer
can
ask
driv
erto
sto
p ve
hicl
e an
dha
ve t
est
near
whe
rere
quire
men
t w
as m
ade
Per
son
may
be
subm
itted
to
test
ifpo
lice
belie
ve:
driv
ing
or b
een
driv
ing
or, b
een
inac
cide
nt w
ithin
last
3 hr
s
Per
son
may
be
subm
itted
to
test
if of
ficer
bel
ieve
s:dr
ivin
g, b
een
driv
ing,
abo
ut t
odr
ive
or b
een
inac
cide
nt
An
offic
er c
anre
ques
t an
ydr
iver
(or
pers
onsu
spec
ted
ofdr
ivin
g) t
o su
bmit
to p
relim
inar
ybr
eath
tes
t
Mus
t be
auth
oris
ed t
oca
rry
out
test
Per
son
can
requ
est
bloo
dte
st b
y m
edpr
actit
ione
rin
stea
d of
bre
ath
test
Rea
sona
ble
caus
eto
sus
pect
the
pers
on h
as d
riven
car
in p
ublic
pla
ce,
has
been
inac
cide
nt o
rco
mm
itted
off
ence
of c
ulpa
ble
driv
ing
Off
icer
can
requ
est
or s
igna
ldr
iver
to
stop
Rea
sona
ble
caus
e to
belie
ve p
erso
nw
as d
rivin
g,oc
cupy
ing
driv
ers
seat
and
atte
mpt
ing
todr
ive
Can
tes
t fo
rbo
th a
lcoh
olan
d dr
ugs
sim
ulta
neou
sly
May
req
uest
any
driv
er t
opu
ll ov
er a
ndha
ve b
reat
hte
st(r
egar
dles
s of
whe
ther
or
not
the
offic
ersu
spec
tsdr
iver
cons
umed
liquo
r)C
an r
eque
stbl
ood
anal
ysis
if dr
iver
’sbe
havi
our
/co
nduc
tsu
gges
tsal
coho
l in
syst
emR
efus
al t
oco
mpl
y w
ithbr
eath
tes
ting,
bloo
d te
st is
an
offe
nce
Onl
y po
ssib
le t
o re
fuse
if p
hysi
cal
or m
edic
al c
ondi
tion
(blo
od t
est
requ
ired)
!!
!!
!
(rel
igio
us b
elie
fsal
so a
def
ence
to
refu
sing
tes
t)!
!
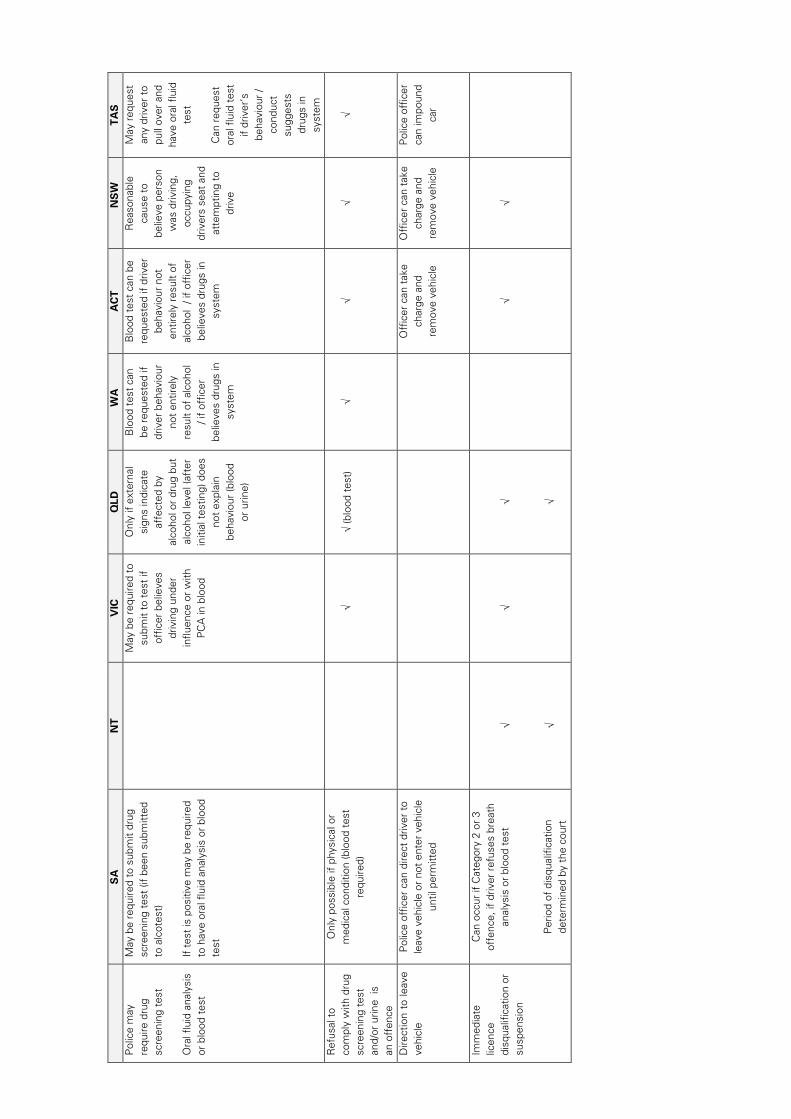
SA
NT
VIC
QLD
WA
AC
TN
SW
TAS
Pol
ice
may
requ
ire d
rug
scre
enin
g te
st
Ora
l flu
id a
naly
sis
or b
lood
tes
t
May
be
requ
ired
to s
ubm
it dr
ugsc
reen
ing
test
(if
been
sub
mitt
edto
alc
otes
t)
If t
est
is p
ositi
ve m
ay b
e re
quire
dto
hav
e or
al f
luid
ana
lysi
s or
blo
odte
st
May
be
requ
ired
tosu
bmit
to t
est
ifof
ficer
bel
ieve
sdr
ivin
g un
der
influ
ence
or
with
PC
A in
blo
od
Onl
y if
exte
rnal
sign
s in
dica
teaf
fect
ed b
yal
coho
l or
drug
but
alco
hol l
evel
(aft
erin
itial
tes
ting)
doe
sno
t ex
plai
nbe
havi
our
(blo
odor
urin
e)
Blo
od t
est
can
be r
eque
sted
ifdr
iver
beh
avio
urno
t en
tirel
yre
sult
of a
lcoh
ol/ i
f of
ficer
belie
ves
drug
s in
syst
em
Blo
od t
est
can
bere
ques
ted
if dr
iver
beha
viou
r no
ten
tirel
y re
sult
ofal
coho
l / i
f of
ficer
belie
ves
drug
s in
syst
em
Rea
sona
ble
caus
e to
belie
ve p
erso
nw
as d
rivin
g,oc
cupy
ing
driv
ers
seat
and
atte
mpt
ing
todr
ive
May
req
uest
any
driv
er t
opu
ll ov
er a
ndha
ve o
ral f
luid
test
Can
req
uest
oral
flu
id t
est
if dr
iver
’sbe
havi
our
/co
nduc
tsu
gges
tsdr
ugs
insy
stem
Ref
usal
to
com
ply
with
dru
gsc
reen
ing
test
and/
or u
rine
isan
off
ence
Onl
y po
ssib
le if
phy
sica
l or
med
ical
con
ditio
n (b
lood
tes
tre
quire
d)!
! (b
lood
tes
t)!
!!
!
Dire
ctio
n to
leav
eve
hicl
eP
olic
e of
ficer
can
dire
ct d
river
to
leav
e ve
hicl
e or
not
ent
er v
ehic
leun
til p
erm
itted
Off
icer
can
tak
ech
arge
and
rem
ove
vehi
cle
Off
icer
can
tak
ech
arge
and
rem
ove
vehi
cle
Pol
ice
offic
erca
n im
poun
dca
r
Imm
edia
telic
ence
disq
ualif
icat
ion
orsu
spen
sion
Can
occ
ur if
Cat
egor
y 2
or 3
offe
nce,
if d
river
ref
uses
bre
ath
anal
ysis
or
bloo
d te
st
Per
iod
of d
isqu
alifi
catio
nde
term
ined
by
the
cour
t
! !
!! !
!!

SA
NT
VIC
QLD
WA
AC
TN
SW
TAS
Off
ende
rs t
oat
tend
lect
ures
Per
son
char
ged
with
firs
t/se
cond
offe
nce
but
not
conv
icte
d by
cour
t - a
tten
d a
lect
ure
with
in 6
mon
ths
Driv
er e
duca
tion
prog
ram
req
uire
dfo
r of
fend
ers
unde
r25
yo
!
! (i
f he
ldlic
ence
und
er12
mth
s an
dco
mm
itsof
fenc
e)A
lcoh
ol In
terlo
ckS
chem
e!
!!**
!*
!**
* N
ot in
sam
e A
ct a
s ot
her
drin
k dr
ivin
g pr
ovis
ions
- R
oad
Tran
spor
t (D
river
Lic
ensi
ng) A
ct 1
998
** M
entio
ned
brie
fly b
ut n
o pr
ovis
ions
in p
lace
to
enfo
rce:
TAS
- V
ehic
le a
nd T
raff
ic (D
river
Lic
ensi
ng a
nd V
ehic
le R
egis
trat
ion)
Reg
ulat
ions
200
0A
CT
- Roa
d Tr
ansp
ort
(Driv
er L
icen
sing
) Reg
ulat
ion
2000

Appendix B - Penalty comparison
Comparison of penalties for drink driving related offences for general drivers as of June 2007 (excludesdrivers of a prescribed vehicle, see Road Traffic Act 1961 (SA) s47A(1) and drivers with a learner’s permit orprovisional licence)
Note that all states other than SA list their pecuniary penalties in 'penalty units' as opposed to monetaryamounts:
NT Penalty Unit Act ($110 - current at 5 Aug 2002)QLD Penalties & Sentencing Act 1992 ($75 - at 30 April 2007)ACT Legislation Act 2001 ($100 - at 12 April 2007)WA Road Traffic Act 1974 ($50 - at 10 March 1996)TAS Penalty Units & Other Penalties Act 1987 ($100 - at 6 June 2007)NSW Crimes (Sentencing Procedure) Act 1999 ($110 - at 1 March 2005)VIC Monetary Units Act 2004 / Victorian Government Gazettes ($110.12 - at 27 Feb 2007)
Notes for Table Overleaf:
* SA 0.00* NT 0.00 - under 18, unlicenced, learners permit, probationary, commercial vehicle* WA 0.02 - probationary licence holder* ACT 0.02 - learners or probationary licence holder, suspended licence etc* QLD 0.00 - probationary or learners permit / restricted licence* TAS 0.00 - under 18, unclicensed, learner or probationary* NSW 0.00 - learners or probationary licence* VIC 0.00 - learners or probationary licence
** TAS - only urine test** NSW - also includes sobriety assessment

Fin
e (
$)
Imprisonm
ent
(month
s)
Dis
qulif
ication
(month
s)
Fin
e (
$)
Imprisonm
ent
(month
s)
Dis
qulif
ication
(month
s)
Fin
e (
$)
Imprisonm
ent
(month
s)
Dis
qulif
ication
(month
s)
Fin
e (
$)
Imprisonm
ent
(month
s)
Dis
qulif
ication
(month
s)
Fin
e (
$)
Imprisonm
ent
(month
s)
Dis
qulif
ication
(month
s)
Fin
e (
$)
Imprisonm
ent
(month
s)
Dis
qulif
ication
(month
s)
Fin
e (
$)
Imprisonm
ent
(month
s)
Dis
qulif
ication
(month
s)
Fin
e (
$)
Imprisonm
ent
(month
s)
Dis
qulif
ication
(month
s)
Dri
vin
g u
nd
er
the in
flu
en
ce -
d
rug
s/a
lco
ho
l
First offence
700-1
200
or
312
1100
or
12
6800-2
500
62100
or
96
500-3
000
or
12
.12-3
62200
and/o
r 9
12
2753
or
3
Second o
ffence
1500-3
500
or
924
4500
or
18
12
36
13214.4
or
12
Subsequent offence
2000-5
000
or
18
Perm
18
24
60
19821.6
or
18
Dri
vin
g w
hile in
toxic
ate
d5000
36
Dri
vin
g w
ith
pre
scri
bed
co
nc o
f alc
oh
ol in
blo
od
First offence:
0.0
5-0
.06
200
0.0
6-0
.07
200
0.0
7-0
.08
200
0.0
8-0
.09
400-1
500
3
0.0
9-0
.10
500-1
500
3
0.1
0-0
.11
500-1
500
410
0.1
1-0
.12
600-1
500
411
0.1
2-0
.13
600-1
500
512
0.1
3-0
.14
700-1
500
513
0.1
4-0
.15
700-1
500
614
0.1
5-0
.16
15
0.1
6-0
.17
16
0.1
7-0
.18
17
0.1
8-0
.19
18
0.1
9-0
.20
19
0.2
0-0
.21
20
0.2
1-0
.22
21
0.2
2-0
.23
22
0.2
3-0
.24
23
0.2
4+
24
Second o
ffence:
0.0
5-0
.06
250-5
00
3
0.0
6-0
.07
300-5
00
3
0.0
7-0
.08
350-5
00
314
0.0
8-0
.09
800-1
500
616
0.0
9-0
.10
800-1
500
618
0.1
0-0
.11
1000-1
500
620
0.1
1-0
.12
1000-1
500
722
0.1
2-0
.13
1200-1
500
824
0.1
3-0
.14
1200-1
500
10
26
0.1
4-0
.15
1200-1
500
12
28
0.1
5-0
.16
30
0.1
6-0
.17
32
0.1
7-0
.18
34
0.1
8-0
.19
36
0.1
9-0
.20
38
0.2
0-0
.21
40
0.2
1-0
.22
42
0.2
2-0
.23
44
0.2
3-0
.24
46
0.2
4+
48
Third o
ffence:
0.0
5-0
.06
250-5
00
3
0.0
6-0
.07
300-5
00
3
0.0
7-0
.08
350-5
00
3
0.0
8-0
.09
800-1
500
6
0.0
9-0
.10
800-1
500
7
0.1
0-0
.11
1000-1
500
8
0.1
1-0
.12
1000-1
500
9
0.1
2-0
.13
1200-1
500
10
0.1
3-0
.14
1200-1
500
12
0.1
4-0
.15
1200-1
500
14
0.1
5-0
.16
0.1
6-0
.17
0.1
7-0
.18
0.1
8-0
.19
0.1
9-0
.20
0.2
0-0
.21
0.2
1-0
.22
0.2
2-0
.23
0.2
3-0
.24
0.2
4+
Dri
vin
g w
ith
pre
scri
bed
dru
gs in
ora
l fl
uid
or
blo
od
First offence
500-9
00
1100
61321.4
4
Second o
ffence
700-1
200
612
6607.2
Third o
ffence
1100-1
800
12
Subsequent offence
1100-1
800
24
Refu
se b
reath
an
aly
sis
First offence
700-1
200
12
1100
or
12
12
800-2
500
6and/o
r 6
500-3
000
or
12
12-3
636
1321.4
4
Second o
ffence
1500-3
500
or
924
60
13214.4
or
12
Subsequent offence
2000-5
000
or
18
Perm
19821.6
or
18
Refu
se d
rug
scre
en
ing
test,
ora
l fl
uid
test
**
2100
or
9
First offence
500-9
00
64500
or
18
500-3
000
or
12
12-3
636
1321.4
4
Second o
ffence
1100-1
800
24
18
1000-6
000
or
24
24-7
260
6607.2
Subsequent offence
13214.4
Refu
se b
loo
d t
est
***
First offence
500-9
00
611
00
or
12
800-2
500
62100
or
9500-3
000
or
12
12-3
63300
36
1321.4
4
Second o
ffence
1500-3
500
or
924
4500
or
18
60
13214.4
or
12
Subsequent offence
2000-5
000
or
18
Perm
18
19821.6
or
18
Refu
se c
om
pu
lso
ry b
loo
d t
est
in h
osp
ital aft
er
accid
en
t
First offence
700-1
200
12
3300
and/o
r 18
36
1321.4
42
Subsequent offence
1500-2
500
36
5500
and/o
r 24
60
13214.4
or
12
4
19821.6
or
18
4
Refu
se t
o leave v
eh
icle
(in
str
ucte
d t
o d
o s
o b
ecau
se n
ot
fit
to d
rive)
5000
Refu
sal to
sto
p v
eh
icle
fo
r b
reath
an
aly
sis
/bre
ath
test
22000
or
12
1100
Refu
se o
ral fl
uid
test
aft
er
arr
est
First offence
3300
36
Subsequent offence
5500
or
18
60
Refu
se b
reath
test
or
blo
od
test
aft
er
arr
est
First offence
3300
and/o
r 18
36
Subsequent offence
5500
and/o
r 24
60
Sp
ecia
l d
river*
- d
rivin
g w
ith
pre
scri
bed
co
nc o
f alc
oh
ol
First offence
550
or
12
3500
3200-1
000
or
33-1
211
00
6
Subsequent offence
1100
or
12
61000
12
400-2
000
or
66-2
42200
12
Off
en
ce
NS
WV
IC
1100
2200
and/o
r 9
3300
and/o
r 18
3300
and/o
r 12
60
2200
12
3300
and/o
r 12
36
5500
or
18
5500
and/o
r 24
2200
1100
or
24
24-7
2
or
66-1
8
or
66-2
4
24-7
2
200
3
1100
2100
or
9
800-4
000
or
12
1000-6
000
or
24
1050 / 1
500
or
3 / 6
18
3000
or
6
1000-6
000
or
33-1
2
400-2
000
1000-6
000
or
12
12-3
6
12-3
6
or
24
24-7
2
200-1
000
500-3
000
400-2
000
or
9
TA
S
1000-6
000
or
24
24-7
2
or
6
1050
or
3
QL
D
2100
1500
4500
or
18
100-3
00
2200
or
12
24
1200-1
500
6 12
12
18
18
2200
WA
NT
825
or
6
12
3000
and/o
r 12
3000
AC
T
1000
and/o
r 6
36
and/o
r 12
60
36
1000
12
3
3000
36
500
1000
and/o
r 6
12
1500
and/o
r 9
2000
1100-1
800
6 12
14
1500-2
500
36
2200
or
12
36
or
12
700-1
500
1200-1
500
825
or
6
2200
or
12
1100
or
12
3000
SA
or
12
2200
550
or
3700
1500-2
500
or
6
36
700
1100-1
800
6 (
or
12 for
subsequent)
1500-2
500
24
36
500-9
00
6
700-1
200
12
700
700-1
200
1200-2
000
3 12
1321.4
4
13214.4
or
12
6607.2
or
6
13214.4
or
12
66 12
6 12
36
19821.6
or
18
13214.4